I. INTRODUCTION
Dynamic-mode cantilever sensors are employed for many different applications, ranging from the use as mass sensors in biology,Reference Gfeller, Nugaeva and Hegner1–Reference Johnson and Mutharasan3 and gas sensors (‘artificial nose’)Reference Baller, Lang, Fritz, Gerber, Gimzewski, Drechsler, Rothuizen, Despont, Vettiger, Battiston, Ramseyer, Fornardo, Meyer and Güntherodt4 to the study of novel materials.Reference Gross, Weber, Rffer, Buchter, Heimbach, Fontcuberta i Morral, Grundler and Poggio5–Reference Körner, Reiche, Ghunaim, Fuge, Hampel, Büchner and Mühl7 In materials research, mainly scanning probe methods and cantilever magnetometry are used. In the former case, the cantilever is equipped with an interaction tip and is scanned across the sample surface.Reference Binnig, Quate and Gerber8 In cantilever magnetometry, the sample is placed onto the cantilever and subject to a known interaction which in many cases is a magnetic field.Reference Rossel, Bauer, Zech, Hofer and Willemin9 Many different samples have been studied by cantilever magnetometry which included magnetite rocks,Reference Martín-Hernández, Bominaar-Silkens, Dekkers and Maan10 thin ferromagnetic layers,Reference Löhndorf, Moreland, Kabos and Rizzo11–Reference Harris, Awschalom, Matsukura, Ohno, Maranowski and Gossard13 nanowires,Reference Buchter, Nagel, Rüeffer, Xue, Weber, Kieler, Weinmann, Kohlmann, Zorin, Russo-Averchi, Huber, Berberich, Fontcuberta i Morral, Kemmler, Kleiner, Koelle, Grundler and Poggio14–Reference Banerjee, Wolny, Pelekhov, Herman, Fong, Weissker, Mühl, Obukhov, Leonhardt, Büchner and Hammel17 small magnetic particlesReference Gysin, Rast, Aste, Speliotis, Werle and Meyer6 as well as magnetotactic bacteria.Reference Gysin, Rast, Aste, Speliotis, Werle and Meyer6
In contrast to the static mode where the static bending of the cantilever beam is evaluated, the dynamic mode makes use of the change of oscillatory properties of a cantilever excited to oscillations at or close to its resonance frequency. The change of the beam’s oscillatory state, i.e., amplitude, phase, resonance frequency, due to an interaction is usually detected by laser-based methods (deflectometry, interferometry). This signal can then be related to the properties of the sample under investigation.Reference Giessibl, Pielmeier, Eguchi, An and Hasegawa18
With decreasing sample size and increasingly weak interactions, the sensitivity of dynamic-mode cantilever sensors has to be increased. The usually used frequency shift signal Δω is related to an external interaction by:
 $${{\Delta \omega } \over {{\omega _0}}} = \sqrt {{{k + \Delta k} \over {{m_{{\rm{eff}}}} + \Delta m}}} - \sqrt {{k \over {{m_{{\rm{eff}}}}}}} \approx \left\{ {\matrix{ {{{\Delta k} \over {2k}}} & {{\rm{for}}\;\Delta m \approx 0} \cr {{{\Delta m} \over {2{m_{{\rm{eff}}}}}}} & {{\rm{for}}\;\Delta k \approx 0} \cr} } \right.\quad ,$$
where Δk represents an external force gradient along the oscillation direction,Reference Giessibl, Pielmeier, Eguchi, An and Hasegawa18 Δm an additional mass (either point mass or mass distributionReference Ilic, Yang and Craighead19) and k, m eff and ω 0 are the cantilever’s spring constant, effective mass and resonance frequency. Equation (1) shows that to increase the frequency shift signal in case of small interactions, the cantilever spring constant and effective mass need to be reduced. A common way to achieve this is by reducing the beam’s dimensions,Reference Gysin, Rast, Aste, Speliotis, Werle and Meyer6 thereby transitioning from micro-to nano-scaled beams. However, the decrease in size poses a challenge for reliable detection of the cantilever’s oscillatory state with the common laser-based methods.Reference Li, Tang and Roukes20 Some experiments demonstrated the direct detection of a nanocantilever’s oscillatory state with sophisticated set-ups.Reference Gil-Santos, Ramos, Martinez, Fernandez-Regulez, Garcia, San Paulo, Calleja and Tamayo21,Reference Nichol, Hemesath, Lauhin and Budakian22 These included the use of laser-interferometry on nanowires with (100–300) nm diameter where the interferometric contrast was obtained from the difference between the light reflected from nanowire and substrate, respectivelyReference Gil-Santos, Ramos, Martinez, Fernandez-Regulez, Garcia, San Paulo, Calleja and Tamayo21 or by polarization-enhancement.Reference Nichol, Hemesath, Lauhin and Budakian22 In other cases, special geometric features, e.g., paddle structures, are used to ensure laser-based detection.Reference Gross, Weber, Rffer, Buchter, Heimbach, Fontcuberta i Morral, Grundler and Poggio5
Although these approaches are successful in reading-out the oscillatory state of nanocantilevers, they are rarely compatible with standard equipment and require specialized experimental conditions.
Additionally, a reduction of cantilever dimensions usually increases phase noise and, consequently, leads to a reduction of the quality factor and detectability.Reference Lochon, Dufour and Rebiére23,Reference Yasumura, Stowe, Chow, Pfafman, Kenny, Stipe and Rugar24 This may not be a significant drawback for high-vacuum conditions which are often used in materials research but it may become a challenge for applications under ambient conditions.
These challenges so far hinder a widespread use of highly sensitive nanocantilevers. Consequently, new methods to find the optimal balance between an increase in sensitivity and maintaining sufficient detectability, preferably with state-of-the-art equipment, need to be developed. A recently introduced co-resonant sensor concept for cantilevers resolves that challenge by mechanical coupling of a micro- and a nanocantilever.Reference Reiche, Körner, Büchner and Mühl25 Through matching of the beams’ eigenfrequencies, which will be denoted as co-resonance in the following, a strong interplay between the beams is induced. This results in a system where any interaction applied at the nanocantilever (which can be made very soft, i.e., sensitive) alters the oscillatory state of the coupled system as a whole which is detected by measuring the oscillatory state of the microcantilever with standard laser-based deflectometry. Furthermore, the properties of the coupled system become a mix of the parameters of the individual beams.
Based on that concept, sensors consisting of a commercially available silicon microcantilever and carbon nanotube (CNT) have been fabricated and used in various cantilever magnetometry experiments.Reference Körner, Reiche, Ghunaim, Fuge, Hampel, Büchner and Mühl7,Reference Reiche, Körner, Büchner and Mühl25,Reference Körner, Reiche, Büchner, Gerlach and Mühl26
Here, a model sensor where an iron-filled carbon nanotube (FeCNT) was used as nanocantilever is chosen to exemplarily demonstrate the effect of the co-resonant concept for cantilever sensors in materials research and to show the reliable derivation of a full set of relevant magnetic sample properties. Thereby, the described evaluation steps are of general nature and not specific for the iron-nanowire sample but can be followed similarly for studying any kind of magnetic sample.
In the presented case, the FeCNT acted simultaneously as nanocantilever and magnetic sample as it contains a single domain α-iron core.Reference Lipert, Bahr, Wolny, Atkinson, Weissker, Mühl, Schmidt, Büchner and Klingeler27 These same kind of FeCNTs have already been studied in cantilever magnetometryReference Banerjee, Wolny, Pelekhov, Herman, Fong, Weissker, Mühl, Obukhov, Leonhardt, Büchner and Hammel17,Reference Lipert, Bahr, Wolny, Atkinson, Weissker, Mühl, Schmidt, Büchner and Klingeler27–Reference Philippi, Weissker, Mühl, Leonhardt and Büchner30 and the scope of this paper is therefore not to present measurements on a novel material. Instead, the focus is on demonstrating how the co-resonant measurement principle can increase the sensitivity of dynamic-mode cantilever sensors in materials research by comparing its results to conventional cantilever magnetometry. In the remainder of this publication, the implications of the co-resonant concept will briefly be reviewed and then the application for materials research will be illustrated by unpublished data of cantlilever magnetometry of iron-filled carbon nanotubes. It will exemplarily be demonstrated that the magnetic properties of the iron core can be reliably derived from frequency shift data obtained by the co-resonant sensor with unprecedented high signal strength.
II. THE CO-RESONANT SENSOR CONCEPT
The basis of the co-resonant sensor concept is the mechanical coupling of a micro- and a nanocantilever whose dimensions and, consequently, parameters (stiffness, effective mass, eigenfrequency) can be vastly different. Each beam has its own set of eigenfrequencies for its bending modes depending on the geometry according to Euler–Bernoulli beam theory.Reference Rossing and Fletcher31 The co-resonance is introduced into the coupled system by matching of the eigenfrequencies for a certain set of bending modes of each individual beam. A coupled system where the eigenfrequencies of the first bending mode of micro- and nanocantilever are matched is considered in this publication but it has to be noted that other combinations are possible and used as well.Reference Reiche, Körner, Büchner and Mühl32
The co-resonant coupling creates a system whose oscillatory state is altered by any interaction applied at the nanocantilever but can be detected by simply measuring the oscillation of the microcantilever.
It has to be noted here that the term frequency matching may be misleading as the eigenfrequencies do not have to match exactly. The effects of the co-resonance already occur at eigenfrequency deviations of (10–20) % and sometimes even more, depending on the parameters of the individual beams.
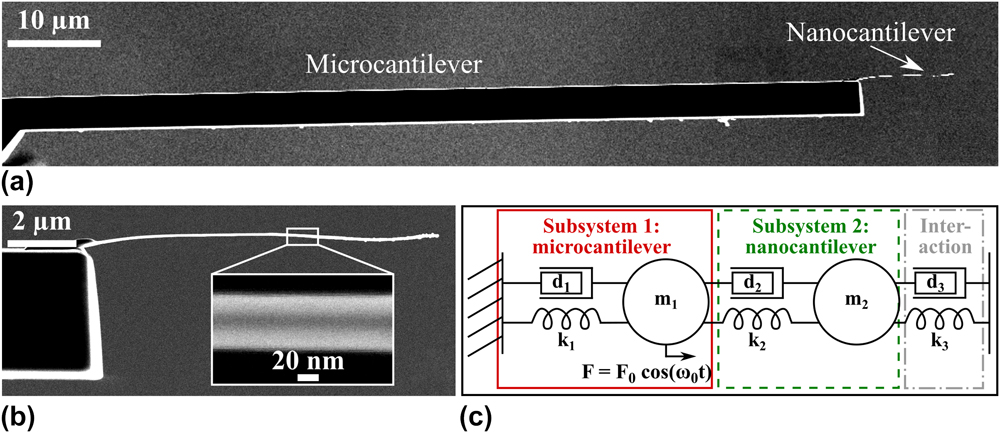
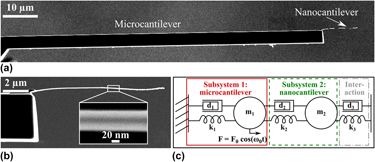
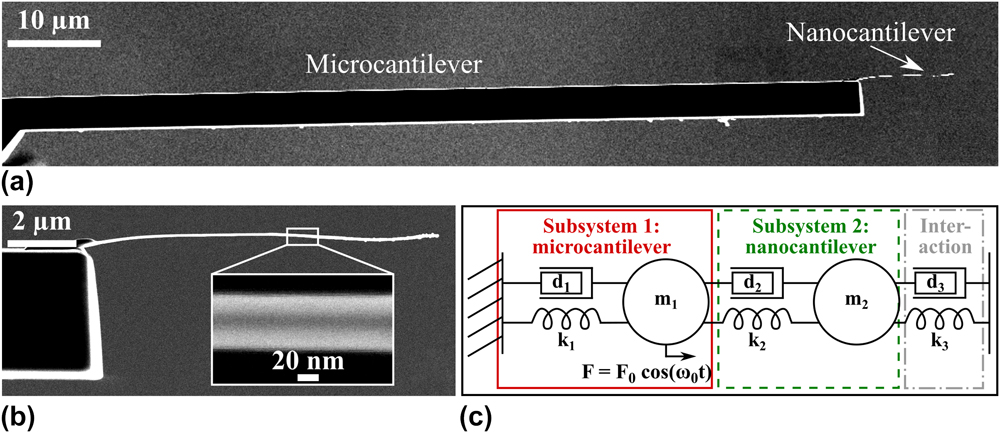
To study the co-resonantly coupled system, it can be modelled as a coupled harmonic oscillator [see Fig. 1(c)] based on the harmonic oscillator model used for an individual cantilever beam.Reference Rast, Wattinger, Gysin and Meyer33 This allows to analyze the behaviour of the system, for example with respect to an external interaction or the dependence of the coupled system’s parameters on the degree of frequency matching and the properties of the individual subsystems. For an in-depth discussion of these effects please refer to other publications, e.g., Refs. Reference Reiche, Körner, Büchner and Mühl25, Reference Körner, Reiche, Büchner, Mühl and Gerlach34, and Reference Körner35.
(a) SEM side view image of an experimentally realized co-resonantly coupled sensor consisting of a silicon microcantilever and an iron-filled carbon nanotube as nanocantilever. (b) Magnification of nanocantilever with inset showing the iron filling (darker area in the middle). (c) Coupled harmonic oscillator model of the coupled sensor. Each subsystem (1, 2) consists of a spring k 1,2, damping element d 1,2 and effective mass m 1,2. An external interaction can be modelled by an additional spring k 3 and/or additional damping element d 3. The system is driven to oscillate by a periodic force F(t) applied at the microcantilever (subsystem 1).
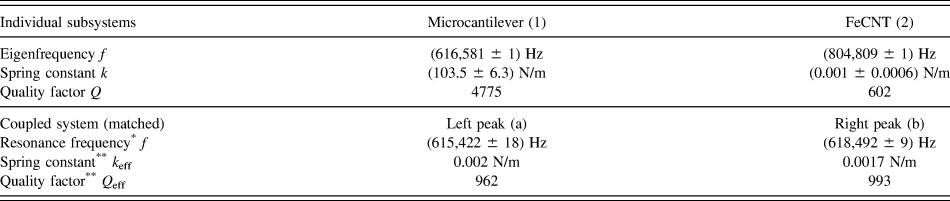
However, one important point needs to be remarked here with respect to the interpretation of the data presented below. The amplitude response curve of the coupled system features two resonance peaks due to the coupling of two oscillators. A consequence of the co-resonance is that the parameters of both resonance peaks of the coupled system lie in between the properties of the individual beams. This leads to effective parameters (spring constant, effective mass, quality factor) for both resonance peaks which can be described as a function of the eigenfrequency deviation.Reference Körner35,Reference Körner36 As an example, for closely matched eigenfrequencie (1–2% deviation), the effective spring constant will be very close to the spring constant of the nanoncantilever. Consequently, these effective parameters are the reason for the increased sensitivity of the coupled system.
To distinguish between the properties of the individual subsystems and those of the coupled system, in the following the indices 1, 2 will be used for micro- and nanocantilever, and a, b for the left and right resonance peak of the coupled system.
Based on this brief discussion, two main advantages of the co-resonantly coupled system can be identified: its sensitivity and detectability (i.e., signal-to-noise-ratio for the frequency shift signal) can be tuned by the degree of frequency matching and the choice of parameters for the individual subsystems. Consequently, as mainly the sensitivity of the nanocantilever affects that of the coupled system, the concept offers the potential for integration of a self-sensing self-actuating scheme. That is usually not used for highly sensitive (nano)cantilever sensors as it requires the deposition of additional piezoelectric layers on the cantilever which increase stiffness and result in a reduction of sensitivity. However, for the co-resonant concept, the self-sensing and self-actuation can be incorporated into the microcantilever while the nanocantilever as the sensitive element is unaffected and the overall parameters of the coupled system will only be marginally affected. This will ultimately allow applications with small space requirements where optical oscillation detection is not possible.
III. APPLICATION OF THE CO-RESONANT CONCEPT FOR MATERIALS CHARACTERIZATION
A. Sensor fabrication
The experimental implementation of the coupled system discussed here, consists of an iron-filled carbon nanotube coupled to a commercially available tipless silicon microcantilever. It is important to note that this is only one possible sensor realization in terms of geometry as well as choice of sensor material. A geometry with the nanocantilever perpendicular to the microcantilever has also been used in other experiments in scanning probe microscopyReference Reiche, Körner, Büchner and Mühl32 and methods to fabricate co-resonantly coupled sensor structures by microfabrication from silicon or silicon nitride are currently under investigation. Such techniques will eventually allow to tremendously facilitate sensor characterization as structures with a predefined degree of eigenfrequency matching (within the process variation) could be fabricated directly. Without such a process, sensors need to be individually characterized and frequency matched as described in the following.
The key point in sensor design and fabrication is to create a nanocantilever which has a very low stiffness (for force gradient-based applications) and/or very small effective mass (applications relying on mass changes), as outlined in the section describing the basic concept. In case of the exemplary sensor described here, the favorably low stiffness of a CNT nanocantilever is exploited.
In the exemplary case discussed here, sensor fabrication, including frequency matching and characterization, was carried out in a focused ion beam (FIB) equipment Zeiss FIB CrossBeam 1540 XB (Jena, Germany) under high vacuum as described in Ref. Reference Körner, Reiche, Büchner, Gerlach and Mühl26 and the cantilever beams were aligned so that their long axes were in parallel [see Fig. 1(a)]. Geometric properties of microcantilever and FeCNT, including the diameter of the iron-filling d Fe ≈ (24 ± 6) nm, were obtained by measurements with the scanning electron microscope (SEM) capability of the machine.
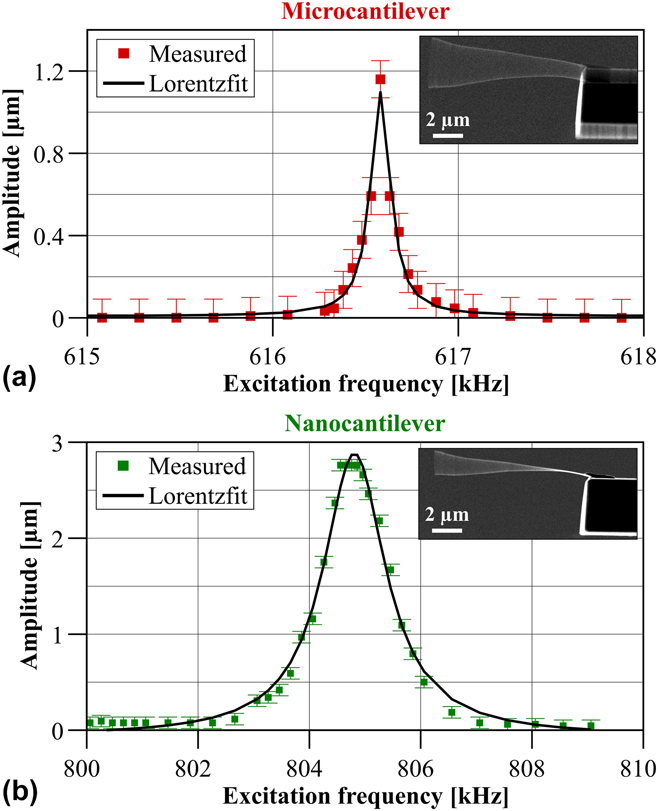
The oscillatory properties of the sensor were determined with a home-built vibration stage which allowed to excite the sensor to oscillations at varying frequencies via a piezoplate. By sweeping the excitation frequency and observing the oscillation envelope of the sensor in the SEM, the eigenfrequencies were identified. The amplitude of the oscillation envelope was measured to generate an amplitude response curve for both eigenfrequencies. By fitting the quadratic amplitude values with a Lorentzian peak function, the quality factors Q 1,2 for micro- and nanocantilever could be calculated according to the definition Q = B w/f 0,Reference Blanter, Golovin, Neuhäuser and Sinning37 with the bandwidth B w and the resonance frequency f 0. Figures 2(a) and 2(b) show the measured and fitted data for micro- and nanocantilever.
Squared amplitude values for microcantilever obtained from SEM images and amplitude response curve fitted by a Lorentzian peak function (solid line) for (a) microcantilever and (b) nanocantilever. The insets show the oscillation envelope at the resonance frequency of micro- and nanocantilever before eigenfrequency matching, respectively.
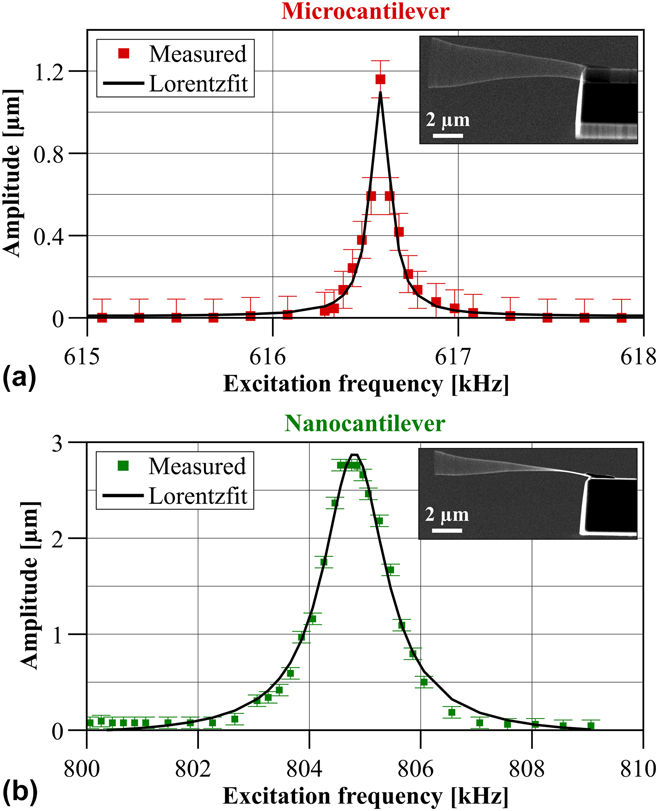
Please note that the amplitude response curve for the individual microcantilever has been obtained before attaching the nanocantilever and that of the FeCNT was measured after farbication but before the eigenfrequency matching. The latter was done by holding the microcantilever with the micromanipulator, thereby effectively decoupling the system so that only the nanocantilever could freely oscillate. The properties of micro- and nanocantilever are summarized in Table I.
Numerical values for microcantilever (1) and FeCNT (2). Please note that the values are given for the initial state before frequency matching for the individual subsystems (upper rows). The lower rows summarize the effective parameters for both resonance peaks (a—left peak, b—right peak) of the coupled system in case of eigenfrequency matching (deviation less than 0.2%).

* Parameter measured.
** Parameter calculated based on coupled harmonic oscillator model.
Eigenfrequency matching was achieved by electron beam-assisted deposition of amorphous carbon at the free end of the FeCNT which lowered its eigenfrequency close to that of the microcantilever. The frequency matching led to two resonance peaks of the coupled system whose amplitude response curves and corresponding resonance frequencies were obtained as for the individual subsystems.
These information were used in the coupled harmonic oscillator model to calculate the effective parameters spring constant and quality factor for both peaks also given in Table I. Details thereof can be found in Refs. Reference Körner, Reiche, Büchner, Mühl and Gerlach34 and Reference Körner35. It is found that the effective properties are very close to that of the individual nanocantilever, i.e., a high sensitivity of this co-resonantly coupled sensor is to be expected due to the low effective spring constant.
B. Cantlilever magnetometry measurement set-up
Cantilever magnetometry is a technique to study magnetic properties of samples which are placed onto the cantilever beam and are subject to a known (quasi)static magnetic field. The interaction between the magnetic field and the sample creates a restoring force on the cantilever, thereby altering its oscillatory state which is detected with laser-based methods.Reference Höpfl, Sander, Höche and Kirschner12
In contrast to conventional cantilever magnetometry, in the co-resonant case the sample is placed at the end of the nanocantilever but the read-out still takes place at the microcantilever.Reference Körner, Reiche, Büchner and Mühl38 The experiment discussed here was carried out at room temperature and under high vacuum in a NanoScan AG hr-MFM (Dübendorf, Switzerland) which employs laser-deflection with a sectioned photodiode to detect the oscillatory state of the microcantilever.
Please note that the experiment could have been done with any state-of-the-art scanning probe equipment and does not require a specialized set-up. In principle it would also be possible to carry out the experiment under ambient conditions but due to the low quality factor of the used CNT that was not possible in this case. However, the co-resonant concept itself is not restricted to certain pressure values or temperatures.
The magnetometry measurement requires the introduction of a well-known magnetic field of changeable magnitude which can interact with the sample. This could be realized by an electromagnet where the magnetic field is controlled by the current in a coil. This set-up allows for a very homogeneous magnetic field of precisely controllable magnitude (after calibration). However, heat generation in the coil, especially in vacuum where convective cooling is prevented, is a drawback which requires fast sweeping of the magnetic field strength and extended cool-down periods in between measurements.Reference Körner, Reiche, Ghunaim, Fuge, Hampel, Büchner and Mühl7
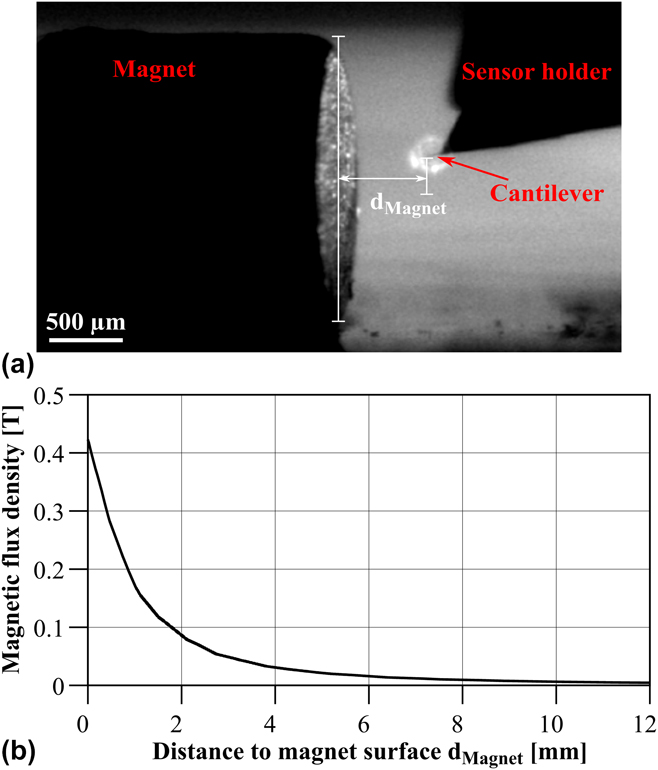
An approach which circumvents this problem is the use of two NdFeB magnets as described in Ref. Reference Körner, Reiche, Büchner, Gerlach and Mühl26. They were fixed on the sample plate of the magnetic force microscopy (MFM) in a way that the orientation of the magnetic field in contact with the sensor could be changed by simply rotating the sample stage. By moving the sample stage with respect to the sensor, the magnetic field strength could be varied. This set-up allowed to change the magnetic field without ever moving the sensor, thereby mitigating any influence of changed laser intensity or position on the cantilever on the measured frequency shift signal. The sensor was furthermore positioned in the middle of the magnet to avoid magnetic field inhomogeneities on the magnet’s edge [see Fig. 3(a)].
(a) Camera side view of magnet and sensor inside the MFM. (b) Magnetic flux density over distance from magnet calculated with the software FEMM.
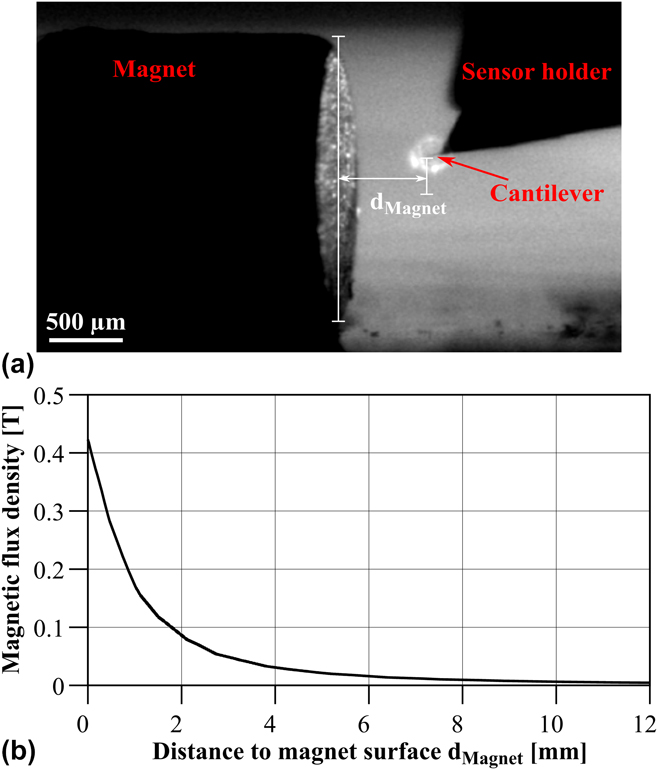
The MFM allows to move the sample stage in μm-steps and via a camera (top and side view) the position of the magnet with respect to the microcantilever could be observed [see exemplary image in Fig. 3(a)]. Since the nanocantilever is not visible due to the limited resolution of the camera, this set-up allowed to determine the position of the sensor inside the magnetic field with an uncertainty of approximately the length of the nanotube (≈11 μm).
The magnetic field of the two NdFeB magnets was determined by simulating them with finite element software FEMM39 based on the properties from the data sheet. Details thereof have been published in Ref. Reference Körner, Reiche, Büchner, Gerlach and Mühl26 and therefore, only the curve for the resulting magnetic flux density is presented here [see Fig. 3(b)]. Based on the position uncertainty discussed above, the uncertainty for the magnetic field amounts to approximately ±20 mT.
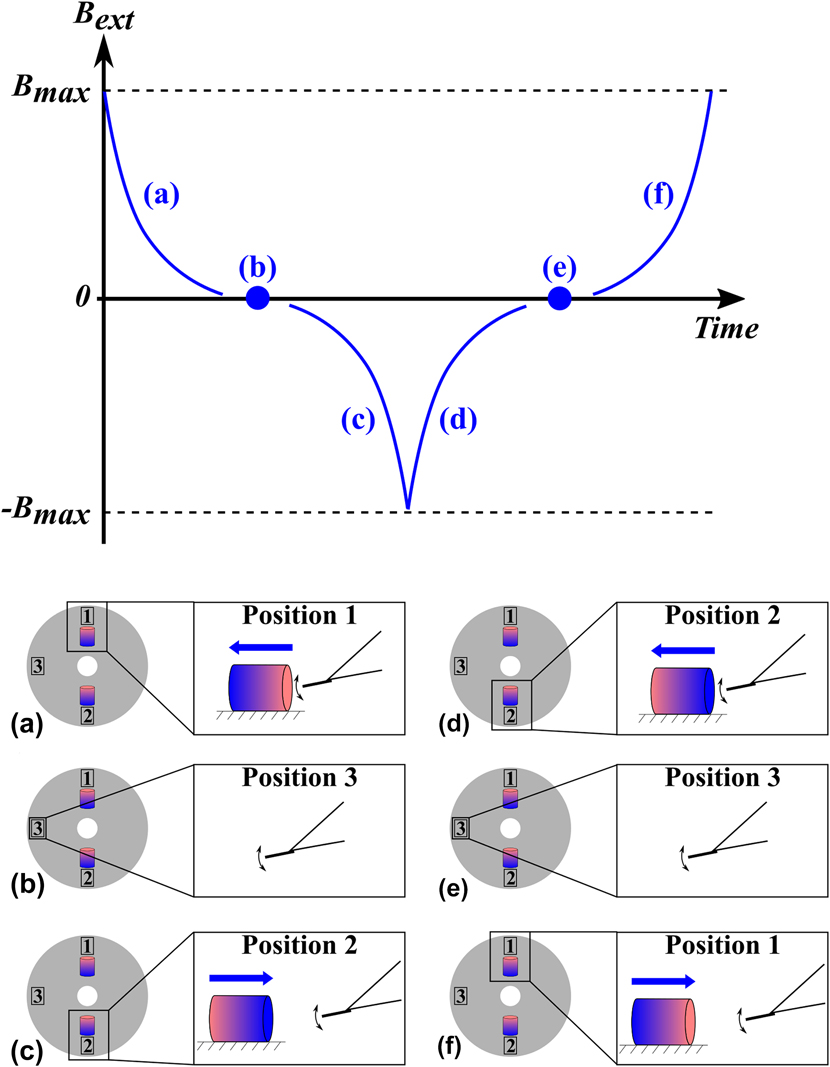
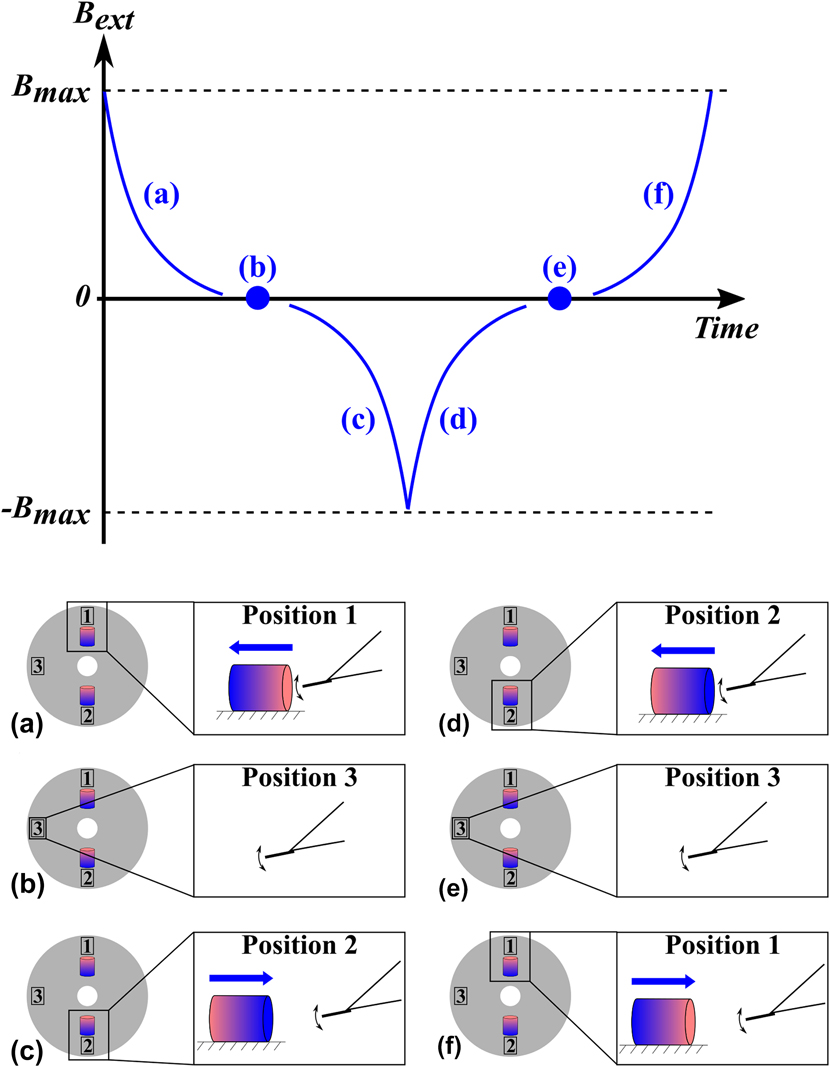
The measurement steps taken during the experiment are depicted in Fig. 4. This protocol ensured varying magnetic field strengths as well as magnetic field orientations throughout the measurement. Please note that it is not necessary to know the exact orientation of the magnets (i.e., where north and south pole are), instead it is sufficient to ensure that the orientations are opposite.
Qualitative illustration of magnetic field evolution during measurement. The images (a) to (f) indicate the magnet positions and movement with respect to the fixed sensor during a measurement cycle. (a) Starting point with magnet closest to the sensor and then gradually moving away. (b) Field free position in between the magnets (stage rotated by 90°). (c) Approach of magnet with reversed polarity until magnet is closest to sensor. (d) Retracting of magnet. (e) Field free position in between the magnets. (f) Approach of magnet with same polarity as in the beginning until magnet is closest to sensor.
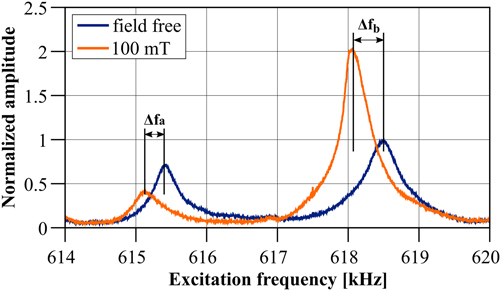
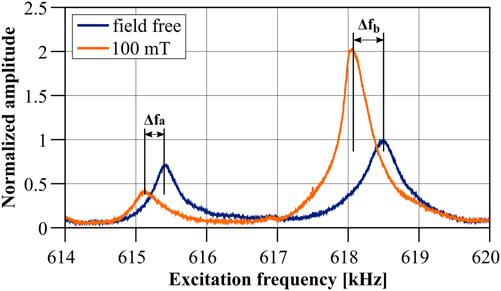
Usually, the frequency shift of either one of the two resonance peaks of the coupled system would be tracked at the microcantilever by a phase-locked loop, resulting in a continuous curve for the frequency shift with respect to the external magnetic field. However, for the given set-up this was not possible as the sample stage with the magnets had to be moved to change the magnetic field and this movement introduced too much noise, causing the phase-locked loop to reach its safety boundary conditions and stop tracking the signal. To circumvent this problem, first the stage was moved and then an amplitude response curve was measured after each step, leading to discrete values for magnetic field and correspondingly frequency shift. Two exemplary amplitude response curves for the field free case and in an external field of approximately 100 mT are depicted in Fig. 5.
Amplitude response curve of the co-resonantly coupled system obtained at the microcantilever for a field free position and in a magnetic field of ≈100 mT. The frequency shifts for left (f a) and right (f b) resonance peak are indicated.
C. Derivation of magnetic sample properties
In this section, the derivation of magnetic properties from the frequency shift data will be discussed for the case of a magnetic sample which is distributed over the whole length of the nanocantilever. This is not the most common magnetometry experiment, since the magnetic sample is usually localized only at the end of the cantilever. However, the iron nanowire is an instructive example of how such elongated samples can be treated in cantilever magnetometry (not limited to the co-resonant approach) and may therefore provide additional insights for the study of likewise samples.
An application of the co-resonant concept for the characterization of magnetic nanoparticles localized at the end of the nanocantilever as in conventional cantilever magnetometry is discussed in detail in Ref. Reference Körner, Reiche, Ghunaim, Fuge, Hampel, Büchner and Mühl7.
Due to the discrete nature of the measurement as described above, an additional data evaluation step was necessary. This entailed the extraction of the frequency shifts for both resonance peaks of the coupled system from the measured amplitude response curves for varying distance between magnet and sensor. Therefore, the quadratic amplitudes of each resonance peak were fitted by a Lorentzian peak function. Next, the two amplitude maxima for each amplitude response curve and the corresponding frequencies were determined by a maximum search function. That procedure introduced a slight uncertainty due to the noise in the amplitude response curve (see Fig. 5) and the slight asymmetry of the resonance peaks (due to the co-resonant couplingReference Reiche, Körner, Büchner and Mühl25), which is represented by the error bars in the measured frequency shift data.
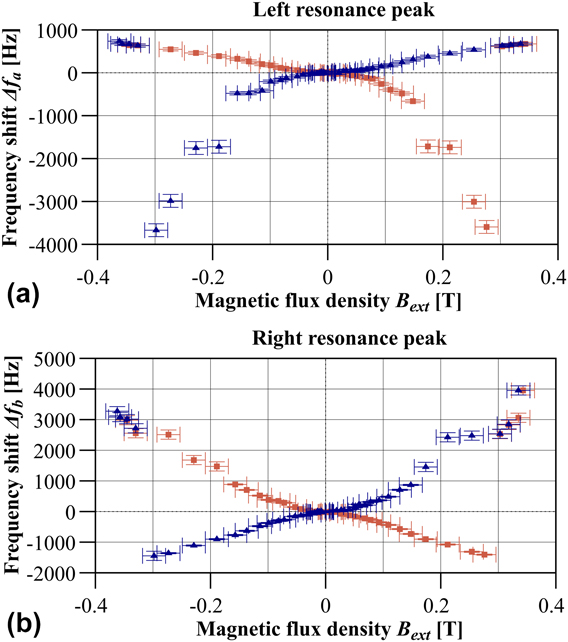
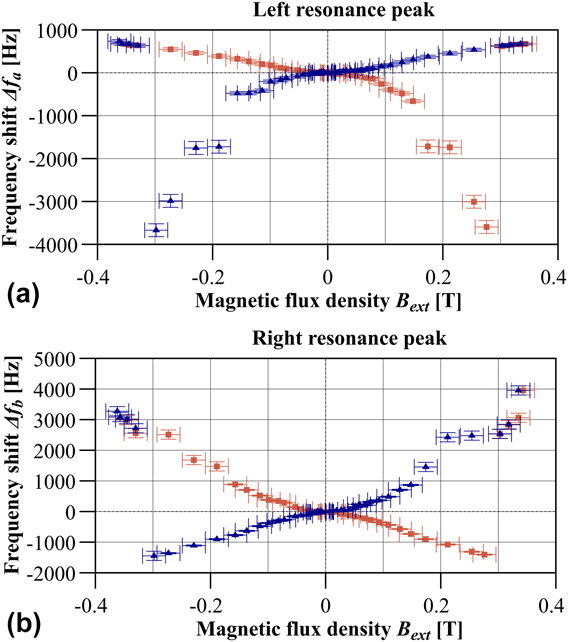
The distance between magnet and sensor was related to the magnetic field by the simulated field curve shown in Fig. 3. Figure 6 depicts the frequency shift signal in relation to the field free case for both resonance peaks a and b with respect to the magnetic field. These are typical hysteresis curves which have been reported previously for an iron nanowire sample.Reference Banerjee, Wolny, Pelekhov, Herman, Fong, Weissker, Mühl, Obukhov, Leonhardt, Büchner and Hammel17
Frequency shift values in dependence of the external magnetic field B ext for (a) left and (b) right resonance peak as indicated in Fig. 5.
D. Magnetic switching field
Within these hysteresis curves, jumps at certain magnetic field values can be identified. These jumps occurred reproducibly when the experiment was repeated at different times and days. It is therefore unlikely that these are random effects or artifacts.
In accordance with other magnetometry experiments, such jumps can be associated with magnetization reversal of the single-domain magnetic nanowire.Reference Banerjee, Wolny, Pelekhov, Herman, Fong, Weissker, Mühl, Obukhov, Leonhardt, Büchner and Hammel17 According to the Stoner–Wohlfarth model, the magnetization of a prolate spheroid is aligned along the particle’s easy axis depending on the anisotropy energy.Reference Stoner and Wohlfarth40 If an external magnetic field in the reversed direction is applied, the magnetization first starts to cant away from the easy axis. At a certain magnetic field strength, it is energetically more favorable if the magnetization reverses which is an almost instantaneous process that results in the characteristic jumps in the frequency shift signal. Various reversal process types are possible but for the iron-nanowire it has already been shown that magnetization reversal is due to magnetization curling.Reference Lipert, Bahr, Wolny, Atkinson, Weissker, Mühl, Schmidt, Büchner and Klingeler27,Reference Stoner and Wohlfarth40
Based on that it is possible to directly derive the magnetic switching field B s from the measured frequency shift data. It is found to be (314 ± 16) mT for negative magnetic field values and (290 ± 14) mT for positive magnetic field values for both resonance peaks a and b of the coupled system. The mean value for the magnetic switching field therefore is B s = (302 ± 12) mT.
This value agrees very well with other experiments for these type of iron-filled carbon nanotubesReference Banerjee, Wolny, Pelekhov, Herman, Fong, Weissker, Mühl, Obukhov, Leonhardt, Büchner and Hammel17,Reference Lipert, Bahr, Wolny, Atkinson, Weissker, Mühl, Schmidt, Büchner and Klingeler27,Reference Lutz, Weissker, Wolny, Müller, Löffler, Mühl, Leonhardt, Büchner and Klingeler41 as well as a theoretical calculation of the magnetic switching field based on the curling model,Reference Lipert, Bahr, Wolny, Atkinson, Weissker, Mühl, Schmidt, Büchner and Klingeler27 which gives B s,curl = (330 ± 166) mT. The high uncertainty in that case mainly originates from the measurement uncertainty of the iron-nanowire’s diameter in the SEM.
By comparison of both hysteresis curves it can clearly be observed that the shape of the curves is slightly different. This can be explained by the effective parameters for both resonance peaks which are not exactly equal (see Table I) and, consequently, the reaction of each resonance peak to an external interaction will differ.
Furthermore, this difference in effective properties will also affect the oscillation amplitude of the nanocantilever. Experimentally, the amplitude of the microcantilever is measured, hence the amplitude of the nanocantilever can only be estimated based on the degree of eigenfrequency matching and the resulting amplitude amplification.Reference Reiche, Körner, Büchner and Mühl25,Reference Körner, Reiche, Büchner, Mühl and Gerlach34 As reflected in the effective properties, the effective spring constant of resonance peak b is smaller than that of peak a, allowing to conclude that peak b is more strongly influenced by the properties of the nanocantilever. Therefore, it is a possibility that the nanocantilever’s amplitude for resonance frequency f b was high enough to border the non-linear oscillation regime.
Additionally, although the oscillation direction of the nanocantilever with respect to the microcantilever was observed inside the SEM in top and side view of the sensor, we cannot completely exclude the possibility that the nanocantilever’s plane of oscillation did not exactly coincide with that of the microcantilever, which has also been observed in other experiments with co-resonant sensors.Reference Körner, Reiche, Ghunaim, Fuge, Hampel, Büchner and Mühl7
The study of these effects and their implications for measurements will be part of further investigations. However, here it is concluded that although the curve shapes are slightly different, they exhibit the same features in terms of magnetization reversal and also in the low magnetic field range which is of interest in the following discussion.
E. Magnetic moment
In cantilever magnetometry, the frequency shift signal can be related to the magnetic moment m and anisotropy field H a of the magnetic sample.Reference Banerjee, Wolny, Pelekhov, Herman, Fong, Weissker, Mühl, Obukhov, Leonhardt, Büchner and Hammel17,Reference Stipe, Mamin, Stowe, Kenny and Rugar42 By assuming that the external magnetic field H ext is very small compared to the anisotropy field, a simplified expression can be derived (the complete derivation of expressions 2 and 3 can be found in Refs. Reference Gysin, Rast, Aste, Speliotis, Werle and Meyer6 and Reference Weber43):
 $${{\Delta {\omega _{{\rm{a,b}}}}} \over {{\omega _{{\rm{a,b}}}}}} = {{{\mu _0}{H_{{\rm{ext}}}}} \over {2k_{{\rm{eff}}}^{{\rm{a,b}}}L_{\rm{e}}^2}} \cdot m \cdot {{{H_{\rm{a}}}} \over {{H_{{\rm{ext}}}} \pm {H_{\rm{a}}}}}\quad ,$$
 $${{\Delta {\omega _{{\rm{a,b}}}}} \over {{\omega _{{\rm{a,b}}}}}} \approx {{{\mu _0}{H_{{\rm{ext}}}}} \over {2k_{{\rm{eff}}}^{{\rm{a,b}}}L_{\rm{e}}^2}} \cdot m\;{\rm{for}}\;{H_{{\rm{ext}}}} \ll {H_{\rm{a}}}\quad ,$$
Here, the effective spring constant  $k_{{\rm{eff}}}^{{\rm{a,b}}}$, resonance frequency ωa,b and shift thereof for each resonance peak a and b of the coupled system have to be used. The parameter L e constitutes an effective cantilever length L e ≈ L cant/1.377.Reference Sidles, Garbini, Bruland, Rugar, Züger, Hoen and Yannoni44 For the coupled system, L cant ≈ L nano can be assumed based on the oscillation envelope observed in the SEM.
Equation (3) is only valid under the assumption that the magnetic sample is a concentrated magnetic element localized at the free end of the nanocantilever. In contrast to that, the single-domain iron-nanowire constitutes an elongated magnetic dipole along the whole nanocantilever. Consequently, it experiences varying magnetic field strengths as well as different effective sensor parameters along its length.
To resolve that, a simplified effective magnetic monopole approach for small magnetic fields will be used as has been described in a previous publication on that data evaluation.Reference Körner, Reiche, Büchner, Gerlach and Mühl26 According to that, the iron-nanowire can be described by two effective magnetic monopole moments q located at each end of the iron-nanowire and mainly the one at the free end of the nanocantilever contributes to the frequency shift signal (see also in Ref. Reference Körner45). The validity of approximating the iron-nanowire magnetic dipole by two magnetic monopole moments has previously been studied in detail and is described in Refs. Reference Wolny, Mühl, Weissker, Lipert, Schumann, Leonhardt and Büchner28 and Reference Wolny, Obukhov, Mühl, Weissker, Philippi, Leonhardt, Banerjee, Reed, Xiang, Adur, Lee, Hauser, Yang, Pelekhov, Büchner and Hammel29. The reasoning for this approximation is that the FeCNT constitutes a rather long (few micrometers) single magnetic domain structure.
Consequently, Eq. (3) can be rewritten so that it contains the magnetic monopole moment q:
 $${{\Delta {\omega _{{\rm{a,b}}}}} \over {{\omega _{{\rm{a,b}}}}}} = {{\zeta {B_{{\rm{ext}}}}} \over {2k_{{\rm{eff}}}^{{\rm{a,b}}}}} \cdot q\quad ,$$
with B ext = μ0H ext. The parameter ζ describes the curvature of the oscillation trajectory of the effective magnetic monopole moment positioned at the free end of the nanocantilever and can be found by fitting the trajectory from the oscillation envelope obtained from SEM images.Reference Philippi, Weissker, Mühl, Leonhardt and Büchner30 For the given sensor ζ = (0.0105 ± 0.0041) μm−1 was found.
Equation (4) has been used to fit the measured frequency shift data in the small magnetic field range, i.e., B ext < 100 mT, for both branches (positive and negative slope) in each hysteresis curve. Calculation of the mean value results in an effective magnetic monopole moment of q = (1.7 ± 0.4) × 10−9 A m. With the relation m = q × L nanoReference Chikazumi46 and a nanocantilever length of L nano = (10.3 ± 0.3) μm, the magnetic moment of the iron-nanowire is given as m Fe = (1.7 ± 0.5) × 10−14 A m2 = (2 ± 0.5) × 109 μBohr. μBohr is the value of one Bohr magneton.
These values also agree very well with results obtained in other experiments with the same type of iron-nanowires.Reference Banerjee, Wolny, Pelekhov, Herman, Fong, Weissker, Mühl, Obukhov, Leonhardt, Büchner and Hammel17,Reference Philippi, Weissker, Mühl, Leonhardt and Büchner30 Furthermore, the effective magnetic monopole derived through fitting of measured frequency shift data can be compared to the geometric magnetic monopole moment. This can be calculated based on the diameter of the iron-nanowire d Fe and the saturation magnetization of α-iron M s ≈ 1.71 × 10⁶ A/mReference Reiche, Vock, Neu, Schultz, Büchner and Mühl47:
 $${q_{{\rm{geo}}}} = {\pi \over 4}d_{{\rm{Fe}}}^2{M_{\rm{s}}}\quad ,$$
resulting in q geo = (7.7 ± 4) × 10−10 A m and a magnetic moment of m geo = (8 ± 4) × 10−15 A m2 = (9 ± 5) × 108 μBohr. The rather large uncertainty of the geometric magnetic monopole moment mainly arises from the determination of the iron-nanowire's diameter by SEM.Reference Körner, Reiche, Büchner, Gerlach and Mühl26 Despite that, it can be concluded that the geometric magnetic monopole moment and the values obtained from the frequency shift agree within the margins of uncertainty.
Magnetic switching field and magnetic moment are the relevant magnetic properties describing the iron-nanowire. In principle, it would furthermore be possible to obtain the magnetic anisotropy field H a based on Eq. (2). However, since H a ≈ 1.1 T for the iron-nanowire,Reference Lipert, Bahr, Wolny, Atkinson, Weissker, Mühl, Schmidt, Büchner and Klingeler27 this would not have been possible in the presented experiment due to limitations of the magnetic field strength given by the used NdFeB magnets. Furthermore, in the high-field regime the monopole approach is not valid anymore and a treatment of all contributions of the magnetic dipole to the frequency shift signal would be necessary.
F. Comparison to literature data
To demonstrate the potential and reliability of the co-resonant measurement principle, the obtained data for magnetic properties is compared to experiments in other publications where the same types of iron-filled carbon nanotubes have been studied. Table II lists the relevant data and, in case of cantilever magnetometry experiments, the strength of the frequency shift signal.
Results obtained with a co-resonantly coupled magnetometry sensor in comparison to other published data. Δf denotes the strength of the measured frequency shift signal, B s magnetic switching field, m magnetic moment and μB the Bohr magneton.

Lutz et al. and Lipert et al. used MFMReference Lutz, Weissker, Wolny, Müller, Löffler, Mühl, Leonhardt, Büchner and Klingeler41 and micro-Hall magnetometryReference Lipert, Bahr, Wolny, Atkinson, Weissker, Mühl, Schmidt, Büchner and Klingeler27 to determine the magnetic switching fields of ensembles and individual iron-filled carbon nanotubes, respectively. Banerjee et al. and Philippi et al. used conventional cantilever magnetometry experiments, i.e., only one cantilever and, hence, no co-resonant coupling, to determine the magnetic properties of individual iron-filled carbon nanotubes at lowReference Banerjee, Wolny, Pelekhov, Herman, Fong, Weissker, Mühl, Obukhov, Leonhardt, Büchner and Hammel17 and at room temperature.Reference Philippi, Weissker, Mühl, Leonhardt and Büchner30 Except for Lutz et al., the studied iron-filled carbon nanotubes were prepared in the same way as the ones used in the experiment presented here and are therefore expected to exhibit similar magnetic properties.
Table II shows that the values for magnetic switching field and magnetic moment agree very well, but the strength of the frequency shift signal significantly differs for the cantilever magnetometry experiments.
Banerjee et al. present an experiment that is very similar to ours. They used a conventional cantilever magnetometry set-up where the FeCNT was placed as the sample at the end of the microcantilever in a way that the long axes of both beams coincided. However, the nanotube end only protruded approximately 1 μm over the free end of the microcantilever, hence there was no possibility of any nanotube oscillation. The experiment was carried out at low temperatures (T < 40 K) and with a very soft microcantilever (k = 0.157 N/m) and the frequency shift signal was in the order of a few mHz.Reference Banerjee, Wolny, Pelekhov, Herman, Fong, Weissker, Mühl, Obukhov, Leonhardt, Büchner and Hammel17 Consequently, this clearly demonstrates the potential of the co-resonant approach where a frequency shift signal of several kHz was obtained at room temperature and with a rather stiff microcantilever (k ≈ 100 N/m).
Philippi et al. carried out a conventional cantilever magnetometry experiment inside a SEM at room temperature and with the iron-filled carbon nanotube acting as cantilever. They observed frequency shifts in the order of several kHz in dependence of an external magnetic field introduced by a NdFeB microsphere. This is a similar signal strength as found with the co-resonant approach. However, oscillation detection was rather difficult as it was solely based on the observation of the nanotube oscillation envelope in the SEM.Reference Philippi, Weissker, Mühl, Leonhardt and Büchner30
These comparisons demonstrate the immense potential of the co-resonant measurement principle to enhance the sensitivity of dynamic-mode cantilever sensors with laser-based oscillation detection. This is immediately evident for the signal strength of the frequency shift. Additionally, as the amplitude response curve in Fig. 5 indicates, the co-resonant case also features a good signal-to-noise ratio (SNR) and, therefore, detectability. However, no quantitative information is available from the other experiments for comparison of that sensor aspect.
So far, first proof-of-principle experiments have been carried out with rather stiff microcantilevers and at room temperature. By employing softer microcantilevers and low temperatures, in principle sensitivities of few Bohr magnetons may become accessible with this approach for cantilever magnetometry.
G. Cantilever magnetometry and beyond
In other cantilever magnetometry experiments the iron-filled carbon nanotube was substituted with an unfilled CNT as nanocantilever and the magnetic sample was placed at the free end of the nanocantilever. In one case, the sample was another CNT filled with few individual Co2FeGa Heusler nanoparticles. There we were, to our knowledge for the first time, able to observe magnetic switching of individual Heusler nanoparticles (diameter ≈ 35 nm) and derive their magnetic properties at room temperature and with conventional laser-deflection detection at the microcantilever.Reference Körner, Reiche, Ghunaim, Fuge, Hampel, Büchner and Mühl7 This, once more, demonstrated the immense potential of the co-resonant approach for the study of novel nanomaterials.
Furthermore, a significant increase in sensitivity was also found by employing the co-resonant concept in MFM.Reference Reiche, Körner, Büchner and Mühl32 Thereby, a different sensor geometry was used where an iron-filled carbon nanotube was placed perpendicular to the microcantilever at the nodal point of the microcantilever’s second flexural mode. Consequently, the eigenfrequency of the second flexural mode of the microcantilever was matched to the FeCNT’s first flexural mode. This sensor was used on a well-known cobalt-platinum multilayer sample in a MFM set-up to study the magnetic domain structure of the sample and compare data for a co-resonantly enhanced to a non-enhanced coupled sensor.Reference Reiche, Vock, Neu, Schultz, Büchner and Mühl47 Thereby, similar to cantilever magnetometry, an increase of the frequency shift signal by several orders of magnitude was found.Reference Reiche, Körner, Büchner and Mühl32
IV. CONCLUSIONS
This review aims at providing an overview of a novel co-resonant cantilever sensor concept and its potential for application in materials research for the case of cantilever magnetometry. Based on the exemplary study of an iron-filled carbon nanotube acting simultaneously as nanocantilever and magnetic sample due to the enclosed iron-nanowire, it was outlined how magnetic properties can reliably be obtained from measured frequency shift data. By comparison to other studies of the same FeCNTs the derived magnetic properties could be validated and it furthermore allowed to demonstrate the significant increase in signal strength (several orders of magnitude) due to the co-resonant coupling.
The experiments described here give a first impression of the potential of the co-resonant approach in the investigation of novel nanomaterials. The presented concept allows to strongly increase the sensitivity of a dynamic-mode cantilever sensor with regard to the strength of the frequency shift signal by using very soft nanocantilevers. At the same time, oscillation detection still takes place at the microcantilever which ensures good detectability and SNR of the sensor by the standard laser-based methods. Furthermore, the concept itself is of general nature and applications are not limited to the study of magnetic samples or to materials research. Instead, the co-resonant concept may be applied to most cases where dynamic-mode cantilever sensors are used, e.g., as highly sensitive mass or gas sensors. First calculations in these directions indicate a likewise increase in sensitivity as in cantilever magnetometry.
ACKNOWLEDGMENTS
The author acknowledges Christopher F. Reiche and Thomas Mühl for support of experimental work and inspiring discussions, Uhland Weissker for preparation of FeCNT samples and Thomas Gemming and Sigfried Menzel for supporting the FIB preparation work. Furthermore, funding of this work by the DFG (Grant Nos. MU 1794/3-1 and KO 5508/1-1) is gratefully acknowledged.