


Introduction
A description of ice flow leading to a deep core hole is necessary in order that the core stratigraphy can be correctly interpreted in terms of depositionl site and shear history. Also, for cores that cannot be dated using core properties, ice-flow models must be used to obtain a depth-age relationship. Here, a model is described for the ice flow leading to the Byrd Station ice core. It uses data collected along the flow line and calculates a time scale for the core.
The model is based on measured quantities (surface velocity, net surface accumulation-rate, and bore-hole tilting results). Flow behavior at depth and away from the bore hole is obtained using theories on ice flow to correct the parameters. This method has the advantage that the flow pattern of the upper portion of the ice sheet is described with respect to the known and measured pattern at the surface. Any errors in the assumptions or simplifications involved in calculating behavior away from the surface, therefore, affect mainly the results for the oldest and deepest ice.
The next two sections describe how strain-rates at depth are inferred from measured values at the top surface and a measured profile of horizontal velocity. Later sections explain the calculations and how the problem of the present-day non-zero mass balance is treated.
Strain-Rates at Depth
The flow of a thick ice sheet is dominantly in the direction of the slope of the upper surface. The ice responds to this surface elevation gradient by shearing internally, and perhaps by sliding along the bottom. The direction of shear due to the surface slope is the same at each depth, and so the down-glacier movement of ice must be in the same direction at each depth. Exceptions to this rule can occur where other deviator stresses are relatively important, such as near ice divides, where the surface slope is very small, and near the bottom where ice-flow perturbations can be caused by bottom irregularities. Elsewhere this constraint that the velocity vectors of a vertical column all lie in a vertical plane, and a knowledge of the rate of horizontal shear, help determine the vertical strain-rate at each depth.
Support for the concept that most ice flow follows the mean surface slope, is afforded by continuity calculations. Balance velocities, which are calculated using surface net accumulation-rate data, vary along the Byrd Station strain network (BSSN) with the same pattern as the measured surface velocity (Reference WhillansWhillans, 1977). If there were an important change in flow-line direction with depth, due perhaps to deep ice flowing to one side of a subglacial hill while surface ice passes over with less deflection, then there would be an important discrepancy between changes in balance velocity and in surface velocity. Except perhaps for minor variations very close to the bottom, the motion of every part of a vertical column of ice is in a common geographic direction.
Mathematically, this constraint, that the two horizontal velocity components change in the same way with depth, is expressed by:

where u and v are velocity components parallel to the top surface in the x and y directions, respectively, and the subscript Footnote * denotes top-surface values. The shape factor ψ describes the velocity profile through the ice thickness and is equal to zero at the top surface, and increases with depth, attaining the maximum permissible value of unity in the case of no bottom sliding.
The vertical strain-rate at depth can now be calculated. Let w represent the vertical velocity. Ice incompressibility is expressed by:

and the vertical strain-rate is

Substituting from Equations (1) :

in which έzz* is the vertical strain-rate at the top surface. έzz* is readily calculated from measured horizontal strain-rates along the surface. The next section shows that the last two terms on the right may be neglected along the BSSN.
Internal Shear Along the Byrd Station Strain Network
The amount of internal shear between any depth and the top surface is given by

This internal shear is dependent on shear stress, ice temperature, and other factors, including most importantly the degree to which the ice crystals may be preferentially aligned (ice fabric). The surface slope, when averaged over horizontal distances of about ten ice thicknesses, is nearly constant (Reference WhillansWhillians, 1975, fig. 1), and so, the shear stress responsible for the internal shear at any specified depth is nearly constant. Also the temperature profile changes little along the first 200 km of flow lines in large ice sheets (Reference Budd, Budd, Jenssen and RadokBudd and others, 1971). On the other hand, the ice fabric probably develops progressively from the ice crest to Byrd Station, where it is well-developed (Reference Gow and WilliamsonGow and Williamson, 1976). Thus, the geographic variation (with x and y) of the rate of internal shear along the BSSN is expected to vary mainly because of ice-fabric development.
Map views showing the location of the Byrd Station strain network (rectangle on the main map and short, straight line on inset map). The arrows represent ice velocity vectors and the curved line shows the probable actual ice flow line leading to the core hole at 162 km. That flow line is obtained by moving velocity vectors in the y-direction from the strain network until they describe a continuous flow line. The ice divide is at 0 km.

The measured surface velocities provide a measure of the importance of ice fabric. Although surface slope, ice thickness, and the temperature profile change little along the BSSN, the surface velocity shows a steady increase (Fig. 1). This increase is attributed to the development of ice fabric and we can use the surface velocity as an empirical indication of the ice-fabric effect.
It is assumed, therefore, that the fabric effect on internal shear is proportional to the surface velocity, u* .Footnote *
Other formulations describing the effect of ice fabric could be devised. Another approach could be to suppose that the fabric effect is a linear function of distance from the ice divide. That formulation is, for our purposes, equivalent to that used here, because the surface velocity itself increases almost linearly from the ice divide (Fig. 1). We use the fabric-velocity formulation because that is more convenient in Equations (3) and when allowing for non-steady-state behavior.
Thus the geographic variation in internal shear (u * — u *), (v * — v) is taken to be proportional to the surface velocity u *, v *, and so by Equations (3) the shape factor ψ is not a function of geographic position. The variation with depth of internal shear is described by the shape factor ψ, and the geographic variation by the measured surface velocity, u *.
The vertical strain-rate (Equations (2)) is now expressed very simply by:
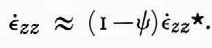
Equivalent formulations have been used by Philberth and Federer (Reference Philberth and Federer1971, equation (8)) and by Budd and Radok (Reference Budd and Radok1971, equation (4.19)).
The shape factor could, in principle, be obtained by integrating the “flow law” for ice. The “flow law” for polycrystalline ice is, however, poorly established for the low deviatoric stresses and pronounced fabric that exist through most of the ice sheet near Byrd Station.
The shape factor is obtained empirically from the core-hole tilting results of Garfield and Ueda (Reference Garfield and Ueda1975, Reference Garfield and Ueda1976). The tilting results stop at a depth of 1482 m where the core hole became blocked, and it is necessary to extrapolate the results to the bottom (Fig. 2). Reference Budd and RadokIn Whillans (1977) a linear interpolation to no motion at the bottom was made in order conservatively to allow for as much internal shear as possible. Here, a more probable extrapolation is made.
Ice velocity profile for the Byrd Station core hole calculated using the surface velocity (Reference Budd and RadokWhillans, 1977) and relative ice velocities from Reference Garfield and UedaGarfield and Ueda (1975). The broken line is the fitted curve used in the model calculations.

The tilting results are shown in Figure 2, together with the simple curve that has been fitted to them. That curve is described by (ψ = 8 x 10⁻⁸ z2 for z in meters). The sensitivity of the results to this fit is not critical and is discussed later.
Calculations
Computations are performed numerically along particle paths in the ice. The x-axis is defined to lie along the BSSN, which nearly follows the ice flow. Time t is related to horizontal position by:

Let λ represent the thickness of a layer deposited at the top surface in a unit of time. This layer is thinned due to the vertical strain-rate according to the relation :

Let λ0 represent the value of λ when it was deposited, at time t 0 which is the time of the beginning of the particle path. The value of λ at any subsequent time t is then

The integration can be taken over x by substituting from Equations (5):

where x 0 is the position of origin of the particle path.
By including the relationships obtained earlier for έxx and u (Equations (1) and (4)), the relationship is obtained.

It is interesting to note that the right-hand side of Equations (6) contains no depth-varying quantities and the layer thicknesses do not depend on the velocity profile. This is because, in order to traverse a certain distance step △ x , the longer time required for ice at depth compared with ice near the top is exactly compensated by the nearer-to-zero value of έ zz at depth.
The calculations of λ are made in 3 km steps in the x-direction using measured surface values of strain-rate. The computation is made for 50 particle paths that are initially separated by 3 km along the flow line. The initial thickness λ0 is obtained from the measured surface net accumulation-rate. For the first distance step of each particle path, a special strain calculation is made so that λ 0 is the mean layer thickness for the distance step.
The age T of ice at any time t or position x along the particle path is:

This calculation is made for particle paths originating at points half-way between the origins of the particle paths selected for the calculation of λ (Equations (6)).
The depth z of ice of a specific age T is the sum of the thickness of layers of more recent age at a specific x-position:

Since λ is a function of age T, this is accurately computed by summing multiples of annual layer thicknesses and age differences.
Figure 3 shows the results of a calculation for the Byrd Station flow line. The position of the glacier bed has been measured by radio echo-sounding (Reference RobinRobin, 1975; Reference WhillansWhillans, 1976), but these data are not used in the calculations. The ice flow has been adjusted for non-steady-state, as described in the next section, so that the calculated ice thickness at the core hole agrees with that directly measured. The deepest particle path (a dashed line in Figure 3) shows the calculated position of the bed along the BSSN; the flow model is supported by the good agreement between calculated and radar-determined bed forms.
Model results plotted against flow distance (lower scale) and time (upper scale). The positions of particle paths (dashed lines) are plotted with respect to the present-day surface elevation of the ice sheet. The surface of the stippling represents a running mean, over 12 km, of the position of the bed as determined by radar sounding (Reference RobinRobin, 1975). The deepest particle path is also the calculated bed position: its shape is similar to that obtained by radar but calculated thicknesses are greater, indicating that the ice sheet was thicker in the past.

The Byrd Station Flow Line
The sections above describe the principles used in the flow-line calculations. For the flow line leading to Byrd Station, there are three special considerations that must be included in the model. The first and most important consideration is that the mass balance of the ice sheet is different from zero, and the ice sheet is thinning slowly. The model takes account of this imbalance. Secondly, the data follow a straight line that is different from the true, curving flow line. This, as is shown below, does not present a significant problem. Finally, the data collected at the surface do not include the final 2 km before the core hole at Byrd Station, and extrapolated surface data must be used in this interval.
The present-day net snow accumulation does not quite compensate the ice export by flow, and the ice sheet is thinning slowly (Reference Budd and RadokWhillans, 1977). Thus, if present-day surface net accumulation-rates and surface strain-rates are used together with an assumption of steady-state, the ice thickness is calculated to be less than that measured. The model of Figure 3 accounts for the imbalance by incorporating the response of the ice sheet to changing surface temperature.
There was a global climatic warming approximately 10000 years ago that has persisted to the present time. The warmer Holocene temperatures are penetrating to the deeper portions of the ice sheet with the flow of the ice and by conduction. This warming during the past approximately 10000 years has caused an acceleration in ice flow that satisfactorily explains the measured imbalance (Reference WhillansWhillans, 1978).
The ice sheet is therefore modeled as flowing more slowly (nearer-to-zero values for strain-rates and velocities) until the start of the warming. As the warmth penetrates downward, the rate of internal shear and the shape factor change. Calculations are made following Reference WhillansWhillans (1978) except that changes in shear strain-rate are computed more accurately by downward integration. The computer program calculates an array of shape factors (Fig. 4), backward through time, starting with the curve fitted through the present-day velocity profile at Byrd Station. The flow calculation is then made, forward in time, using the appropriate shape factors. According to our model, surface velocities and surface strain-rates are related to the total amount of internal shear through the ice-sheet thickness. Ancient values are, therefore, obtained from modern values using the calculated total change in shape factor for the ice thickness.
Shape factor ψ today (from Fig.2) and before the start of warming, plotted against depth. Also marked on the horizontal scale is the ratio of velocity at depth to that at the surface.

The calculation of the change in ice flow due to the warming requires a knowledge of the magnitude and timing of the warming and of the activation energy for ice in creep. Uncertainties in the magnitude of warming and in the activation energy affect the model in the same way, so for convenience, we select a value of 70 kJ mol−1 for the activation energy and consider the values of the magnitude and timing of the warming as free parameters that must be determined.
The timing of the warming is first set at the often-quoted value of 10000 years ago, and the magnitude of the surface temperature change selected so that the calculated ice thickness at Byrd Station agrees with that measured by direct drilling. The required surface temperature change is 14 deg (a rather large value).
This first model provides a depth-age relationship for the ice core. The large change in oxygen isotopic ratio (Reference Johnsen, sheets, Johnsen, Dansgaard, Clausen and LangwayJohnsen and others, 1972) at a depth of 1200 m, is calculated to have occurred 14000 years ago. This change is probably closely associated with a climatic change that included an air-temperature change, and 14000 years ago is a better estimate for the time of surface-temperature change than the value of 10000 years used above.
The model in Figure 3 uses this result and sets the beginning of warming at 14000 years ago. The magnitude of temperature change required to explain the present ice thickness is 8 deg for an activation energy of 70 kJ mol−1. This is considered to be the best model for the ice flow, and the magnitude of warming is in reasonable agreement with the estimates of Reference RaynaudRaynaud ([1977]) and of Reference RobinRobin (1977). It is to be noted that the calculated timing of the change in oxygen isotopic ratio is not very sensitive to the time selected for the start of ice-sheet warming.
The second special consideration for the ice flow leading to Byrd Station is that the BSSN does not exactly follow the ice flow line. Figure 1 shows that there are small directional deviations of ice flow along the BSSN, and an important deviation just before Byrd Station (which is at 162 km). The flow line that passes through Byrd Station is about 10 km northwest of the BSSN and is probably nearly parallel to it.
The site of Byrd Station was selected to be suitable for studies in many scientific disciplines and to have simple geographic coordinates (lat. 80° S., long. 120° W.), and the ice thickness profile along the true flow line is very similar to that along the BSSN (Reference RaynaudWhillans, 1977, fig. 5). There is no reason to suppose that Byrd Station was built on an unrepresentative flow line for the region. We may assume, therefore, that calculations along the actual core-hole flow line would give very similar results to those obtained here.
Oxygen isotopic ratio (δ 18 O) of the ice from Reference Johnsen, sheets, Johnsen, Dansgaard, Clausen and Langwayjohnsen and others (1972) plotted against age according to the present model (left) and depth (right).

The model calculations are ideally made along the curving flow line, but the BSSN data are arranged in a straight line. The effects of calculating along a somewhat longer, curving flow line are, however, compensated by the larger full velocities that must be used. Identical results are obtained by calculating along a curved path as along a straight route if the appropriate components of velocity and strain rates are used.
The third problem is that the BSSN ends 2 km short of the core hole site. There are no reliable strain-rate data linking the core-hole site to the end of the strain network. Fortunately, the ice is only 30 m (1.5%) thicker at the end of the BSSN than at Byrd Station, and it is assumed that the ice flow continues in the same fashion to the core-hole site as along the BSSN. Synthetic data are used to continue the model to the core-hole site.
Model Reliability
The sensitivity of the calculated time scale to the assumptions that the model makes is tested by running the model using modified assumptions. In order to compare models, we select the calculated age of ice at 1200 m depth, which is the depth of an important change in oxygen isotopic ratio of the ice, and which, by the “best” model, is 14000 years old (Fig. 5).
The horizontal velocity profile used in the “best” model varies as the ice depth to the second power because that provides a good fit to the measured tilting of the Byrd Station core hole. Perhaps it could be argued that a third-power relationship, say, is more appropriate for most of the BSSN. The use of such a velocity profile, with the constant determined by fitting the profile through the tilting result at 1482 m, makes the vertical strain-rate more nearly constant for the upper portion of the ice sheet and the required climatic warming larger. The ice at 1200 m depth is calculated to be 13500 years old. This is not significantly different from that of the “best” model, and the shape of the horizontal velocity profile is not critical to the conclusions of this work.
The same test is relevant to the assumption about the effect of ice-fabric development. The model assumes that the increase in surface velocity along the BSSN is almost entirely due to the development of an ice fabric that favors shearing and it uses the measured surface velocity to describe the ice-fabric effect. Perhaps it could be argued that the fabric develops in a more complex fashion, and that the shape factor varies as the third power of depth for part of the flow line and as the second power for the other part. That would produce results intermediate between those of the “best” model and those of the model described above. These results would be very similar to those of the “best” model, and the description of ice-fabric development is not critical to the calculated age of ice to a depth of 1200 m.
It is supposed that most of the ice flow is by internal shearing and not by bottom sliding. At Byrd Station the extrapolation of the tilting results suggests that the sliding speed is about 8 m a−1. Sliding speeds are probably much smaller up-glacier: ice thicknesses are greater up-glacier, and the surface slope and hence the shear stress at any depth are much the same, so that there should be a greater proportional contribution of internal shear to the total surface speed, and less bottom sliding. It seems unlikely that bottom sliding is a major contributor to the velocity of the ice sheet along most of the BSSN.
The present-day imbalance of the ice sheet at Byrd Station is adequately described by the effect of the Holocene warming. It is well-established that air temperatures did change approximately 14000 years ago, so other effects, due perhaps to sea-level or accumulation-rate changes, must be considered as additional to the Holocene warming effect.
The change in sea-level some 10000 years ago must have affected the margin of the ice sheet and the position where the ice sheet begins to float. The ice sheet must adjust to this change and the disturbance would propagate inland. It seems, however that the disturbance has not yet reached Byrd Station or else that the effect has been small, smaller than the Holocene warming effect. The observed thinning along the BSSN is uniform and the warming effect is a sufficient explanation for the imbalance. There seems to be no good evidence for a sea-level effect at Byrd Station.
It is possible that the surface net accumulation-rate also changed about 14000 years ago. Reference RobinRobin (1977) suggests that accumulation-rates near Byrd Station may now be about 50% larger than during Wisconsinan time. That effect, alone, would cause present-day thickening of the ice sheet, and any such thickening effect must be offset by an even greater warming effect. Using such a model, the warming needed to explain the present ice thickness at Byrd Station is 20 deg, and the calculated age of ice at 1200 m depth is 12500 years. This is not a good model because such changes are too large to be considered perturbations, as is done here. This calculation does, however, demonstrate that the interpretation of the “best” depth-age scale is not very sensitive to possible moderate changes in ice-sheet regime.
Considerable confidence is placed on the depth-age scale for the upper portion of the ice sheet, but there are uncertainties associated with the age of deep ice. Deeper ice has been influenced by climatic and ice-sheet changes during the Wisconsinan that are not included in the flow model. Moreover, the calculated age of deeper ice is more sensitive to the simplifications and assumptions about the shape factor than are the calculated ages of ice at shallower depths. For these reasons an age scale is not presented in Figure 5 for ice deeper than 1800 m.
Perhaps the ice flow is more complex than is supposed here. There seems to be no good evidence, however, for more complexity, and the present model describes a simple flow regime that is consistent with the available data and our understanding of ice-flow dynamics. The results, of course, depend on the correctness of this supposition of simple flow.
Other Flow-Line Calculations for the Byrd Station Area
Other workers have modelled the ice flow leading to Byrd Station. Reference Budd, Budd, Jenssen and RadokBudd and others (1971) and Reference Johnsen, sheets, Johnsen, Dansgaard, Clausen and LangwayJohnsen and others (1972) assumed steady-state and chose, on the basis of maps then available, a flow line that originates 320 km distant from the origin of the true flow line. Johnsen and others considered the resulting time scale for the Byrd Station core unacceptable and adjusted the values used for the surface net accumulation-rate and the flow-line spreading so that the Byrd Station oxygen isotopic-ratio profile matched, in broad aspects, the Camp Century, Greenland, profile. Reference Gow, Gow, Epstein and SharpGow and others (1973) used a value for the net accumulation-rate that is about 20% smaller than values up-glacier from Byrd Station, and, apparently, assumed uniform ice thickness and steady-state. The accuracies of these early models are limited mainly by errors in the data that were used and to a lesser extent by the simplifications and assumptions in the models.
Discussion and Conclusions
The model of ice flow developed here adequately describes the flow of ice near Byrd Station. The success of the model is demonstrated by the agreements between the calculated form of the bed and that measured by radar sounding, and between the measured ice-sheet mass balance and that calculated as due to the Holocene warming effect.
There are two regions where the agreement of calculated and measured bed forms disagree (Fig. 3). Near the ice divide (0 km to 20 km) there is a major discrepancy. In that area, ice flow is very slow and small deviations at depth are very large in proportion to the surface velocity. Equations (1) may not be valid in this area. The second major discrepancy is near 150 km, where the calculated ice thickness is too large. This is an area where there may be subglacial lakes, and the basal drag may be much smaller than elsewhere. Our assumption that the horizontal velocity profile has the same shape all along the BSSN may not be valid at this site. If the model were to attribute a more important role to basal sliding near 150 km, vertical strain-rates would be more compressive and the calculated ice thickness less at that site. Elsewhere, along the BSSN, the model successfully reproduces the large hollow in bed form between 30 km and 80 km, and the shallowing at 155 km.
The model should not be expected to describe minor features in the bottom. The strain-rate field used is that measured at the surface, corrected for depth, and surface values are little affected by small-scale features at the bottom.
The calculated ice thickness is greater than that measured by radar. This is because the calculated thicknesses are for times in the past. The model computes simultaneously along the glacier and with the passage of time. The scale for time is marked on the upper axis of Figure 3, and the bed position is plotted with respect to the present-day surface elevation. The ice sheet must have been about 200 m thicker before the beginning of thinning. This is a small thickness change that is consistent with the change in total gas content along the Byrd Station core (Reference RaynaudRaynaud, [1977]).
The time scale for the Byrd Station ice core shows that the oxygen isotopic ratio began to increase in West Antarctica about 5000 years sooner than at Camp Century, in north Greenland (Reference Budd and RadokHammer and others, 1978). Both records show values near to those of the present day being attained at about 10000 years ago. The difference in the times of the start of the change may be because the oxygen isotopic ratio of the precipitation in north Greenland did not change until major changes in ice cover had occurred and sea-surface evaporation began in Baffin Bay. Also, the Camp Century record may have been influenced by a large change in the elevation of the ice sheet surface that affected the oxygen isotopic ratio profile (Reference RaynaudRaynaud, [1977]). The change in West Antarctica may reflect a more immediate change in the extent of sea ice or of general south-polar circulation, and may show some influence of local volcanism (Reference Budd and RadokGow and Williamson, 1971; Reference Thompson, Thompson, Hamilton and BullThompson and others, 1975).
The model and the resulting interpretation could be subjected to a much more thorough test if the Byrd Station ice core were independently dated. As it is, the present flow model provides the best dating of that core. It is hoped that future deep coring will be conducted at the down-glacier end of a strain network like the BSSN, and that that core will be precisely datable using core properties. Such work could produce very valuable results, not only on the secular variation in depositional properties, but also on ice flow.
Acknowledgements
I thank J. F. Bolzan, R. E. Ewing, and D. Raynaud for helpful criticism, and the Scott Polar Research Institute for the radar sounding work. This work was supported by National Science Foundation grant number DPP76-82032A01 awarded to Ohio State University, Institute of Polar Studies.
Discussion
G. De Q. Robin: Does your preferred model assume no rate of change of accumulation between present day and Wisconsin?
I. M. Whillans: Yes, my preferred model uses present-day net accumulation-rates. I think that this is the most appropriate model to use because we do not have any good indication of accumulation-rates in the past. Very likely, accumulation-rates were different during the Wisconsin and my time scale during that time is therefore uncertain.
R. H. Thomas: It is important to distinguish between thinning of the ice summit due to warming and that due to dynamic effects following shrinkage of the ice sheet at the edges which we would expect in response to rising sea-level. Are your results sufficiently sensitive to do this?
Whillans: I do not know how the effects of sea-level changes would be propagated back into the ice sheet. I suppose, however, that the disturbance would travel up the direction of ice flow. The ice sheet near Byrd Station is thinning slowly and uniformly in a manner adequately explained by the known warming. I see no effect of a disturbance passing or having passed through the length of the strain network.
Thomas: Is it possible that the shape of the isochrons and agreement between predicted and measured bed topography indicate that present-day strain-rates are responding to bedrock topography and not that your model is correct ?
Whillans: I have not used the isochrons as a test for this model. The agreement between predicted and measured bed topography supports my contentions that (1) the surface strain-rates are affected by the bottom topography (as you say) and (2) my model for deep strain-rates is, at least, approximately valid, and (3) the entire ice thickness is involved in the flow.
W. F. Budd: What did you use for your basal boundary condition for temperature calculations, i.e. was it melting and did you take conduction into the bed into account?
Whillans: It does not matter which model I use, because, even for the case with conduction into the bed, the temperature change at the bottom is very small.
Budd: Cannot the difference in surface and balance velocity be explained simply by the difference in the surface and average column velocities? E.g. on Law Dome the average was 65% of the surface, with about 100 m of stagnant ice in 400 m at the base.
Whillans: In this and in my recent paper (Reference RaynaudWhillans, 1977) I allowed for slower velocities at depth, but I have not supposed that there is stagnant ice at Byrd Station. Byrd Station is on a hill in the substrate and that seems a rather unlikely place for stagnant ice. The present analysis and the fact that the balance velocity and surface velocity vary together suggest that the entire ice thickness is involved in the movement.
R. M. Koerner: The only work I have done in the Byrd Station area indicates thickening in the area (Reference Koerner, Mellor and WashingtonKoerner, 1964). What evidence are you using for thinning?
Whillans: I found that ice outflow exceeds the replenishment by new snowfall (Reference Budd and RadokWhillans, 1977).
G. H. Holdsworth: The isotope curve for the Byrd bore hole shows a temperature increase from 18000 to 10000 B.P. In your model you evidently took a step function temperature change at 14000 B.P. What is the effect of this in terms of the ice flow? That is, what sort of error would be introduced by this simplification?
Whillans: The simplification introduces no important errors. I would obtain the same result from a more gradual temperature change because temperature transients diffuse quickly in the ice sheet.
D. J. Drewry: You suggest a thinning of the ice sheet in the Holocene by about 200 m. The CLIMAP reconstruction suggests substantially greater surface reduction (about 1500+ m) (Reference Denton, Denton, Hughes, Fastook, Schilling and LingleDenton and others, 1979). Can you reconcile these two conclusions?
Whillans: Such a large elevation drop is consistent neither with the model that I have just presented nor with my earlier work with internal radio-reflecting layers (Reference Garfield and UedaWhillans, 1976).
T. J. Hughes: The CLIMAP ice-sheet reconstruction for Antarctica 18000 years ago has an elevation only 200 m or 300 m higher than present for the West Antarctic ice divide.
Whillans: I believe that you have about 1000 m more ice at Byrd Station and, perhaps, 500 m more ice at the divide.



