1 Introduction
Supervised machine learning has dramatically expanded researchers’ abilities to measure and classify important concepts from political texts (e.g., Laver, Benoit, and Garry Reference Laver, Benoit and Garry2003; Greene, Park, and Colaresi Reference Greene, Park and Colaresi2019; Mitts Reference Mitts2019). Recent methodological innovations have likewise served to further tailor these methods to the needs of political scientists (e.g., Cantú and Saiegh Reference Cantú and Saiegh2011; D’Orazio et al. Reference D’Orazio, Landis, Palmer and Schrodt2014; Chang and Masterson Reference Chang and Masterson2020; Miller, Linder, and Mebane Reference Miller, Linder and Mebane2020). Despite these advancements, political scientists continue to primarily apply supervised machine learning to political texts in an independent manner for each target variable considered. Doing so treats each target variable as an unrelated quantity of interest during supervised classification. This standard, independent classification approach is consistent with the supervised machine learning frameworks discussed in past political science reviews of automated text analysis (Grimmer and Stewart Reference Grimmer and Stewart2013; Barberá et al. Reference Barberá, Boydstun, Linn, McMahon and Nagler2020).
However, political scientists also commonly endeavor to code multiple separate target variables from a single corpus of text, often with a future intention of using said measures as explanatory and/or outcome variables. For instance, Mitts (Reference Mitts2019) uses a supervised approach to independently classify 175,015 tweets across four nonmutually-exclusive labels: (1) sympathy for ISIS, (2) life in ISIS territories, travel to Syria, or foreign fighters, (3) the Syrian War, or (4) anti-West rhetoric, and then analyzes each as a distinct dependent variable in four separate statistical models. Likewise, Kostyuk and Zhukov (Reference Kostyuk and Zhukov2019) use supervised classification to separately code political event attributes pertaining to event type, initiator/target, tactics, and casualties from 72,010 news reports and blog posts. These attributes are then leveraged to create a measure of Ukrainian kinetic operations, whose effects on a (separately coded) cyber-warfare variable are considered via vector autoregression. Appendix B in the Supplementary Material offers 10 similar published examples.
In these contexts, substantial gains in classification accuracy—and, thus, also in variable measurement and any subsequent regression-based inferences—can be obtained by treating one’s target variables as interdependent, and leveraging each variable’s supervised predictions as features during the supervised classification of all other variables. We introduce one such supervised machine learning framework here: multi-label prediction.
Multi-label prediction offers substantial benefits over even the most flexible of independent classification alternatives, in that the former uniquely leverages pertinent auxiliary information that is already freely available—via the additional label-to-feature relations across one’s remaining labels—during classification. In doing so, multi-label prediction avoids the significant training costs associated with searching over a potentially infinite set of combinations and/or transformations of one’s original document features to arrive at this same on-hand information for classification. To illustrate these points below, we first formally present the multi-label framework, review a number of pertinent caveats and extensions, and introduce metrics to judge multi-label classification performance. Our main contribution is to introduce these items alongside guidance for applied text-as-data research. However, we also find that—as in other domains (Madjarov et al. Reference Madjarov, Kocev, Gjorgjevikj and Džeroski2012)—a(n ensemble) classifier chain multi-label approach has the best predictive performance over the largest number of relevant metrics and across a variety of types of text-as-data. We then verify that the predictions from this ensemble classifier chain multi-label approach also provide preferable (outcome and/or explanatory) variable measures for postclassification regression analyses, when compared to independent classification.
To arrive at these findings, we first illustrate our proposed multi-label approach’s broader benefits through an application to the coding of access to information (ATI) request texts—a form of “big data” from citizen-government interactions with which political science research has engaged (e.g., Chen, Pan, and Xu Reference Chen, Pan and Xu2016; Berliner, Bagozzi, and Palmer-Rubin Reference Berliner, Bagozzi and Palmer-Rubin2018; Berliner et al. Reference Berliner, Bagozzi, Palmer-Rubin and Erlich2021). Our second application then evaluates multi-target prediction within the context of the growing literature on the automated coding of human rights abuses from country-year human rights reports (Greene, Park, and Colaresi Reference Greene, Park and Colaresi2019; Murdie, Davis, and Park Reference Murdie, Davis and Park2020; Park, Greene, and Colaresi Reference Park, Greene and Colaresi2020a). In both applications, and an accompanying Monte Carlo simulation, multi-label prediction outperforms several alternative, independent supervised classification approaches—even in circumstances of low correlation among target variables. Our applications and simulations further demonstrate that multi-label prediction performs much better than independent classification in instances where (i) correlations among target variables are high and/or (ii) the number of available features or labeled cases for classification is relatively low.
2 Multi-label Framework
This section begins by reviewing a set of key components to single variable classification, before generalizing this to instances where researchers seek to classify multiple variables (i.e., multi-label contexts). For supervised machine codings of text-as-data, we can define the main objective of classification algorithms as separating the classes of a variable using only human-coded training data. Ideally in such contexts, a model learns the underlying structure of a variable using said training data, and this structure then generalizes well to unseen (i.e., out-of-sample) data. If the target variable has only two possible values—for example, if the goal is to predict if a person will vote or not—we refer to this task hereafter as “binary classification.” On the other hand, if there are more than two possible classes for a single target variable, we term this variable as “nominal” and characterize this task as “multi-class classification.” The latter would include, for example, efforts to classify candidate vote choice in a multi-party system with more than two parties.
More formally, let
 $\mathcal {X}$
denote the input space and
 $\mathcal {Y}$
the output space (target). The goal is to learn a function
 $ f~:~ \mathcal {X} \xrightarrow {}\mathcal {Y}$
that maps an instance from the input space to the output space. This function is learned from the training set
 $\{x_i,y_i~ |~ 1 \leq i \leq m \}$
, where
 $x_i \in \mathcal {X}$
represents the features of an instance that will be mapped to a corresponding class (or label)
 $y_i \in \mathcal {Y}$
representing its characteristics. One fundamental assumption adopted by traditional classification algorithms is that each class is mutually exclusive. These are valid assumptions for the individual binary and categorical vote choice variables mentioned above.
However, as noted in the introduction, there are many learning tasks for which these simplifying assumption might not be reasonable. These situations commonly arise in researchers’ efforts to code multiple, nonmutually-exclusive traits—which we define as labelsFootnote 1 —from corpora of political texts, as the examples from Mitts (Reference Mitts2019) and Kostyuk and Zhukov (Reference Kostyuk and Zhukov2019) illustrate above. Alternatively, for the aforementioned vote choice examples, a similar situation would arise in cases where a researcher is interested in predicting how a voter will vote across six distinct ballot initiatives during a given election. As a third example, we note that more recent innovations in semantic role labeling can often require classification of an even larger (but more incomplete) number of overlapping labels per text-unit than the examples described thus far. In any of the above cases, a set of labels must ideally be assigned to each observation in order to express its nonexclusive characteristics in a manner that accounts for the mapping of multiple labels to a single observation (e.g., an individual voter). This assignment paradigm is referred to hereafter as “multi-label learning,” whereby the goal of one’s classification task becomes learning a function that can predict the proper label sets for unseen examples (Zhang and Zhou Reference Zhang and Zhou2013).
For multi-label problems, political scientists continue to use independent label prediction—as illustrated by the examples highlighted in Section 1 and the Supplementary Material. We refer to this standard approach as “binary relevance” (BR) hereafter. BR effectively decomposes multi-label problems into multiple independent binary label prediction tasks. In breaking one’s classification tasks into a set of wholly independent, binary classification tasks, BR directly invokes the simplifying assumptions mentioned above. However, because any and all relationships between labels are accordingly ignored, BR will often achieve suboptimal performance in instances where this simplifying assumption does not hold. This is a substantial limitation, given that (as elaborated upon below) the effective exploitation of label correlations (i) is essential for accurate multi-label classification and (ii) is the main way to cope with the challenge of large output spaces that multi-label problems typically entail (Zhang and Zhang Reference Zhang and Zhang2010).
As such, multi-label learning tasks require a distinct classification strategy from that which is used for the assignment of a single label (per observation) within the BR or multi-class classification paradigms defined above. Ignoring these multi-label attributes and classifying all labels independently likely yields worse classification performance, and hence poorer measurement, of said variables. Depending on how researchers use these classified variables in subsequent statistical models, measurement shortcomings from independent classification could lead to biased and/or unreliable inferences. Indeed, to the extent that the latter classification approach leads to higher measurement error in one’s post-classification independent (dependent) variable(s), inconsistency (inefficiency) in one’s regression estimates—and a higher corresponding risk of bias and incorrect inferences when said measurement error arises in either one’s independent or variable(s)—can arise (Wansbeek and Meijer Reference Wansbeek and Meijer2000; deHaan, Lawrence, and Litjens Reference deHaan, Lawrence and Litjens2019).
Multi-label learning algorithms were developed to address these types of concerns in the context of news story and web-page categorization (McCallum Reference McCallum1999; Ueda and Saito Reference Ueda, Saito, Becker, Thrun and Obermayer2002). In both usage cases, texts are classified into multiple nonmutually-exclusive categories. After being successfully applied to problems involving text, multi-label algorithms have been widely used on diverse other tasks, such as automatic annotation of images and videos (Boutell et al. Reference Boutell, Luo, Shen and Brown2004; Qi et al. Reference Qi, Hua, Rui, Tang, Mei and Zhang2007), bioinformatics (Clare and King Reference Clare and King2001), and web mining (Tang, Rajan, and Narayanan Reference Tang, Rajan and Narayanan2009).
2.1 Formal Definition
We now turn to formally define multi-label classification. For reference, we provide a summary of the mathematical notation used within this section in Appendix Table C.1 of the Supplementary Material. The multi-label paradigm can be more formally defined as follows: let
 $\mathcal {X} \in \mathbb {R}^d$
be a d-dimensional input space and the label space with q possible classes be
 $\mathcal {Y} = \{0,1\}^q$
. Similar to the standard classification task defined above, the goal is to learn a mapping function—in this case, defined as
 $ h~:~ \mathcal {X} \xrightarrow {}\mathcal {Y}$
—from the training set
 $\mathcal {D} = \{x_i,Y_i~ |~ 1 \leq i \leq m \}$
. For each instance
 $(x_i,Y_i)$
, the input
 $x_i = (x_{i1},...,x_{id})$
is a d-dimensional vector and the output is
 $Y_i$
is a q-dimensional set of labels. Therefore, for each new unseen example of
 $x \in \mathcal {X}$
, the multi-label classifier
 $h(\cdot )$
predicts a set of labels
 $h(x) \subseteq \mathcal {Y}$
.
For supervised text-as-data classification problems, the output of a multi-label model can thereby be seen as a real-valued function
 $ f~:~ \mathcal {X}~\text {x}~\mathcal {Y} \xrightarrow {} \mathbb {R}$
, where
 $f(x,y)$
can be interpreted as a compatibility or confidence function that evaluates how compatible or likely
 $y \in \mathcal {Y}$
is the correct label of x. The classifier function
 $h(\cdot )$
can be obtained by taking the output with largest compatibility score
 $h(x) = \underset {y \in \mathcal {Y}}{arg~max} f(x,y)$
or by using a thresholding function
 $ t~:~ \mathcal {X}~ \xrightarrow {} \mathbb {R}$
such that
 $h(x) = \{y | f(x,y) \geq t(x),y \in \mathcal {Y}\}$
.
Based on the formal definition presented above, it is evident that traditional supervised classification problems can be viewed as a simplified version of multi-label learning, where each target has only one (binary or nominal) label. The generality of multi-label classification makes this task much more difficult to solve, given that each directional inter-label relationship must be accounted for as a predictive feature in a manner that accounts for permutations. That is, in order to accommodate inter-label relationships, one ideally needs to not only apply a classifier once to each label (as is presently done within political science), but rather to classify each label once for every possible ordering (i.e., subset) of all remaining labels—since these remaining labels, and the order by which they themselves are classified, now have bearing on each label’s subsequent prediction. In this regard, the key challenge of multi-label classification is thus the output space, which grows exponentially as the number of labels increase. For example, a problem with 5 binary labels has 32 different label subsets. If we increase this number to 15 binary labels, the number of possible combinations grows to 32,768.
To address these shortcomings, researchers have identified several ways to efficiently leverage the relations among labels within multi-label classification tasks. Two longstanding strategies include accounting for (i) pairwise correlations between any two labels (Ueda and Saito Reference Ueda, Saito, Becker, Thrun and Obermayer2002; Qi et al. Reference Qi, Hua, Rui, Tang, Mei and Zhang2007) or (ii) rankings between relevant and irrelevant labels (Elisseeff and Weston Reference Elisseeff and Weston2002; Brinker, Fürnkranz, and Hüllermeier Reference Brinker, Fürnkranz and Hüllermeier2006). In comparison to BR, these alternative approaches better manage the trade-off between performance and computational cost within multi-label classification tasks.
However, these approaches encounter problems when the relationships among labels become more complex than simple pairwise associations—which is oftentimes the case for real-world social science data. This is especially the case for many efforts to code quantities of interest from political texts. For example, with regards to the country-year human rights application presented below, CIRI’s separate, nonmutually-exclusive human-rights labels for state torture, political imprisonment, extrajudicial killings, and disappearances (Cingranelli and Richards Reference Cingranelli and Richards2010) are likely to be highly interdependent facets of states’ overarching strategies of repression, as opposed to simply being linked via pairwise associations. In such cases, multi-label alternatives that accommodate the influences of all labels when predicting each label (Yan, Tesic, and Smith Reference Yan, Tesic and Smith2007; Ji et al. Reference Ji, Tang, Yu and Ye2008; Cheng and Hüllermeier Reference Cheng and Hüllermeier2009), can achieve superior performance, albeit at the expense of higher computational costs and more constrained scalability.
2.2 Categorization of Multi-Label Learning Algorithms
Methods for multi-label classification can be divided into two general categories: problem transformation methods and algorithm adaptation methods. The former tackles the multi-label classification problem by reformulating this classification problem into other tasks, such as binary classification (Read et al. Reference Read, Pfahringer, Holmes and Frank2009) or multi-class classification (Tsoumakas and Vlahavas Reference Tsoumakas and Vlahavas2007). On the other hand, algorithm adaptation methods tackle the multi-label problem by adapting learning algorithms to directly deal with multi-labeled data (Zhang and Zhou Reference Zhang and Zhou2007), oftentimes in manners that better account for the label associations in one’s data. We first discuss algorithm adaptation below, before returning to problem transformation, and then a broader summary of all approaches.
2.2.1 Algorithm Adaptation
By tailoring existing algorithms to multi-label contexts, algorithm adaptation methods possess an inherent appeal in that they (i) often employ algorithms that are already familiar to researchers from single label contexts and (ii) most closely match the underlying data generating process (d.g.p) of one’s multi-label data. Yet, such methods typically must sacrifice at least some ability to explicitly, and flexibly, accommodate inter-label correlations to achieve these aims. In multi-label contexts, this often leaves algorithm adaptation methods open to the same critiques that were previously highlighted for BR.
A canonical algorithm adaption method is the multi-label k-nearest neighbor (ML-kNN) algorithm (Zhang and Zhou Reference Zhang and Zhou2007). As the name suggests, this algorithm adaptation model is itself built upon the more widely known kNN algorithm (Dudani Reference Dudani1976). In all (ML-)kNN approaches—and for each datapoint in a test set—the model identifies its kNNs in the training set. Whereas standard kNN then assigns a label for a single trait to that datapoint based upon the most common label shared by that datapoint’s kNNs, ML-kNN instead considers the set of trait labels for each datapoint based upon a membership counting vector of its kNNs’ corresponding label-sets. Using the statistical information gained from these neighbors’ label sets, all labels are then assigned to that datapoint via Bayesian inference.
Under this Bayesian framework, prior and posterior probabilities can then be directly estimated from a human-labeled text-as-data training set based on frequency counting.Footnote 2 The process of estimating prior probabilities for each label can also help to mitigate problems commonly faced by text-as-data researchers such as class-imbalance. This algorithm has been used in several real-world multi-label learning problems—in each case outperforming other multi-label learning algorithms that were considered at the time (Zhang and Zhou Reference Zhang and Zhou2007).
However, one of ML-kNN’s main limitations is that it does not explicitly consider the correlation between labels. As such, ML-kNN discards relevant information, and and accordingly risks assigning labels with suboptimal accuracy rates that are no better than the BR approach outlined above. Several extensions have been proposed to address this potential deficiency. Examples include extensions that (i) incorporate all of the components of the counting vector
 $C_j$
in the (non)assignment of label j (Younes et al. Reference Younes, Abdallah, Denoeux and Snoussi2011) or (ii) consider the labels of neighboring instances as “features” of a logistic regression whose output is the label to be estimated (Cheng and Hüllermeier Reference Cheng and Hüllermeier2009). Nevertheless, the applicability of this algorithm adaptation framework in a manner that fully accommodates correlations between labels remains limited. This leads us to tentatively favor problem transformation methods, to which we now turn.
2.2.2 Problem Transformation
Rather than tailoring a multi-label algorithm to an existing multi-label data structure, problem transformation methods first “break up” one’s multiple labels—including nominal labels—into a simpler set of (often binary) labels. The latter methods then leverage these restructured data in a manner that more explicitly accounts for inter-label correlations. As such, problem transformation methods sacrifice information on the underlying d.g.p, and original structure, of one’s multi-label data so as to better accommodate label correlations during classification—and the added computation that this often entails.
One of the most well-known and accessible problem transformation algorithms is the classifier chain (CC; Read et al. Reference Read, Pfahringer, Holmes and Frank2009). In a similar manner to strategies of multiple imputation by chained equations, the primary goal of the CC model is to transform the multi-label problem into a chain of binary classifiers, where the prediction of subsequent classifiers is based on the prediction of preceding elements of the chain. See Appendix C.1 in the Supplementary Material for a more formal treatment.
The CC method does well at balancing predictive power and computational efficiency. Accordingly, it has now been successfully applied to domains as varied as music, scene, yeast, genbase, and medical classifications (Madjarov et al. Reference Madjarov, Kocev, Gjorgjevikj and Džeroski2012). It is important to highlight, however, that the the ordering of the labels considered affects the CC algorithm’s performance, so it is often necessary to run the model with several random permutations over the label space with and without replacement. To address this, we propose CC extensions that utilize ensemble methods within our applications further below, which we label as “ensemble CC” (ECC) hereafter. This proposed innovation draws upon earlier CC extensions that have previously sought to optimize label ordering via genetic algorithms (Goncalves, Plastino, and Freitas Reference Goncalves, Plastino, Freitas, Calders, Esposito, Hüllermeier and Meo2013) or Monte Carlo methods (Read, Martino, and Luengo Reference Read, Martino and Luengo2014).
The multi-label problem can also be modeled as an ensemble of multi-class classifiers, where each component in the ensemble targets a random subset of the label space
 $\mathcal {Y}$
upon which a multi-class classifier is induced by what is known as the label powerset (LP; Boutell et al. Reference Boutell, Luo, Shen and Brown2004).Footnote
3
This LP algorithm has been successfully applied to image classification, where it achieved commensurate performance (Boutell et al. Reference Boutell, Luo, Shen and Brown2004). However, it is important to note that LP has two major limitations. First, the prediction of new labels is limited by label sets that appear in the training set. That is, the model is not able to generalize to unseen combinations of labels. Second, the label space grows exponentially (
 $2^q$
), so when
 $\mathcal {Y}$
is large, training becomes complex and computationally expensive.
To overcome these two drawbacks, the LP algorithm can be extended under a random k-labelsets (RAkEL) framework (Tsoumakas and Vlahavas Reference Tsoumakas and Vlahavas2007). This extension’s main innovation lies in its use of N different LP classifiers on k different random subsets of one’s label space to guarantee computational efficiency. The approach then ensembles these N LP classifiers for a final prediction. The degree of label correlations is accordingly controlled for by k. For unseen examples, each of the N different classifiers predict their corresponding labels. The final output is determined by the ensemble of all N classifiers.
As an illustration, imagine a four-label classification task,
 $y = [L_1,L_2,L_3,L_4],$
with two training examples
 $y_1 = [0,0,1,1]$
and
 $y_2 = [1,0,0,0]$
. With LP, the output of the model would be restricted to predicting either
 $[0,0,1,1]$
or
 $[1,0,0,0]$
as these are examples already seen during training. On the other hand, RAkEL allows the model to generalize to combinations of labels that are not present in the training set. For instance, for a RAkEL classifier with
 $k=2$
that divides the label space in
 $k_1 = [L_1 L_2]$
and
 $k_2 = [L_3 L_4]$
, a classifier
 $N_1$
is trained on the subset
 $k_1 = [0,0],[1,0]$
and another classifier
 $N_2$
is trained on the subset
 $k_2 = [1,1],[0,0]$
. The final output is assembled for all combinations seen by N classifiers. In this case, the model is able to predict [0,0,1,1],[1,0,0,0],[0,0,0,0], and [1,0,1,1], wherein the last two examples were not present in the training set.
RAkEL has achieved good performance in multi-label domains involving document, image, and protein classification (Tawiah and Sheng Reference Tawiah and Sheng2013). There are two types of RAkEL models: one considers only disjoint (nonoverlapping) subsets (
 $\hbox{RAkEL}_d$
) and a second that considers overlapping intervals (
 $\hbox{RAkEL}_o$
). In our applications, we consider
 $\hbox{RAkEL}_d$
.
2.3 Summary of Approaches
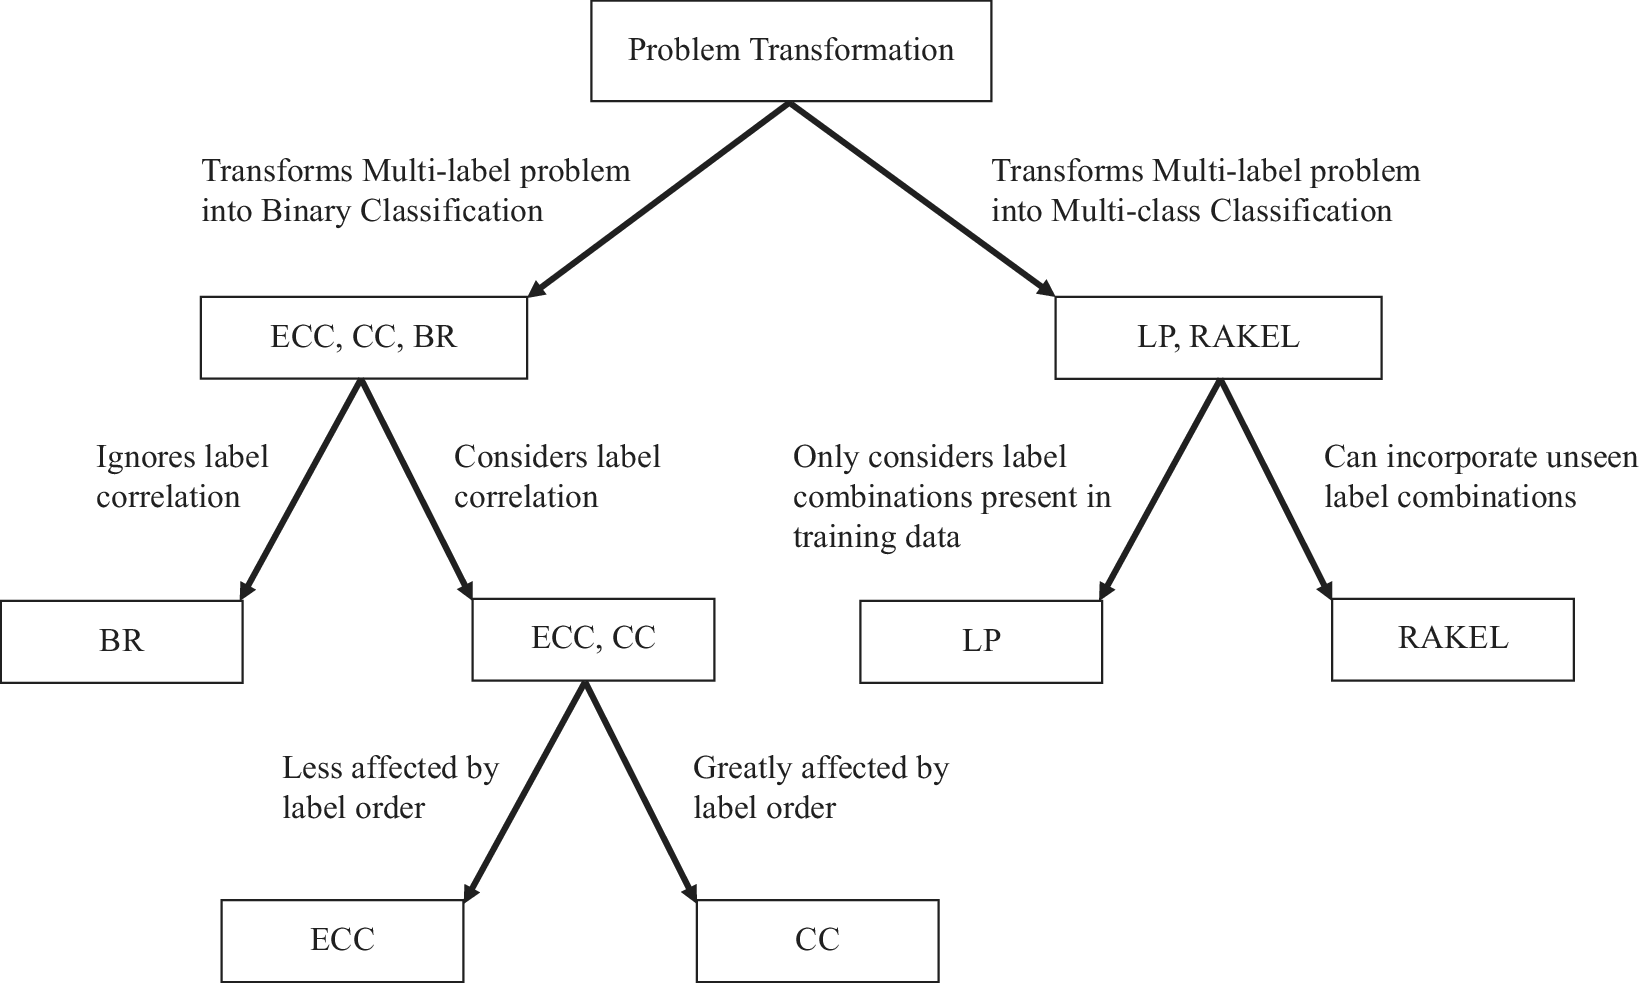
We provide (i) an overview of the computational costs associated with each multi-label approach in Appendix D of the Supplementary Material and (ii) a summary of our (tentatively favored) problem transformation approaches, alongside the earlier-described BR approach, in Figure 1. Since these latter methods are based on transforming the multi-label problem into binary or multi-class classification, the training procedure is identical to standard supervised learning algorithms.Footnote 4 Likewise, these methods’ flexibility in incorporating different base classifiers of one’s choosing helps to ensure comparable underlying interpretability relative to BR on this dimension. That being said, ECC, LP, and RAkEL’s reliance on varying degrees of ensembling does raise practical challenges for these three approaches’ interpretability, relative to simpler BR frameworks. Given that multi-label text-as-data problems are primarily oriented toward the measurement and accurate prediction of labels for future use—rather than explanation—this tradeoff in improved accuracy for some loss in interpretability is preferable for many researchers.
Relationships among problem transformation approaches.

With the above caveats in mind, we note that many of the multi-label approaches reviewed above have exhibited good-to-excellent performance in text-as-data contexts in past comparisons of multi-label methods (Madjarov et al. Reference Madjarov, Kocev, Gjorgjevikj and Džeroski2012). Yet, in terms of relative performance, none of these multi-label methods has emerged as consistently superior to the others.Footnote 5 In light of this, our empirical applications compare the performance of a wide array of multi-label and standard supervised classification approaches. However, in order to do so, special consideration must first be given to choices of comparison metrics, in light of the multi-label context being considered. We, hence, now turn to discussing model comparison in multi-label contexts, before turning to our applications in full.
3 Model Comparison
In single-label learning systems, performance is often evaluated by conventional metrics such as F-score, precision, recall, area under the curve (AUC), and accuracy. However, the evaluation of multi-label models is much more complex as each observation is associated with several labels simultaneously. Rather than simply denoting whether a prediction for a given observation is right or wrong, the latter quality implies that one needs to also evaluate (and hence aggregate over, in some manner) the share of correct labels predicted in multi-label contexts.
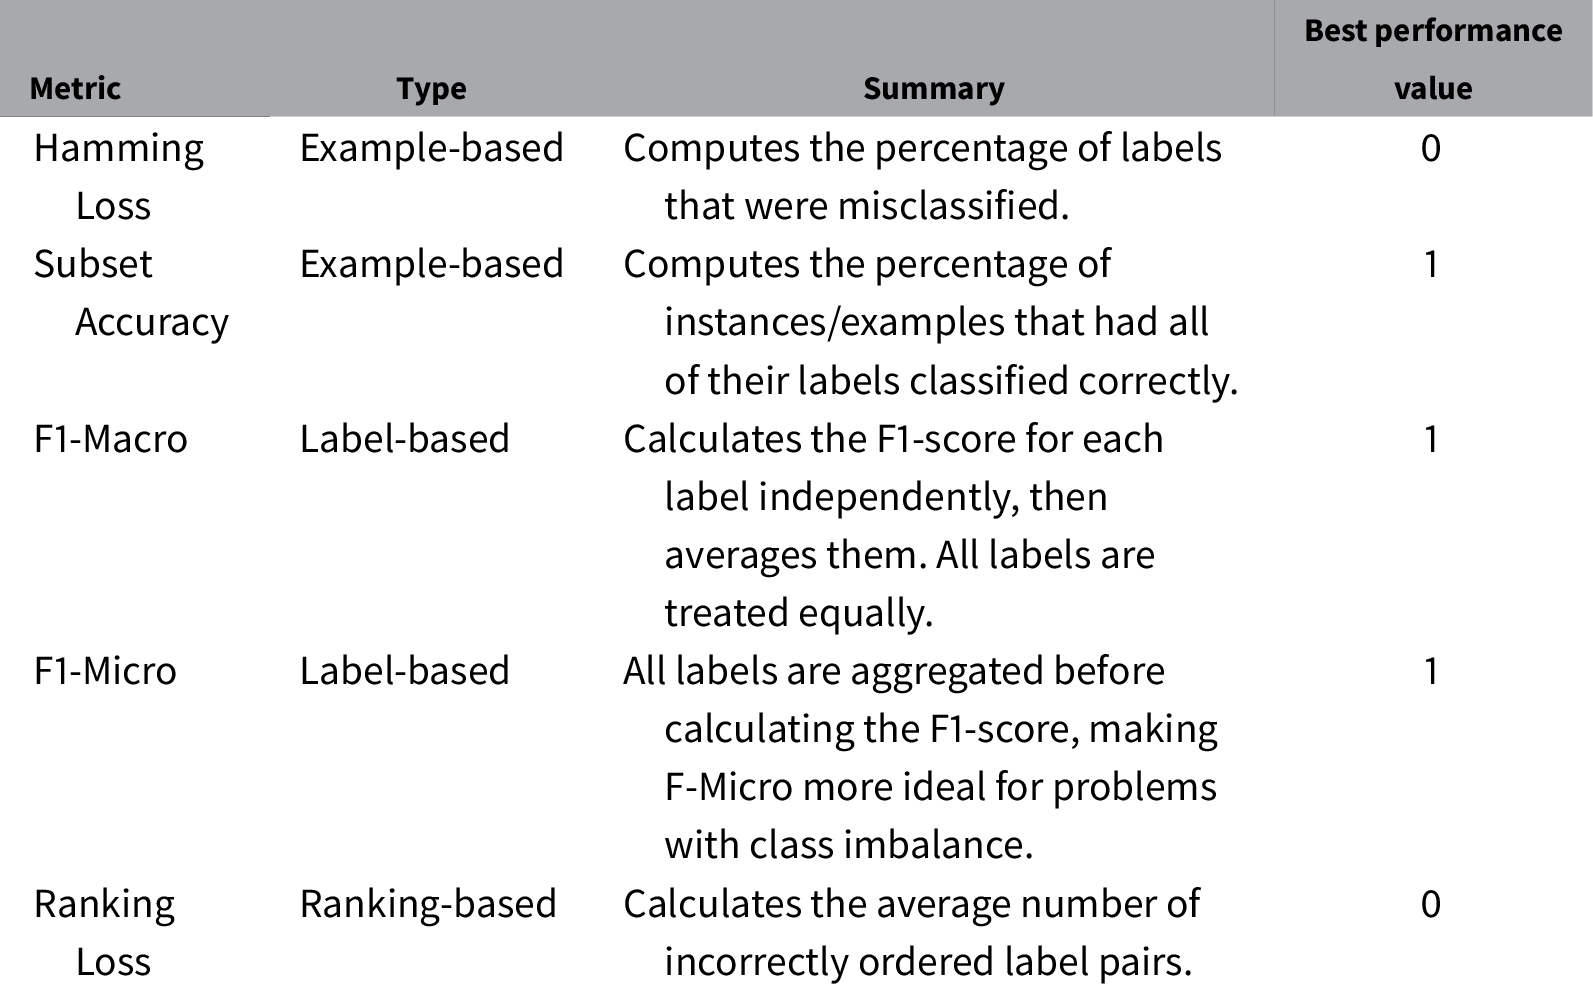
The multi-label evaluation metrics that have been designed for these purposes can be divided in three general categories: example-based, label-based, and ranking-based metrics (Madjarov et al. Reference Madjarov, Kocev, Gjorgjevikj and Džeroski2012). Example-based metrics evaluate average differences between one’s model prediction sets and the true label set of one’s evaluation dataset. On the other hand, label-based metrics assess the predictive performance for each label separately and then average the performance over all labels. Finally, ranking-based metrics use the fraction of label pairs that are incorrectly ordered to evaluate the model. As multi-label metrics may be unfamiliar to some political scientists, we provide a summary table of each metric used in this article in Table 1, and then formally present each metric below.
Multi-label evaluation metrics.

3.1 Example-Based Metrics
Hamming Loss is an example-based metric that computes the fraction of misclassified labels for each observation. It considers both prediction errors (when the prediction is incorrect) and omission errors (when the label is not predicted at all), where lower values are more optimal. For example, a hamming loss of
 $10\%$
means that
 $90\%$
of all labels were classified correctly. It can be formally defined as:
 $$ \begin{align} L_{\mathrm{Hamming}}(Y, \hat{Y}) = \frac{1}{n_{\text{labels}}} \sum_{k=1}^{n_{\text{labels}}} \mathbf{1}(\hat{y}_k \not= y_k) \end{align} $$
where
 $n_{\text {labels}}$
is the total number of labels,
 $\mathbf {1}$
is the indicator function,
 $\hat {y}$
is the kth predicted label and y is the actual label.
Subset Accuracy is a stricter metric than Hamming Loss. Instead of evaluating the fraction of correctly classified labels, Subset Accuracy only considers a prediction as correct if all of an observation’s predicted labels are identical to its true label set:
 $$ \begin{align} Subset_{Acc}(Y, \hat{Y}) = \frac{1}{m} \sum_{i=1}^{m} \mathbf{1}(\hat{Y}_i = Y_i), \end{align} $$
where m is the total number of examples in the test set,
 $\mathbf {1}$
is the indicator function,
 $\hat {Y_i}$
is the ith predicted label set, and
 $Y_i$
is the ground-truth label. This metric can thus be interpreted as reporting the percentage of all observations that have all labels correctly classified, with higher values on this metric being more optimal.
3.2 Label-Based Metrics
For label-based metrics, we consider Macro- and Micro-F1 scores. Each is based on precision and recall.Footnote
6
Precision indicates the proportion of predicted positives that are truly positive while recall denotes the proportion of actual positives that are classified correctly. Macro-F1 is the harmonic mean of the precision and recall averaged across all labels. The precision-macro (
 $p_{\mathrm {macro}}$
) and recall-macro (
 $r_{\mathrm { macro}}$
) are defined as follows:
 $$ \begin{align} p_{\mathrm{macro}_j} = \frac{\mathrm{TP}_j}{\mathrm{TP}_j + \mathrm{FP}_j}, \end{align} $$
 $$ \begin{align} r_{\mathrm{macro}_j} = \frac{\mathrm{TP}_j}{\mathrm{TP}_j + \mathrm{FN}_j}, \end{align} $$
where
 $\mathrm {TP}_j,\mathrm {FP}_j,\; \mathrm {and}\; \mathrm {FN}_j$
denote the true positive, false positive and false negative rate for the label j respectively and q is the number of labels for each example. Macro-F1 can be defined in terms of these metrics as
 $$ \begin{align} \mathrm{Macro{-}F1} = \frac{1}{q}\sum^q_{j=1} \frac{2 ~ p_{\mathrm{macro}_j}. ~ r_{\mathrm{macro}_j}}{p_{\mathrm{macro}_j} + r_{\mathrm{macro}_j}}. \end{align} $$
On the other hand, for Micro-F1 both precision and recall are defined differently:
 $$ \begin{align} p_{\mathrm{micro}_j} = \frac{\sum^q_{j=1}\mathrm{TP}_j}{\sum^q_{j=1}\mathrm{TP}_j + \sum^q_{j=1}\mathrm{FP}_j}, \end{align} $$
 $$ \begin{align} r_{\mathrm{micro}_j} = \frac{\sum^q_{j=1}\mathrm{TP}_j}{\sum^q_{j=1}\mathrm{TP}_j + \sum^q_{j=1}\mathrm{FN}_j}. \end{align} $$
Correspondingly, Micro-F1 is defined as follows:
 $$ \begin{align} \mathrm{Micro{-}F1} = \frac{2 ~ p_{\mathrm{micro}_j}. ~ r_{\mathrm{micro}_j}}{p_{\mathrm{ micro}_j} + r_{\mathrm{micro}_j}}. \end{align} $$
Micro-F1 calculates the metrics by counting the total number of true positives, false negatives, and false positives. That is, the scores of all labels are aggregated to compute the metric. On the other hand, Macro-F1 calculates the metrics for each label independently, and then averages them.
3.3 Ranking-Based Metrics
Ranking Loss evaluates the fraction of label pairs that are incorrectly ordered. As such, it considers only the relative rankings (i.e., orderings) of one’s label predictions—in terms of which labels exhibit higher versus lower predicted probabilities in that label set—and the correspondence between these rankings and a true label set. It can be defined as:
 $$ \begin{align} R_{\mathrm{loss}} = \frac{1}{m} \sum^m_{i=1} \frac{1}{|Y_i||\bar{Y}_i|} |\{(y',y'' | f(x_i,y') \leq f(x_i,y''), (y',y'') \in Y_i ~ \text{x} ~ \bar{Y}_i \}|, \end{align} $$
where
 $\bar {Y}$
is the complementary set of
 $\mathcal {Y}$
in
 $\mathcal {Y}$
. In this case, Ranking Loss is interpreted such that the lower the Ranking Loss, the better the performance. In a similar manner to AUC in single-label prediction contexts, one strength of Ranking Loss is its reliance on relative orderings of label predictions rather than on arbitrary thresholds (e.g., 0.5). This ensures that predictive evaluations via Ranking Loss will be less sensitive to factors that lead to consistently (high or low) predictions relative to a chosen threshold.Footnote
7
To illustrate this, imagine a set of true labels
 $Y_{1_{\mathrm {true}}} = [1,0,0],Y_{2_{\mathrm { true}}} = [1,1,0]$
and a corresponding set of label predictions given by a chosen classifier of
 $f_{1_{\mathrm {pred}}} = [0.4,0.1,0.2],f_{2_{\mathrm {pred}}} = [0.9,0.8,0.6]$
. Using a threshold rule of
 $0.5$
(1 if
 $f(\cdot ) \geq 0.5$
, 0 otherwise), we would obtain a relatively uninformative Hamming Loss of 33% and Subset Accuracy of 0%, as
 $Y_{1_{\mathrm {pred}}} = [0,0,0],Y_{2_{\mathrm { pred}}} = [1,1,1]$
. On the other hand, the resulting Ranking Loss would be zero (i.e., perfect).
4 Applications
4.1 Mexican ATI Requests
Our first application examines ATI requests made to the Mexican federal government during the period 2003–2015. ATI requests in this context have been previously analyzed in efforts to assess the degree to which Mexican citizens use this ATI system to hold their government publicly accountable (Berliner, Bagozzi, and Palmer-Rubin Reference Berliner, Bagozzi and Palmer-Rubin2018), or to understand government responsiveness (Almanzar, Aspinwall, and Crow Reference Almanzar, Aspinwall and Crow2018; Berliner et al. Reference Berliner, Bagozzi, Palmer-Rubin and Erlich2021). We provide additional background on Mexico’s ATI system in the Supplementary Material. The textual content of our ATI requests contains requesters’ open-ended descriptions of their desired information, as entered into an online ATI request system’s primary request field, supplemental information field, and attachments field. Attachments were webscraped, converted to machine readable text via optical character recognition, and then combined with other request text fields to form our primary textual entries of interest. Altogether, this process produced a sample of 1,025,953 requests for our consideration.
We are interested in a wide variety of traits associated with each of these request texts, pertaining to qualities such as the use of legalistic and technical language, the number of distinct pieces of information requested, and the appropriateness of the request for the targeted agency. Developing accurate and fine-grained measures of attributes like these will enhance understandings of the nature and dynamics of citizen demand for information, and of the request-specific determinants of government responsiveness—both in general and as it varies across agencies and time. We accordingly drew a random sample of 4,925 requests—stratified by year—from our full sample of request texts. Six Mexico City-based coders coded these request texts for distinct ATI-request traits. For this paper, we retained 26 total (ATI-request trait) labels for classification. Our original request traits—and overall human coding approach—are discussed in the Supplementary Material.
With this sample of 4,925 human coded requests, we then trained all aforementioned classifiers on this sample, classifying all 1,021,028 remaining (non-human coded) ATI requests for each of our 26 labels. All relevant text processing steps that were applied to the raw texts prior to classification—and the hyperparameters used for each model—are described in the Supplementary Material. The overall level of correlation for our 26 labels is not high, suggesting that this application is a “hard test” for the potential benefits of multi-label classification. On average, the correlation between our pairs of hand-coded labels is 0.06 with the lowest and highest pairwise correlations being 0 and 0.40, respectively.
We next evaluate the value added of the multi-label framework (i.e., of considering inter-label relations for our document-level labels). In order to do so, we compare the results obtained from four plausible approaches to handling multi-label data. The first pair of general approaches that we consider are BR and ML-kNN. Recall that neither of these two approaches consider label relations. By contrast, the second pair of general multi-label approaches that we consider (CC and LP) do consider label correlations.
Within each of these general approaches, we then implement and consider several of the extensions described further above. Turning first to the CC approach, we consider its basic implementation and also a version where the label ordering was permuted. For the latter CC approach, the final output was composed of the average of each permuted chain, ECC.Footnote 8 Similarly, for the LP approach, we considered both its standard definition and the RAkEL extension. The base classifier for each of these methods was a standard logistic regression.
For the ML-kNN, we only considered the standard version since its proposed extensions are not yet readily available. On the other hand, we evaluate four different varieties of BR classifiers. The first, presented as standard BR, used a simple random forest with the same parameters applied to all labels. For the second BR variant, we perform a grid search to find the best performing classifier and corresponding hyperparameters for each label. This approach is labeled as BR optimized below.
For the third BR variant, BR optimized threshold, we kept the same classifier for all labels. However, instead of using the standard 0.5 classification threshold, we optimized the threshold for each label by selecting 20 different splits of the training data and selecting the threshold value for each label that maximized the F1-score. Finally, to more directly address class-imbalance in some labels, we used an oversampling technique to generate synthetic samples from the minority class, known as SMOTE (Blagus and Lusa Reference Blagus and Lusa2013). Using this technique, we trained the final BR classifier that we consider, hereafter referred to as BR optimized SMOTE.
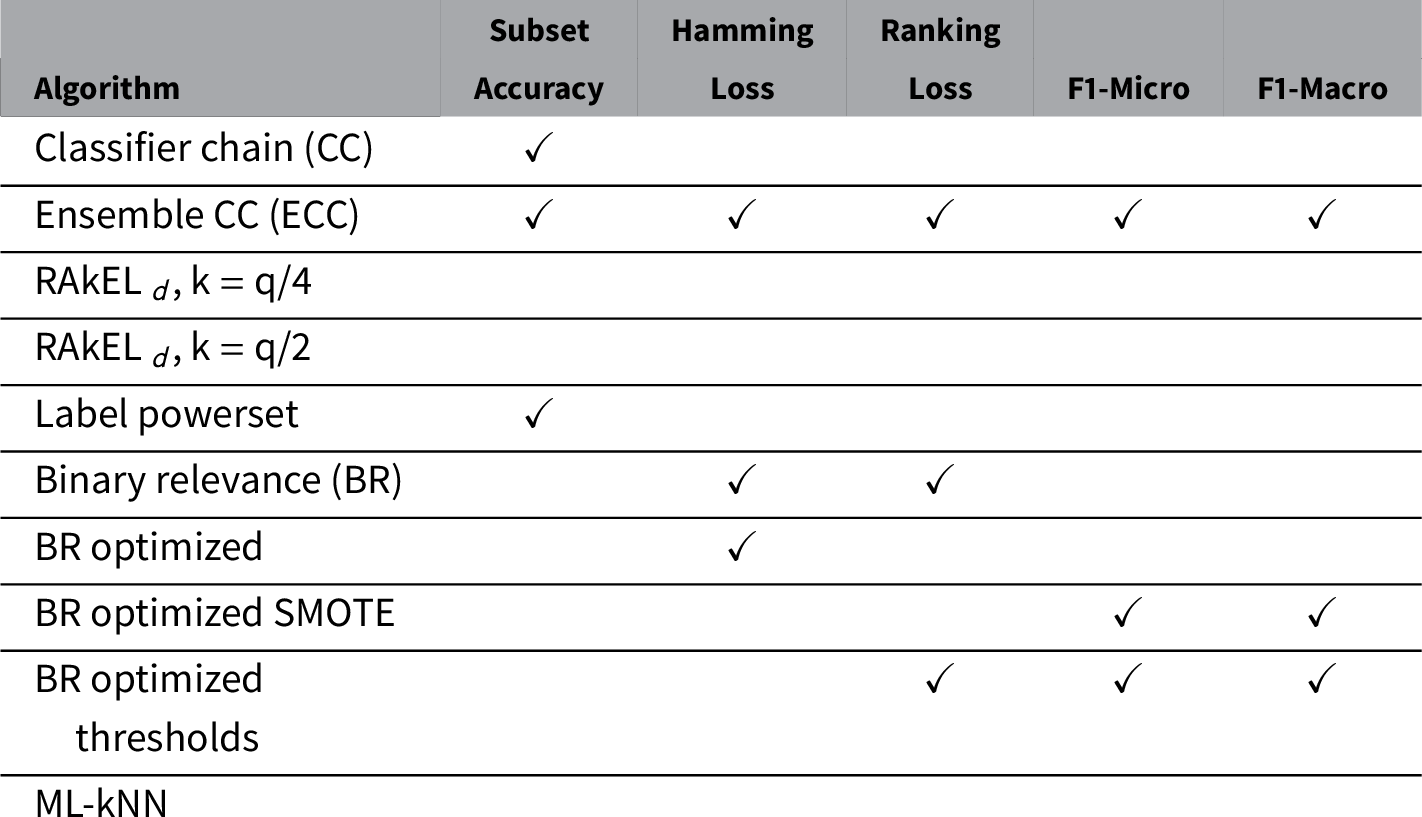
The multi-label results obtained from all classifiers considered are summarized in Table 2. The algorithms used were based on the implementations provided by Python’s scikit-multilearn package (Szymański and Kajdanowicz Reference Szymański and Kajdanowicz2017) and sklearn (Pedregosa et al. Reference Pedregosa2011)Footnote 9 . Each model was evaluated using 80% of the data for training and 20% for testing with 10 different splits. Further details on hyperparameter selection for each algorithm considered appear in Appendix Table E.2 in the Supplementary Material.
Results for 10 different data splits.

The top three performers for each metric are highlighted. Full details appear in Table E.1 of the Supplementary Material.
Turning to Table 2, we find that ECC achieves the best performance among all tested classifiers. That is, we can determine from Table 2 that ECC routinely outperforms our alternate approaches, and can also observe that ECC is a top-three performer across all metrics used. This finding supports our contentions regarding the importance of taking into account relationships between labels for multi-label classification of political text-as-data. The complete results for all metrics considered here can be found in Table E.1 of the Supplementary Material and are consistent with this summary interpretation. These results suggest that ECC also exhibits the lowest average deviation when compared to other algorithms. Additional discussion of the predicted proportions for each label is likewise presented in the Supplementary Material.
For the four BR classifiers considered in Table 2, the optimized version achieved the lowest Hamming Loss whereas the SMOTE version achieved the highest F1-Macro. The latter finding underscores our earlier contentions regarding F1-Macro being a poor metric for class imbalanced data. Regarding the former finding, we can note that each of the classifiers used in the BR optimized-component of this application was selected based upon the accuracy score for its corresponding label individually. Therefore, these BR classifiers were optimized by minimizing the Hamming Loss. Regarding the remaining classifiers in Tables 2 and E.1, we can further observe in this case that the results for ML-kNNFootnote 10 are remarkably worse than all other models.
We can thus conclude that multi-label approaches that give careful consideration to the relationships between one’s labels tend to outperform several less label-aware approaches that are more common in the political science literature. To this end, our CC approaches tended to exhibit higher Subset Accuracy than BR and comparable results for other metrics. This finding, and those outlined above, suggest that multi-label classification allows researchers to achieve superior labels within multi-label classification tasks, even in contexts where the correlation between these multiple labels is relatively low. This provides strong support for the multi-label approach in a real-world text-as-data context. Our next application offers researchers further guidance on when, specifically, multi-label methods are likely to be more or less effective.
4.2 Country-Year Human Rights Practices
Our second application allows us to evaluate the benefits of using multi-label algorithms in the context of a separate political science text-as-data domain. For this application, we specifically compare the best performing multi-label algorithm from our first application (ECC) to BR using a set of extant human rights texts and labels. Our human rights data include a combination of (i) country-year textual reports on human rights practices and (ii) overlapping labels of states’ annual human rights practices, as human-labeled from these same texts by the CIRI data project (Cingranelli and Richards Reference Cingranelli and Richards2010). As noted in the introduction, automating the measurement of human rights abuses from the human rights texts is an area of growing interest in political science (Fariss et al. Reference Fariss2015; Greene, Park, and Colaresi Reference Greene, Park and Colaresi2019; Murdie, Davis, and Park Reference Murdie, Davis and Park2020; Park, Greene, and Colaresi Reference Park, Greene and Colaresi2020a,Reference Park, Greene and Colaresib). Our application of multi-label methods to these data thus stands to advance the state of the art for these automated endeavors.
The text-as-data component to this application is a corpus of U.S. State Department Country Reports on Human Rights Practices for the years 1981–2011.Footnote 11 Each document corresponds to the State Department’s assessment of a particular country’s annual domestic human rights practices during the previous calendar year. We match these reports to 14 indicators, from the CIRI project, of specific types of human rights violations and practices at the country-year level. These indicators were human-coded by the CIRI project from the U.S. State Department texts outlined above, and encompass categories of human rights abuse that range from targeted killings and torture to violations of women’s political rights and freedom of speech. To simplify interpretation, we (i) dichotomize each (originally ordinal) CIRI variable and (ii) then reverse-code each dichotomized variable such that higher values imply worse (as opposed to better) human rights performance. We provide further details on these CIRI variables in the Supplementary Material, Appendix F.
In total, there are 4,756 reports, each with 14 binary indicators for (country-year) violations of different human rights wherein a 0 denotes “no violations” of a given violation type and 1 denotes a human rights violation of a certain type. As noted above—and unlike our first application—these labels were directly drawn from an existing human-coded country-year dataset (i.e., CIRI), rather than from human-labeling of our own. These human rights labels are furthermore much more highly correlated than the previous ATI Requests application. On average, the correlation between each current label is 0.33, with a maximum value of 0.60 and a minimum 0.06.
With respect to the text features considered, we begin with the full document term matrix (DTM) of raw term counts from our human rights reports of interest. This DTM format is consistent with formats used by past text-as-data research into these same State Department human rights reports (Fariss et al. Reference Fariss2015), and, in our case, follows the preprocessing steps applied by Bagozzi and Berliner (Reference Bagozzi and Berliner2018) to a similar corpus of human rights reports. After implementing these preprocessing steps, our final DTM contains 2,445 unique stemmed unigrams as features.
In addition to these DTM-features, the ECC algorithm also allows us to incorporate the label correlation information between our CIRI human rights violation target measures within our multi-label classification tasks. We anticipate that the latter information will be highly relevant, given that—as mentioned in Section 2—many of the specific CIRI violations considered here (e.g., disappearances, killings, and torture) are likely to arise (and be correlated with one another) under a common strategy of state repression. We are, hence, interested in quantifying the added improvement that is gained by accounting for these interdependencies. Within these evaluations, this second application also (uniquely) varies the set of retained features that we use in classification, so as to assess whether our findings with respect to the ECC’s added improvements vary in relation to the number of features that a given researcher has available for use in classification.
We thus evaluated the performance of ECC and BR with respect to the classification of our 14 binary human rights violation categories when including different subsets of DTM features, which are chosen at random. We posit that if a classifier has enough information from its original features to adequately classify all target labels, there is probably very little to gain in leveraging the relationships between target labels during classification.Footnote 12 On the other hand, if there are insufficient features to properly classify all target labels, the additional information available to the researcher via any empirical correlations between each multi-label label will likely improve prediction significantly. This suggests that our multi-label approach will improve in relative performance over BR as the number of available features for classification declines.
We utilize our human rights data within a series of experiments to evaluate the above contentions. These experiments corresponded to our evaluation of ECC and BR model performance across 10 different data splits (80% for training and 20% for testing) for each feature level considered. The number of features ranged from all features available to as low as 20% of the total number of features drawn at random. In evaluating the ECC and BR approaches, we consider three base classifiers in each case: support vector machine (SVM) with linear kernel, random forest, and logistic regression.
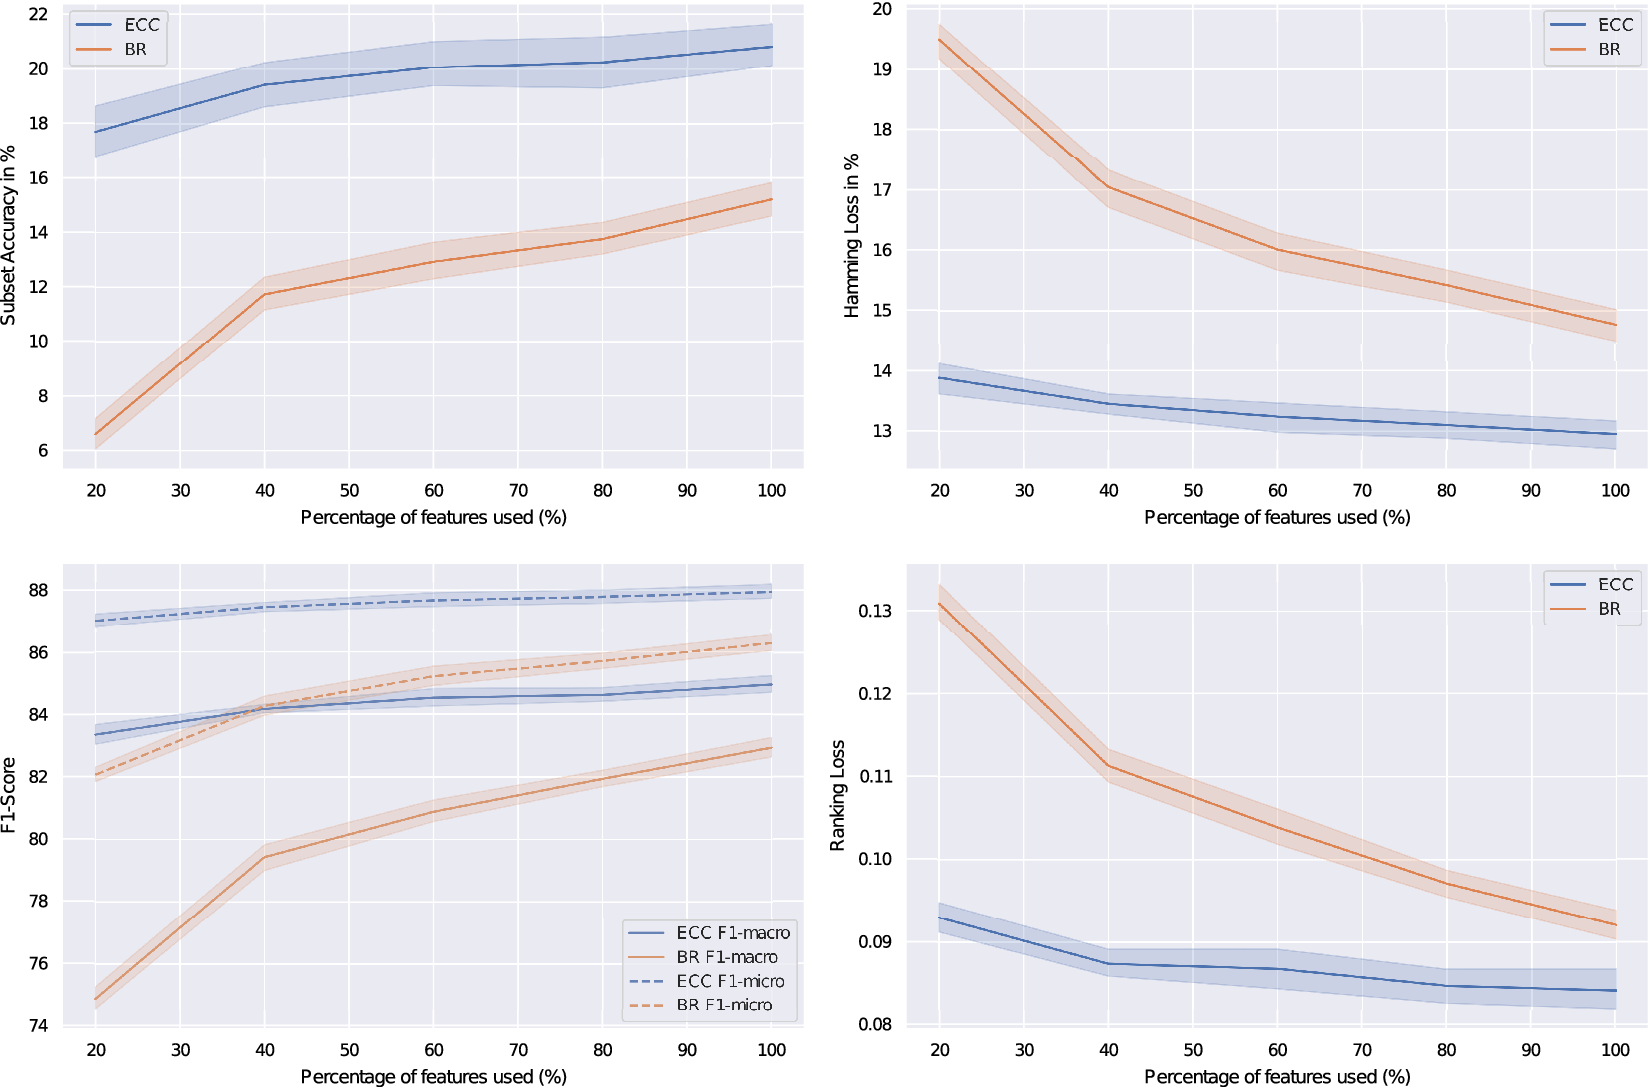
The results from these experiments are presented in Figure 2, considering five of the model performance criteria outlined above: Subset Accuracy, Hamming Loss, F1-Macro, F1-Micro, and Ranking Loss. For all results plotted in Figure 2, BR and ECC base classifiers were chosen according to best overall performance. The best base classifier for BR was an SVM with linear kernel, whereas for the ECC the best performing base classifier was a random forest. Our conclusions are comparable when we standardize the base classifier across BR and ECC.
Performance of binary relevance (BR) and ensemble classifier chain (ECC) for the proposed metrics. Shaded regions denote the standard deviation of the bootstrap splits. For the metrics reported in the left-hand panels, higher values imply better performance. For the metrics reported in the right-hand panels, lower values imply better performance.

Examining the performance criteria in Figure 2, we can first observe that ECC routinely outperforms BR no matter the model performance metric or percentage of retained features considered. As in the case of Mexican ATI requests, this result provides strong support for the use of ECC (and hence multi-label methods) in contexts where a researcher is faced with multi-label data. Further, when only a small percentage of features are available (20%), the gap in performance between ECC and BR is the widest. For instance, this gap is
 $11.09\%$
for Subset Accuracy with 20% of features available. This result implies that the desirability of ECC over the more commonly used BR is especially pronounced when researchers are faced with a multi-label problem but have a limited number of features for prediction. As the number of available features increases, we find that the difference in performance between ECC and BR becomes less and less notable.
Hence, when features are abundant, the benefits of ECC become less salient, suggesting that researchers whose prediction tasks already include an exceptionally large number of (relevant) features may find BR to be sufficient. By contrast, researchers faced with a more limited set of features—in terms of total number, relevance, or related traits (e.g., sparsity)—are likely to especially benefit from using ECC or other multi-label methods. These trade-offs notwithstanding, as both applications suggest, multi-label methods typically exhibit advantages over BR approaches even in cases where one’s feature set is relatively large and even when one’s multi-label targets exhibit a relatively low level of correlation.
4.3 Monte-Carlo Simulations
The applications presented above assess the performance of a wide range of multi-label classifiers in two distinct empirical settings and across different levels of available features. However, these applications do not provide insight into the relative performance of these approaches under differing (i) scenarios of available training data or (ii) end-use cases for one’s classified labels. Accordingly, our Supplementary Material further compares our best performing multi-label approach (ECC) to BR across a series of Monte-Carlo simulations.
We find that ECC outperforms BR for every classification metric considered—and especially for Subset Accuracy and Hamming Loss. Across three auxiliary regression set-ups, we then confirm in this context that ECC’s superior classification performance also ensures that the parameter estimates obtained when subsequently using ECC’s classified labels as regressors and/or regressands are superior in accuracy and coverage to those recovered by BR—and increasingly so as one’s available training (test) data decrease (increase).
5 Conclusion
Supervised machine learning is now a commonly used means for coding measures from political and social texts. While such tools are typically applied independently to a single variable of interest at a time, many political science projects now seek to code multiple, distinct target variables from a single set of texts. We demonstrate that substantial gains can be made by recognizing this data structure, and by using multi-label prediction to leverage each target variable’s predictions when predicting subsequent target variables. Given current trends in political text classification (Barberá et al. Reference Barberá, Boydstun, Linn, McMahon and Nagler2020; Chang and Masterson Reference Chang and Masterson2020; Miller, Linder, and Mebane Reference Miller, Linder and Mebane2020)—and related trends in automated image and audio analyses (Dietrich, Hayes, and O’Brien Reference Dietrich, Hayes and O’Brien2019; Torres and Cantú Reference Torres and Cantú2020; Williams, Casas, and Wilkerson Reference Williams, Casas and Wilkerson2020)—the need for multi-label methods is only likely to grow in the future.
This paper has accordingly sought to introduce political scientists to multi-label prediction, and to highlight where and how it may benefit their own research. Our applications and simulations demonstrate that multi-label classification increasingly outperforms standard classification approaches (i) as the correlation across one’s target variables increases and/or (ii) when one’s share of training (test) data declines (increases). We also offer further insight into precisely when multi-label methods offer significant advantages in our second application’s determination that the relative strengths of multi-label classification will decidedly increase as the number of available features declines. To facilitate these insights, we also provide a comprehensive overview of the requisite performance criteria for evaluations of multi-label predictions. Together, these insights will help to ensure that future multi-label classifications of political texts are as accurate as possible.
Acknowledgments
We thank Jeff Gill, four anonymous reviewers, Kevin Aslett, Vito D’Orazio, Ore Koren, and members of DemoTIP lab for their helpful comments and suggestions. We would also like to thank Jésica Tapia, Carmen Castañeda, Katia Guzmán, Sandra Juan, Edith Mercado, and Andrea Sánchez for for their research assistance.
Funding
This work was supported by the Social Science and Humanities Research Council [430-2018-1069 to A.E., 430-2018-1069 to S.G.D.], the Fonds de recherche du Québec - Société et culture [253243 to A.E., 253243 to S.G.D.], Compute Canada [to A.E. and S.G.D.], the National Science Foundation [DMS-1737865 to B.E.B.], the University of Delaware General University Research Fund [to B.E.B.], the LSE Suntory and Toyota International Centres for Economics and Related Disciplines [to D.B.], and the Marquette University Committee on Research [to B.P.R.].
Data Availability Statement
Replication code for this article is available at Erlich et al. (Reference Erlich, Dantas, Bagozzi, Berliner and Palmer-Rubin2021) at https://doi.org/10.7910/DVN/SOVPA4.
Supplementary Material
For supplementary material accompanying this paper, please visit https://doi.org/10.1017/pan.2021.15.