Nomenclature
- HAT
-
Human–Automation Trust
- KNN
-
K-Nearest Neighbors
- RF
-
Random Forest
- LDA
-
Linear Discriminant Analysis
- LR
-
Logistic Regression
- EEG
-
Electroencephalogram
- fNIRS
-
functional Near-infrared Spectroscopy
-
 $\alpha$
-
Alpha
-
$\beta$
-
Beta
-
$\gamma$
-
Gamma
-
$\delta$
-
Delta
-
$\theta$
-
Theta
- HbO
-
Oxygenated Hemoglobin
- DLPFC
-
Dorsolateral Prefrontal Cortex
- DMPFC
-
Dorsal Medial Prefrontal Cortex
- HbR
-
Deoxygenated Hemoglobin
- ECG
-
Electrocardiography
- HRV
-
Heart Rate Variability
- LF/HF
-
Low-Frequency/High-Frequency
- HR
-
Heart Rate
- SDNN
-
Standard Deviation of Normal to Normal
- ADAS
-
Advanced Driver Assistance Systems
- GSR
-
Galvanic Skin Response
- CNN-LTSM
-
Convolutional Neural Networks with Long Short-Term Memory networks
- LightGBM
-
Light Gradient Boosting Machine
- XGBoost
-
Xtreme Gradient Boosting
- QDA
-
Quadratic Discriminant Analysis
- SYS
-
SYStem monitoring
- AF-MATB
-
Air Force Multi-Attribute Task Battery
- HHAT
-
High HAT
- LHAT
-
Low HAT
- MATB II
-
Multi-Attribute Task Battery II
- TAK
-
TAKeover and flight
- RES
-
RESource regulation and pump monitoring
- TWS
-
Takeover Warning System
- ICA
-
Independent Component Analysis
- FFT
-
Fast Fourier Transform
- ADWF
-
Average Duration of Whole Fixations
- ADF.TAK
-
Average Duration of Fixations in the TAK area
- TDF.TAK
-
Total Duration of Fixations in the TAK area
- NF.TAK
-
Number of Fixations in the TAK area
- AAS
-
Average Amplitude of Saccade
- APVS
-
Average Peak Velocity of Saccades
- SDPVS
-
Standard Deviation of Peak Velocity of Saccades
- AWFPD
-
Average Whole-Fixation Pupil Diameter
- AU
-
Action Unit
- BPM
-
Beats Per Minute
- LF
-
Low Frequency
- TP
-
Total Power
- LF ratio
-
Low Frequency ratio
- HF ratio
-
High Frequency ratio
- LF_nu
-
Low Frequency in normalized units
- ANOVA
-
ANalysis Of VAriance
- PCA
-
Principal Component Analysis
- DT
-
Decision Tree
- GNB
-
Gaussian Naive Bayes
- MLP
-
Multilayer Perceptron
- SVM
-
Support Vector Machine
- fMRI
-
functional magnetic resonance imaging


1.0 Introduction
In the field of human–computer interaction, human–automation trust (HAT) is generally defined as ‘the attitude that an agent will help achieve an individual’s goals in a situation characterised by uncertainty and vulnerability’ [Reference Lee and See1]. Between 2018 and 2019, two major aviation accidents involving the Boeing 737 MAX, namely Lion Air Flight 610 and Ethiopian Airlines Flight 302, resulted in a total of 346 fatalities, serving as a tragic illustration of the catastrophic consequences arising from a breakdown of HAT. Investigations revealed that the direct cause of these accidents was the manoeuvring characteristics augmentation system, which operated silently in the background with unpredictable behaviour and poor transparency in its design [Reference Jamieson, Skraaning and Joe2, Reference Saghafian, Vatn, Moltubakk, Bertheussen, Petermann, Johnsen and Alsos3]. This design flaw prevented pilots from effectively delegating decision-making and control authority to the automated system in critical situations, ultimately leading to a collapse of trust, escalated human–automation conflict and the loss of both aircraft and lives. As interactions between human operators and intelligent agents become increasingly frequent, the measurement and discrimination of HAT have become ever more crucial, yet related research remains relatively underdeveloped. The quantification of trust using multidimensional measures encompassing subjective, behavioural and physiological dimensions enables the detection of trust biases such as overtrust or distrust, thereby optimising human–machine interface design, informing targeted training strategies and ultimately ensuring safe and efficient human–automation collaboration in complex aviation environments.
Recent studies have identified three primary approaches for measuring HAT: self-report, behavioural and physiological measures [Reference Walker, Forster, Hergeth, Kraus, Payre, Wintersberger and Martens4], each exhibiting distinct strengths and limitations in application [Reference Kohn, De Visser, Wiese, Lee and Shaw5]. Self-report measures, such as the Jian scale [Reference Jian, Bisantz and Drury6], have the advantages of being easy to implement, cost-effective and exhibiting relatively high face validity. However, these approaches typically rely on retrospective ratings conducted after task completion; they are susceptible to recall bias and therefore tend to be highly subjective. Behavioural measures are objective and non-intrusive, yet inferring trust levels solely from behavioural indicators such as task completion time or error rates remains contentious, as trust is not the only factor influencing behaviour [Reference Kohn, De Visser, Wiese, Lee and Shaw5]. In comparison, physiological measures have attracted growing attention for their real-time responsiveness and objectivity, despite requiring specialised equipment and rigorous experimental control. Regarding physiological features, the sensor suite for the flight environment has gained significant interest. Given the constraints of aviation dynamic scenarios, non-contact approaches show great promise. While the minimal requirements for sensor configuration have not yet been clearly defined, the selection and combination of limited physiological features can result in markedly different trust detection outcomes. Nevertheless, exploring the effects of various physiological feature combinations remains valuable. The exploration of sensitive physiological markers has emerged as one of the fastest-growing areas in HAT research [Reference Kohn, De Visser, Wiese, Lee and Shaw5].
Furthermore, the discrimination of HAT-related states has attracted considerable attention, primarily employing supervised learning, reinforcement learning and related techniques for estimating or classifying trust levels [Reference Campagna and Rehm7]. Supervised learning methods typically include models with limited interpretability, such as k-nearest neighbours (KNN) and random forest (RF), as well as more interpretable models, such as linear discriminant analysis (LDA) and logistic regression (LR). The discriminative performance varies depending on the interpretability of the chosen model. In contrast, reinforcement learning methods are generally less interpretable, yet they often achieve superior discrimination performance. Currently, the discrimination of HAT-related states in aviation environments not only lacks comprehensive integration of the aforementioned sensitive features but also suffers from insufficient comparative analysis regarding algorithm interpretability, highlighting the need for further investigation.
1.1 Literature review
In the exploration of sensitive indicators related to HAT-related states. Current physiological approaches for capturing HAT fall into two broad categories: neural measures and various types of physiological responses [Reference Kohn, De Visser, Wiese, Lee and Shaw5]. Within the domain of neural activity assessment, electroencephalography (EEG) and functional near-infrared spectroscopy (fNIRS) are two representative techniques. EEG provides millisecond-level temporal resolution, allowing precise tracking of rapid fluctuations in cortical activity [Reference Zhang, Yang, Chen, Li, Zang and Qu8]. A substantial body of evidence suggests that statistically significant neural signatures are often concentrated in rhythmic activities within specific frequency bands [Reference Wang, Hussein, Rojas, Shafi and Abbass9]. For instance, during decision-making and word elicitation tasks, trusted scenarios are associated with increased alpha (
 $\alpha$
) and beta (
 $\beta$
) power in the frontal lobes, indicating active neural connectivity, whereas distrusted scenarios elicit elevated gamma (
 $\gamma$
) activity in the temporal lobes [Reference Oh, Seong, Yi and Park10, Reference Oh, Seong, Yi and Park11]. In highly automated driving scenarios, suppressed frontal
 $\alpha$
activity has been observed during system malfunctions [Reference Seet, Harvy, Bose, Dragomir, Bezerianos and Thakor12], while increased
 $\beta$
power has been linked to lower system trust [Reference Zhang, Yang, Chen, Li, Zang and Qu8]. Similarly, in scaffolding and rectification tasks, high
 $\alpha$
power has been associated with greater trust levels [Reference Chen and Chan13]. Moreover, findings from investment game paradigms indicate that trust and trust-related decisions are closely associated with delta (
 $\delta$
) and
 $\gamma$
activity [Reference Wang, Hussein, Rojas, Shafi and Abbass9], as well as
 $\alpha$
suppression at parietal electrode sites [Reference Blais, Ellis, Wingert, Cohen and Brewer14], suggesting that high-frequency oscillations and inhibitory rhythms may serve as effective neural markers of trust.
fNIRS, a non-invasive brain imaging technique, offers moderate spatial resolution, strong resistance to motion artifacts and high portability, making it ideal for HAT studies in naturalistic or high-ecological validity environments. Empirical evidence suggests that changes in oxygenated haemoglobin (HbO) concentration measured by fNIRS may serve as a sensitive indicator of trust states. For instance, during non-driving-related tasks in highly automated driving contexts, the group with low credibility showed increased HbO concentration in the dorsolateral prefrontal cortex (DLPFC) during risk events [Reference Perello-March, Burns, Woodman, Elliott and Birrell15]. In crime mapping tasks, elevated HbO activity was observed in the dorsal medial prefrontal cortex (DMPFC) prior to low-trust events, whereas deoxygenated haemoglobin (HbR) did not show a significant difference [Reference Eloy, Doherty, Spencer, Bobko and Hirshfield16]. Similarly, in an image classification task with an AI teammate, higher concentrations of both HbO and HbR were detected under trusted conditions compared to distrusted ones [Reference Bandara, Liao, Chowdhury and Abbott17]. In collaborative robot scenarios, erroneous robot behaviour elicited enhanced activation in the medial and right dorsolateral prefrontal cortices [Reference Hopko and Mehta18]. These findings suggest that neural responses measured by EEG and fNIRS reflect variations in trust; however, current research remains largely confined to domains such as automated driving and human–robot collaboration, with sensitive features mainly centred on EEG
 $\alpha$
activity and fNIRS HbO. Investigations into the neural mechanisms underlying HAT in aviation-specific contexts remain limited, highlighting the need for further research to extend and refine these findings.
Various physiological responses are commonly used to assess HAT, including eye tracking, facial expression analysis and electrocardiography (ECG) monitoring. As non-invasive approaches, eye tracking and facial expression analysis are frequently employed to evaluate HAT. Eye tracking offers the advantage of being minimally intrusive and providing real-time insights into visual attention allocation. Nonetheless, studies have yielded inconsistent findings regarding its relationship with HAT, around half of the studies identified significant associations, primarily related to fixation metrics, while others found no clear patterns [Reference Lee and Gutzwiller19]. For example, in scenarios involving highly automated driving, self-reported trust was associated with reduced monitoring of the automated system; during a UAV-based military target identification task, low-reliability conditions resulted in longer fixation durations, more frequent fixations and extended scan paths [Reference Lu and Sarter20]; in human–robot collaborative assembly tasks, the trust-breach phase showed increased fixation counts and decreased gaze transition entropy compared to the trust-building phase [Reference Zhang, Yadav, Hopko and Mehta21]; and in a planetary gear system cooperation task, unreliable robot behaviour led to increased gaze frequency towards the robot, higher stationary gaze entropy and reduced gaze transition entropy [Reference Hopko, Zhang, Yadav, Pagilla and Mehta22].
Facial expression analysis captures micro-expressions associated with trust; however, research linking facial expressions to trust remains in its early stages. For instance, in a competitive card-bluffing game, trusted states were associated with increased facial actions such as ‘happy’, ‘mouth smile left’ and ‘mouth smile right’ [Reference Alzahrani, Nasir, Tayeb, André and Ahmad23]. However, facial expressions may be influenced by contextual factors and exhibit significant individual variability, which necessitates further validation of their reliability as standalone indicators of trust. ECG has been shown to reflect trust-related autonomic activation, with elevated heart rate variability (HRV) observed under unreliable conditions [Reference Ayoub, Avetisian, Yang and Zhou24, Reference Hopko, Mehta and Pagilla25], though some studies show no consistent patterns [Reference Kessler26]. For instance, during a metal-surface polishing task, unreliable behaviour from a UR10 collaborative robot triggered a significant decrease in the low-frequency/high-frequency (LF/HF) ratio, suggesting a suppression of sympathetic activity [Reference Hopko, Mehta and Pagilla25]; conversely, in a dynamic trust-induction task involving planetary gear assembly, no significant changes were observed in heart rate (HR), standard deviation of normal to normal (SDNN), or LF/HF [Reference Zhang, Yadav, Hopko and Mehta21], indicating that trust fluctuations do not always evoke explicit ECG responses. In contrast, in a competitive bluff game task, high-trust states were linked to elevated mean HR, potentially reflecting physiological activation during engaged participation [Reference Ahmad and Alzahrani27]. In summary, various HAT-sensitive physiological responses are primarily reflected in gaze-based metrics from eye tracking, micro-expressions from facial analysis and HRV-related indices from ECG. However, these findings require further exploration and validation, particularly within aviation-specific contexts.
In the field of trust discrimination research, researchers have developed various trust models [Reference Zhang, Yang, Chen, Li, Zang and Qu8], predominantly utilising supervised learning, reinforcement learning and related techniques for estimating or classifying trust levels [Reference Campagna and Rehm7]. For instance, in a real-road experiment, leveraging inputs such as hand position transition probability matrices, age, gender and advanced driver assistance systems (ADAS) types, an RF algorithm achieved 79.57% accuracy in discriminating three trust levels derived from k-means clustering of self-reported scores [Reference Yu, Bao, Zhang, Sullivan and Flannagan28]. In driving simulator takeover tasks, RF was employed to analyse physiological features and takeover-related factors for binary classification of trust-increasing and trust-decreasing groups, achieving 73.7% accuracy and an 77.3% F1-score [Reference Yi, Cao, Song, Wang, Zhao, Guo and Cao29]; a subsequent study using a smoothed convolutional neural networks with long short-term memory networks (CNN-LTSM) method maintained 73.7% accuracy and a 75.3% F1-score [Reference Yi, Cao, Song, Wang, Guo and Huang30]. Similarly, another study classified driver trust into low, medium and high levels based on self-reported ratings and by integrating whole-brain features with a light gradient boosting machine (LightGBM) algorithm, achieved an accuracy of 88.44% and an F1-score of 78.31% [Reference Zhang, Yang, Chen, Li, Zang and Qu8]. In an image classification task, self-reported ratings were used to define trust and mistrust conditions, with a 200-dimensional feature vector constructed from five characteristics (mean, standard deviation, kurtosis, minimum and maximum) of fNIRS HbO and HbR across 20 channels, and an Xtreme Gradient Boosting (XGBoost) model achieved the highest accuracy of 76.0% [Reference Bandara, Liao, Chowdhury and Abbott17]. In a VR-based collaborative bricklaying task, features including fNIRS, GSR, HR and head motion were used as inputs to a convolutional neural network (CNN) model for classifying trust-decreasing and trust-increasing states, with an accuracy of 71.9% [Reference Chang, Gonzalez Garcia and Hasanzadeh31]. Another study conducted in a chemical industry scenario, where a collaborative robot (cobot) assisted in handing over a beaker and pouring chemicals, used a 4D tensor (batch size, height, width and depth) as input, and a CNN model classified high and low trust, achieving accuracies of 78.61% in the handing task and 73.35% in the pouring task [Reference Campagna, Chrysostomou and Rehm32]. Additional studies also explored multimodal inputs, including Galvanic Skin Response (GSR), HR and eye-tracking features; 28 × 28 pixel time–frequency–spatial images from EEG signals; 149-dimensional feature vectors from EEG and GSR; and eye-tracking fixation/saccade metrics, combined with classifiers such as XGBoost [Reference Ayoub, Avetisian, Yang and Zhou24], CNN [Reference Choo and Nam33], quadratic discriminant analysis (QDA) [Reference Akash, Hu, Jain and Reid34] and RF [Reference Lu and Sarter35, Reference Wang, Hou, Ma and Hong36] in diverse scenarios including the SYStem monitor (SYS) sub-task of Air Force Multi-Attribute Task Battery (AF-MATB), driving takeover tasks, unmanned aerial vehicle (UAV) control and human–agent monitoring tasks, with reported accuracies ranging from 71.9% to 92.97%. Notably, while low-interpretability models such as CNN have been applied to trust discrimination, their performance does not necessarily surpass that of traditional machine learning methods with high interpretability, such as LR, and they often require substantial computational resources and large datasets, limiting their real-time applicability [Reference Zhang, Yang, Chen, Li, Zang and Qu8]. Overall, most existing trust discrimination models exhibit accuracies below 80%, and there remains a lack of solutions that combine high interpretability with precision, particularly in aviation contexts where online trust monitoring based on sensitive features remains a critical research focus.
1.2 Research objective
Based on the background and requirements outlined above, this study aims to explore HAT-sensitive physiological features and construct a model to discriminate HAT levels. A simulated aviation monitoring and takeover task was designed with a 2 (reliability) × 2 (transparency) factorial structure. Two distinct HAT conditions, High HAT (HHAT) and Low HAT (LHAT), were classified based on their Jian scale scores. Subsequently, the paired t-test method was used to systematically analyse the HAT-sensitive features in five types of physiological signals: fNIRS, EEG, eye tracking, facial expression and ECG. Finally, HAT discrimination models with varying interpretability were developed using the identified features. Following this, six hypotheses were proposed:
Hypothesis 1 (H1): A significant difference in EEG
 $\alpha$
-band power exists between LHAT and HHAT levels.
Hypothesis 2 (H2): A significant difference in fNIRS HbO concentration exists between LHAT and HHAT levels.
Hypothesis 3 (H3): A significant difference in eye-tracking fixation metrics exists between LHAT and HHAT levels.
Hypothesis 4 (H4): A significant difference in facial micro-expression features exists between LHAT and HHAT levels.
Hypothesis 5 (H5): A significant difference in ECG-derived HRV exists between LHAT and HHAT levels.
Hypothesis 6 (H6): A high-interpretability discrimination model constructed based on HAT-sensitive physiological features can achieve an accuracy exceeding 80% in distinguishing between high and low HAT levels.
2.0 Methods
2.1 Experimental design
This study aims to explore physiological features sensitive to HAT and achieve effective discrimination. Given the theoretical ambiguity surrounding HAT’s definition and formation, it is important to note that the focus of this study is not limited to HAT itself, but rather on the HAT-related state, which is manipulated through the factors of reliability and transparency. Throughout the manuscript, the term ‘HAT state/level’ refers specifically to this HAT-related state. In the experimental design, HAT level was treated as the independent variable, while the measured physiological features served as dependent variables. The HAT levels were operationalised through LHAT and HHAT scenario configurations in a simulated aviation monitoring and takeover task, which followed a 2 (reliability: low, high) × 2 (transparency: low, high) factorial design, resulting in four experimental conditions: low reliability–low transparency, low reliability–high transparency, high reliability–low transparency and high reliability–high transparency. The HAT levels were classified based on the Jian scale scores obtained from these four conditions. Furthermore, feature analysis was conducted on five categories of physiological measurements collected under different HAT levels: EEG, fNIRS, eye tracking, facial expression analysis and ECG.
2.2 Participants
This study recruited 24 participants (16 males, 8 females; mean age = 26.4 ± 5.13 years, range = 19–37) from the International Innovation Institute of Beihang University. All participants were right-handed, had normal or corrected-to-normal vision, were in good general health and had no history of neurological disorders. They were also required to have adequate sleep within 24 h prior to the experiment. The study strictly complied with the ethical principles of the Declaration of Helsinki (https://www.wma.net/policies-post/wma-declaration-of-helsinki/) and was approved by the Biomedical and Medical Ethics Committee of Beihang University (Approval No.: BM20240285). Before participation, all individuals were fully informed about the experimental procedures and precautions and provided written informed consent.
2.3 Experimental platform and tasks
HAT experiments were conducted in a simulated aviation operational environment using the Multi-Attribute Task Battery II (MATB-II) platform [Reference Santiago-Espada, Myer, Latorella and Comstock37, Reference Sato, Jackson and Yamani38]. The experimental stimuli were presented on a 27-inch AOC Q27G3Z/D monitor with a resolution of 1920 × 1080 pixels. Participants interacted with the system through a flight joystick and a mouse, and the specific configuration illustrated in Fig. 1.
This experiment involved a simulated aviation monitoring and takeover task comprising three core subtasks: system monitoring (SYS), takeover and flight (TAK) and resource regulation and pump monitoring (RES), as illustrated in Fig. 2. In the SYS subtask, participants were required to continuously monitor the status of four gauges within the SYS area. Under normal conditions, the indicator values remained within an acceptable range; however, when they entered abnormal zones (the upper or lower three segments), participants were instructed to click the mouse to restore normal values. In the TAK subtask, the aircraft initially operated in autopilot mode. When specific conditions triggered autopilot disengagement, the takeover warning system (TWS) issued a five-second voice alert in advance, prompting participants to decide whether to initiate manual takeover by pressing the trigger button on the joystick, followed by adjusting the aircraft’s attitude through manual control. The RES subtask required continuous monitoring of fuel consumption. When a pump malfunction occurred (indicated in red), participants were required to left-click the mouse to repair it while dynamically adjusting the on/off states of pumps 1–8 to maintain the fuel levels in main Tanks A and B within safe limits.
Overview of operation and measurement devices in experimental platform.

Figure 1. Long description
A person is seated at a desk with a computer setup, wearing a headset equipped with multiple sensors and wires. The computer screen displays a task interface. Various measurement and operation devices are labeled around the image. The labels include EEG, fNIRS, eye-tracking, ECG, and facial expression for measurement, and task display, mouse, pad, and flight joystick for operation. The person is interacting with the computer using a mouse and other input devices. The setup appears to be part of an experimental platform designed to monitor and measure different physiological and cognitive responses.
Task display and subtask operation area (area of interest) layout.

Figure 2. Long description
The cockpit interface features a multi-attribute task battery with several sections. The top section includes system monitoring, tracking, and scheduling. The system monitoring section displays various system status indicators. The tracking section is labeled ‘TAK’ and includes a central crosshair. The scheduling section shows a vertical bar graph. Below these sections, there are communications, resource management, and pump status displays. The communications section lists call signs and frequencies. The resource management section shows flow rates and pump statuses. The background includes visual elements such as a thunderstorm, wind shear, and a bird flock, indicating potential hazards.
2.4 EEG equipment and related features
Physiological measurement devices include EEG, fNIRS, eye tracking, facial expression and ECG.
2.4.1 EEG devices and related features
EEG signals were recorded from 18 electrode sites (FP1, FP2, F7, F3, F4, FZ, F8, C3, C4, CZ, M1, M2, P7, P3, PZ, P4, P8, VEO) using a Neuroscan okti amplifier (Compumedics Ltd., Victoria, Australia). The system employed Ag/AgCl electrodes and was configured with a recording bandwidth of 0.1 to 200 Hz and a sampling rate of 1000 Hz, using GND as the ground electrode and REF as the online reference. EEG data processing comprised two main stages: preprocessing and analysis. The raw signals were first re-referenced to the average of the bilateral mastoid electrodes (M1 and M2). Subsequently, a 1–30 Hz bandpass filter was applied using the EEGLAB 2023.0 toolbox (available at https://sccn.ucsd.edu/eeglab/download/daily/) running on MATLAB R2020a. Independent component analysis (ICA), combined with the Adjust 1.1.1 toolbox (available at https://www.nitrc.org/frs/?group_id=739&release_id=3054), was used to identify and remove artifacts such as eye movements [Reference Mognon, Jovicich, Bruzzone and Buiatti39]. The preprocessed signals were then segmented and subjected to fast Fourier transform (FFT). For frequency-domain analysis, absolute power (in
 $\mu$
V
2) and relative power (%) [Reference Feng, Liu, Wanyan, Chen, Min and Ma40] were computed for the
 $\delta$
(1–4 Hz), theta (
 $\theta$
) (4–8 Hz),
 $\alpha$
(8–12 Hz) and
 $\beta$
(13–30 Hz) frequency bands using 15 electrode sites (excluding M1, M2 and VEO). Relative power for each band was defined as the ratio of its absolute power to the total absolute power across the 1–30 Hz range.
2.4.2 fNIRS devices and related features
Cerebral haemodynamic signals were acquired using the Artinis Brite Lite portable fNIRS system (Artinis Medical Systems B.V., Zetten, The Netherlands). The system was configured in a 2 × 4 eight-channel array comprising four source optodes and four detector optodes, with an inter-optode distance of 3.0 cm to ensure effective penetration of near-infrared light into cortical tissues. Utilising near-infrared spectroscopy at 760 nm and 850 nm, the system recorded changes in haemoglobin concentration at a 100 Hz sampling frequency. Data processing was conducted using the manufacturer’s OxySoft analysis software (Artinis Medical Systems B.V., Zetten, The Netherlands), from which the concentration values of HbO and HbR (in mmol·mm) were extracted from eight predefined channels (R1_T1, R1_T3, R2_T1, R2_T3, R3_T4, R3_T5, R4_T4, R4_T5) for subsequent analysis as physiological features.
2.4.3 Eye-tracking devices and related features
Eye tracking data were recorded in real time using the Tobii Glass III wearable eye-tracking system (Tobii Technology AB, Stockholm, Sweden). The system operated at a sampling rate of 50 Hz with a spatial accuracy better than 0.5 degrees and offered a tracking range of 82 degrees horizontally and 48 degrees vertically. The scene camera resolution was set to 1920 × 1080 pixels with a frame rate of 25 Hz. A one-point calibration procedure was implemented, and adjustable lenses (ranging from 50 to 800 diopters) were provided to participants requiring vision correction to ensure optimal tracking performance. As shown in Fig. 2, the experimental interface was divided into three areas of interest (TAK, RES and SYS). Eye-tracking features were extracted using Tobii Studio 3.4.5 software (Tobii Technology AB, Stockholm, Sweden) and categorised into three types: fixation features, which included the average duration of whole fixations (ADWF), average duration of fixations in the TAK area (ADF.TAK), total duration of fixations in the TAK area (TDF.TAK) and number of fixations in the TAK area (NF.TAK); saccade features, comprising the average amplitude of saccade (AAS), average peak velocity of saccades (APVS) and standard deviation of peak velocity of saccades (SDPVS); and pupillary features, represented by the average whole-fixation pupil diameter (AWFPD).
2.4.4 Facial expression devices and related features
Facial expressions of participants during the task were recorded and analysed using the FaceReader facial expression acquisition and analysis system (Noldus Information Technology, Wageningen, The Netherlands). The system was equipped with a scene camera configured at a resolution of 640 × 480 pixels and a frame rate of 30 fps, and it captured facial muscle Action Unit (AU) activity at a sampling frequency of 5 Hz. The extracted facial expression features comprised seven basic micro-expressions and 20 specific facial AUs. The seven micro-expressions were neutral, joy, sadness, anger, surprise, fear and disgust, with their mean values during the task used for analysis. The 20 selected AUs were as follows: inner brow raiser (AU01), outer brow raiser (AU02), brow lowerer (AU04), upper lid raiser (AU05), cheek raiser (AU06), lid tightener (AU07), nose wrinkler (AU09), upper lip raiser (AU10), lip corner puller (AU12), dimpler (AU14), lip corner depressor (AU15), chin raiser (AU17), lip pucker (AU18), lip stretcher (AU20), lip tightener (AU23), lip press (AU24), lips part (AU25), chin drop (AU26), mouth stretch (AU27) and eye closure (AU43).
2.4.5 ECG devices and related features
ECG signals were continuously recorded from participants using the BioBoX ECG acquisition system (Suzhou Institute of Biomedical Engineering and Technology, Chinese Academy of Sciences, Jiangsu, China) at a sampling rate of 250 Hz. Signal processing and feature extraction were conducted using the SIBET analysis software developed by the same institute. The time-domain features included beats per minute (BPM) and SDNN, while frequency-domain features consisted of low frequency power (LF), total power (TP), low frequency ratio (LF ratio), high frequency ratio (HF ratio), low frequency in normalised units (LF_nu) and the ratio of low frequency to high frequency (LF/HF).
2.5 Procedures
The total duration of the experiment was approximately 120 min, divided into two phases: training and formal testing. The training phase, lasting about 40 min, involved signing informed consent forms, completing a demographic questionnaire, practicing the simulated aviation monitoring and takeover task (participation in the formal experiment was contingent upon passing an assessment) and calibrating the five physiological measurement devices. The formal experiment phase lasted approximately 80 min, beginning with a 1-min resting-state baseline test, followed by four experimental scenarios with varying levels of reliability and transparency. After completing each scenario, participants filled out the Jian scale and took a brief rest to ensure data quality and maintain engagement.
3.0 Results and analysis
Figure 3 presents the three main modules of the results and analysis, outlining the implementation steps for each module. The top layer shows the grouping of HAT levels, progressing from left to right through the development of the platform and tasks to complete the HAT level grouping. The middle layer focuses on the sensitive physiological feature analysis across different HAT levels, with the analysis progressing from top to bottom. The bottom layer illustrates the discrimination model of HAT-related states based on sensitive physiological features, where HAT-related state discrimination is achieved by selecting sensitive features, progressing from left to right.
Overview of data analysis methods and physiological features.

Figure 3. Long description
The diagram presents an overview of data analysis methods and physiological features related to human-automation trust. It is divided into three main sections. The first section, labeled ‘Grouping of HAT levels,’ shows the platform and tasks, physiological measurements, and Jian scores for different HAT levels. The second section, ‘Sensitive Physiological Feature Analysis of Different HAT levels,’ details the analysis tools and processes for fNIRS, EEG, gaze, facial, and ECG features. The third section, ‘Discrimination Model of HAT-related State Based on Sensitive Physiological Features,’ outlines the steps for identifying sensitive features, performing PCA, and building a discrimination model.
3.1 Grouping of HAT statues
Considering the validity of the Jian scale in assessing HAT [Reference Kohn, De Visser, Wiese, Lee and Shaw5, Reference Hoff and Bashir41], this study classified scenarios into LHAT and HHAT conditions based on their Jian scale scores, as illustrated in Fig. 3. Descriptive statistics revealed a progressive increase in Jian scores across the four experimental scenarios: low reliability–low transparency (12.65 ± 12.53), low reliability–high transparency (13.08 ± 14.20), high reliability–low transparency (28.63 ± 11.92) and high reliability–high transparency (35.21 ± 8.97). Current definitions of HAT remain inconsistent, with over 50 distinct definitions reported in the literature [Reference Campagna and Rehm7, Reference Billings, Schaefer, Llorens and Hancock42]. Previous research has identified system transparency and reliability as key predictors of HAT [Reference Eloy, Doherty, Spencer, Bobko and Hirshfield16, Reference Hussein, Elsawah and Abbass43], with HAT levels generally increasing as these factors improve. In addition, several models and frameworks have been proposed by researchers to explain the formation mechanisms of HAT, incorporating these two important factors [Reference Hancock, Kessler, Kaplan, Brill and Szalma44, Reference Li, Wu, Huang and Luan45]. Building on these prior frameworks, the present study adopts an operational definition of HAT levels grounded in transparency and reliability and empirically validates this definition through measurement. To minimise label noise, the low reliability–low transparency scenario, which yielded the lowest Jian scores, was categorised as the LHAT condition, while the high reliability–high transparency scenario, associated with the highest scores, was classified as the HHAT condition. A paired samples t-test confirmed that Jian scores under the LHAT condition were significantly lower than those under the HHAT condition (t(23) = −9.067, p < 0.001). These results collectively support the validity of the two-scenario HAT grouping approach adopted in this study.
Furthermore, no significant differences were observed between LHAT and HHAT conditions in attentional demand scores (3D SART scale [Reference Taylor46]) or mental workload scores on the 0–10 scale (LHAT: 5.03 ± 2.19, HHAT: 4.58 ± 2.67, t(23) = 1.359, p > 0.05; LHAT: 4.43 ± 1.47, HHAT: 4.00 ± 1.82, t(23) = 1.64, p > 0.05), suggesting that, within the present design, attentional demand and mental workload do not explain the observed physiological differences between HAT conditions. In a subsequent analysis, a 2 (reliability) × 2 (transparency) two-way repeated-measures analysis of variance (ANOVA) was conducted. The analysis revealed no significant reliability × transparency interaction effects on the total scores of the Jian scale (p > 0.05). Further, a significant main effect of reliability was observed, with significantly higher trust scores under high-reliability conditions, F(1, 22) = 55.733, p < 0.001,
 $\eta$
p
2 = 0.717. The main effect of transparency was marginally significant, with trust scores tending to be higher under high-transparency conditions, F(1, 22) = 4.132, p = 0.054,
 $\eta$
p² = 0.158. These findings provide insights into how transparency and reliability influence HAT levels in this experiment. The decision to collapse the conditions into LHAT and HHAT was made to facilitate physiological state differentiation while ensuring alignment with statistically validated trust drivers. This approach prioritises HAT-related state differentiation, while preserving the underlying experimental manipulations of reliability and transparency.
3.2 Sensitive physiological feature analysis of different HAT levels
This section conducts a sensitive physiological feature analysis across different modalities, aiming to validate the physiological features associated with H1–H4 and to further explore additional candidate indicators. For EEG data, electrode placements in two brain regions (central: C3, Cz, C4; parietal: P3, Pz, P4), which are closely associated with HAT-related states, were selected for analysis [Reference Zhang, Yang, Chen, Li, Zang and Qu8]. In addition, laterality is commonly used to examine differences among left, middle and right hemispheric activities [Reference Trapsilawati, Herliansyah, Nugraheni, Fatikasari and Tissamodie47, Reference Wanyan, Zhuang, Lin, Xiao and Song48]. Accordingly, three lateralities were defined: left (C3, P3), middle (Cz, Pz) and right (C4, P4). Based on this framework, the absolute and relative power of four EEG frequency bands (
 $\delta$
,
 $\theta$
,
 $\alpha$
and
 $\beta$
) were analysed using a 2 (HAT condition: LHAT vs. HHAT) × 2 (brain region: central vs. parietal) × 3 (laterality: left, middle, right) repeated-measures ANOVA. Mauchly’s test was used to assess sphericity, and when the assumption was violated, the Greenhouse–Geisser correction was applied. Post hoc multiple comparisons were adjusted using the Bonferroni method [Reference Armstrong49]. For fNIRS, eye-tracking, facial expression and ECG features, paired-sample t-tests were conducted for the hypothesis-driven (confirmatory) features related to H2–H4. For exploratory features, those showing significant differences in the paired t-tests were further subjected to Bonferroni-corrected multiple comparisons to control for Type I error.
3.2.1 Analysis of EEG features
Figure 4 presents topographic maps displaying the descriptive visualisation of absolute power across four EEG bands for all participants. Warmer colours (red) indicate higher activation at corresponding electrode sites, while cooler colours (blue) represent lower activation. Repeated-measures ANOVA results showed no significant interaction effects of absolute power (ps > .05). Moreover, the main effect of the HAT condition on absolute power in four waves was also not significant (ps > .05).
Descriptive visualisation of four EEG absolute power under different HAT levels.

Figure 4. Long description
A heat map displays EEG absolute power under different human-automation trust levels. The map is divided into two main sections labeled LHAT and HHAT, each containing four subplots representing different frequency bands: delta, theta, alpha, and beta. The color scale on the right ranges from blue to red, indicating varying levels of absolute power in microvolts squared. In the LHAT section, the delta band shows a gradient from blue to green, the theta band transitions from green to red, the alpha band is predominantly red, and the beta band shows a mix of blue and green. In the HHAT section, the delta band is mostly blue, the theta band shows a gradient from blue to green, the alpha band transitions from green to yellow, and the beta band is predominantly blue. The heat map illustrates the distribution and intensity of EEG power across different frequency bands and trust levels.
As illustrated in Fig. 5, the EEG topographic maps provide a descriptive visualisation of relative spectral power for the four bands. As for
 $\delta$
relative power, the main effect of the HAT condition is also significant; the LHAT condition shows significantly lower
 $\delta$
than the HHAT condition (p = 0.020). As for
 $\alpha$
relative power, there are significant interaction effects found in the HAT condition × region × laterality (F(1.566, 36.027) = 4.153, p = 0.032,
 $\eta$
2 = 0.153). Simple effect analysis showed that in the central brain region, the
 $\alpha$
relative power of the HAT condition is significantly higher than the HHAT condition in midline (p = 0.048), and right laterality (p = 0.009); the main effect of the HAT condition is also significant, the LHAT condition shows significantly higher
 $\alpha$
than the HHAT condition (p = 0.033). The results are shown in Table 1.
Descriptive visualisation of four EEG relative power under different HAT levels.

Figure 5. Long description
The heat map shows relative power percentages of EEG signals across four frequency bands: delta, theta, alpha, and beta, under different HAT levels. The map is divided into two rows labeled LHAT and HHAT, each containing four circular plots corresponding to the frequency bands. The color scale on the right ranges from blue to red, indicating lower to higher relative power percentages. In the LHAT row, the delta band shows moderate power with a mix of blue and green, the theta band displays high power with a central red region, the alpha band exhibits very high power with widespread red, and the beta band shows moderate to high power with a mix of blue, green, and red. In the HHAT row, the delta band shows moderate power with a mix of blue and green, the theta band displays high power with a central red region, the alpha band exhibits very high power with widespread red, and the beta band shows moderate to high power with a mix of blue, green, and red. The plots indicate variations in neural activity under different HAT levels, with higher power in the theta and alpha bands being particularly notable.
ANOVA results of relative power under different HAT levels

Table 1. Long description
The table presents ANOVA results of relative power under different HAT levels, focusing on four waves: delta, theta, alpha, and beta. It includes statistical values for three conditions: Region x Laterality x HAT condition, Region x HAT condition, Laterality x HAT condition, and HAT condition. Each wave has corresponding F-values, p-values, and eta-squared (η²) values. Notable trends include significant p-values for alpha waves in the Region x Laterality x HAT condition and HAT condition, indicating interactions and main effects. The table provides a detailed comparison of these statistical measures across different conditions and waves.
Note: *indicate p < 0.05.
3.2.2 Analysis of fNIRS features
Figure 6 illustrates the descriptive results of HbO and HbR across eight channels under different HAT levels. Subsequent paired t-tests revealed no statistically significant differences in these fNIRS features between high and low HAT levels (ps > 0.05).
fNIRS features under different HAT levels. Error bars represent standard deviation (SD); the same convention applies to the subsequent figures.

Figure 6. Long description
The box-and-whisker plot compares facial expression analysis metrics across different categories, showing data distribution and variability. The plot features multiple vertical box plots, each representing a different category. The x-axis lists category labels such as O21b_RT1, O21b_RT3, O21b_RT5, and so on, while the y-axis represents the range of values from negative fifty to sixty. Each box plot includes a box, whiskers, and outliers. The boxes indicate the interquartile range (IQR) with the lower quartile (Q1) and upper quartile (Q3), while the whiskers extend to the minimum and maximum values. The median (Q2) is marked by a line within each box. Outliers are shown as individual points beyond the whiskers. The plot uses two colors, light blue for L H A T and light orange for H H A T, to differentiate between data sets. The error bars represent standard deviation (SD). The data shows variability in facial expression metrics across different categories, with some categories exhibiting wider spreads and others showing more concentrated values. All values are approximated.
3.2.3 Analysis of eye-tracking features
Descriptive results for eye-tracking features, specifically fixation, saccade and pupillary response, are presented in Fig. 7.
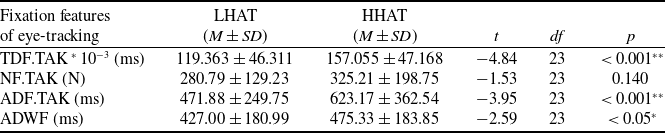
Paired t-tests revealed that, compared to the HHAT condition, the LHAT condition was associated with significantly shorter durations in the following features: TDF.TAK, ADF.TAK and ADWF (ps < 0.05), as detailed in Fig. 7 and Table 2. Furthermore, for the exploratory features not involved in H3 (i.e. AAS, APVS, SDPVS and AWFPD), Bonferroni-corrected comparisons indicated no significant differences (ps > the adjusted threshold of 0.0125).
3.2.4 Analysis of facial expression features
Descriptive results for the seven categories of micro-expressions and 20 AUs are presented in Figs. 8 and 9. Subsequent paired t-tests indicated no statistically significant differences in these facial expression features across different HAT levels (ps > 0.05).
Paired t-test results of typical fixation features under different HAT levels

Table 2. Long description
The table presents paired t-test results of typical fixation features under different HAT levels. It includes data for LHAT and HHAT conditions across four features: TDF.TAK, NF.TAK, ADF.TAK, and ADWF. Each feature is measured in milliseconds and includes mean, standard deviation, t-value, degrees of freedom, and p-value. Notable trends include significantly shorter durations for TDF.TAK, ADF.TAK, and ADWF in the LHAT condition compared to the HHAT condition, with p-values less than 0.05. The table highlights these statistical differences and their significance.
Note: **indicate p < 0.001; *indicate p < 0.05.
Descriptive results of eye-tracking features under different HAT levels. The p-values and asterisks (*) indicate features showing significant differences in paired t-tests. The same convention applies to the subsequent figures.

Figure 7. Long description
The bar graph compares eye-tracking features under different HAT levels, with significant differences indicated by p-values and asterisks. The x-axis lists features such as ADF TAK, NF TAK, ADWF TAK, AAS times 100, APVS times 2, SDPVS times 5, and AWFPD times 100. The y-axis measures values ranging from 0 to 1200. Two data series are represented: L HAT in blue and H HAT in brown. Each bar shows mean values with error bars indicating variability. Notable trends include higher values for AAS times 100 and SDPVS times 5 in both L HAT and H HAT. Significant differences are marked with p-values less than 0.001 and 0.005. All values are approximated.
Descriptive results of the mean values of micro-expressions under different HAT levels.

Figure 8. Long description
The bar graph compares the mean values of micro-expressions under different HAT levels, categorized into LHAT and HHAT conditions. The x-axis represents different emotional states: Neutral, Joy, Sadness, Anger, Surprise, Fear, and Disgust. The y-axis represents the mean values of micro-expressions, ranging from negative 0.05 to 0.35. The graph features two sets of bars for each emotional state, one in blue representing LHAT and the other in orange representing HHAT. The bars for Neutral and Sadness show higher values compared to other emotions, with LHAT and HHAT conditions having similar values. Joy, Anger, Surprise, Fear, and Disgust show lower and similar values for both LHAT and HHAT conditions. Error bars indicate the variability of the data. All values are approximated.
3.2.5 Analysis of ECG features
Descriptive results of ECG features under different HAT levels are presented in Fig. 10.
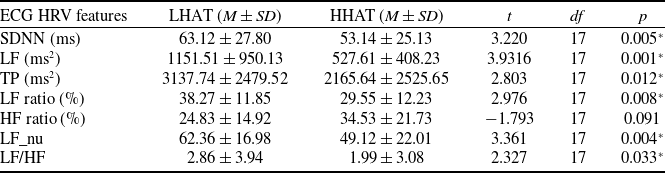
Paired t-tests revealed that, compared to the HHAT condition, the LHAT condition showed significantly increased values in SDNN, LF power, TP, LF ratio, LF_nu and LF/HF (ps < 0.05), as summarised in Table 3. Due to electromagnetic interference and electrode gel conductivity issues, eight ECG data points were abnormal or missing, reducing degrees of freedom. For the exploratory features not involved in H4 (i.e. BPM), Bonferroni-corrected comparisons indicated no significant differences (p > 0.05).
Descriptive results of AUs under different HAT levels.

Figure 9. Long description
The bar graph compares two data series, L H A T and H H A T, across various categories. The x-axis represents categories numbered from 1 to 43, while the y-axis measures values ranging from negative 0.05 to 0.25. Each category features two vertical bars, one for L H A T in blue and one for H H A T in orange. The bars include error bars indicating variability. Notable trends include higher values for L H A T in categories 4, 5, 6, 25, 26, and 43, while H H A T shows higher values in categories 1, 2, 10, 12, 14, 15, 17, 18, 20, 23, 24, 27, and 43. The graph highlights differences in values between the two data series across the categories. All values are approximated.
Descriptive results of ECG features under different HAT levels.

Figure 10. Long description
The bar graph compares ECG features under different HAT levels, showing two data series, L H A T and H H A T, across various metrics with statistical significance indicated. The x-axis lists metrics such as B M P, S D N N, L F aster 0.05, T P aster 0.01, L F ratio, H F ratio, L F nu, and L F H F aster 20. The y-axis represents values ranging from negative 20 to 200. Each metric has two bars, one for L H A T in blue and one for H H A T in orange, with error bars indicating variability. Statistical significance is noted above some metrics with p-values such as p equals 0.005, p equals 0.001, p equals 0.012, p equals 0.008, p equals 0.0037, and p equals 0.033. The graph highlights differences in ECG features under different HAT levels, with notable variations in metrics like B M P, S D N N, and L F nu. All values are approximated.
3.3 Discrimination model of HAT based on sensitive physiological features
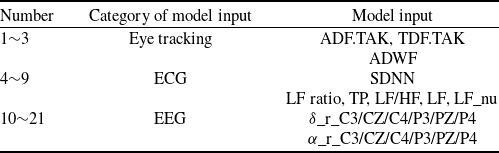
Physiological features showing significant differences between LHAT and HHAT levels in paired t-tests or repeated-measures ANOVA were identified as sensitive features as candidate HAT-sensitive features for interpretative analysis. Based on these analyses, 21 statistically significant features were selected as model inputs (see Table 4). These features were identified prior to model training, were not selected within the cross-validation procedure and remained fixed throughout the entire modeling process as inputs to supervised learning algorithms.
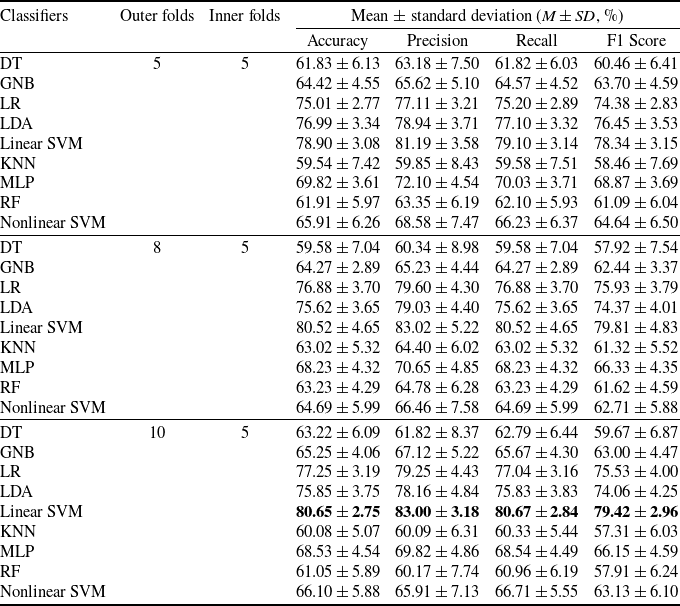
The data preprocessing pipeline included z-score standardisation and principal component analysis (PCA), retaining components that accounted for over 95% of the cumulative variance. All preprocessing steps were strictly implemented within a nested cross-validation framework using training folds only via a pipeline structure, ensuring that no information from the test data was used during model training. The selected features were treated as fixed inputs and were not re-selected, re-weighted or updated within any cross-validation folds. Therefore, no information from the test folds was used in model training, and no data leakage occurred during the machine learning process. Subsequently, nine classifiers from the Python sklearn library were employed for trust-sensitive discrimination: decision tree (DT), Gaussian naive Bayes (GNB), LR, LDA, KNN, multilayer perceptron (MLP), RF and support vector machine (SVM) with both linear and nonlinear kernels [Reference Feng, Liu, Wanyan, Dang, Wang and Qian50]. The first group of classifiers (DT, GNB, LR, LDA, linear SVM) were selected for their high interpretability, whereas the latter four classifiers (KNN, MLP, RF, nonlinear SVM) were characterised by lower interpretability. The model training and evaluation protocol was implemented using a nested cross-validation framework. Specifically, (1) optimal hyperparameters were identified via inner five-fold cross-validation; (2) classification performance was evaluated on outer test folds (five-fold, eight-fold and ten-fold) using accuracy, precision, recall and F1-score; (3) performance metrics were averaged across folds and (4) the entire procedure was repeated 20 times with different random seeds to obtain robust estimates. As summarised in Table 5, the interpretable linear SVM classifier achieved the best HAT discrimination performance, with an accuracy of 80.65% and an F1-score of 79.42%.
Paired t-test results of typical HRV features under different HAT levels

Table 3. Long description
The table presents paired t-test results of heart rate variability features under two different head-up tilt test levels, LHAT and HHAT. It includes seven rows of data for each feature: SDNN in milliseconds, LF power in milliseconds squared, TP in milliseconds squared, LF ratio in percentage, HF ratio in percentage, LF_nu in percentage, and LF/HF ratio. Each row lists the mean and standard deviation for both LHAT and HHAT conditions, followed by the t-value, degrees of freedom, and p-value. Notable trends include significantly higher values in the LHAT condition for SDNN, LF power, TP, LF ratio, LF_nu, and LF/HF, all with p-values less than 0.05. The table highlights the statistical differences between the two conditions, indicating increased heart rate variability features under LHAT.
Note: *indicate p < 0.05.
Input features for supervised learning models

Table 4. Long description
The table presents physiological features identified as significant differences between LHAT and HHAT levels through paired t-tests or repeated-measures ANOVA. These features are categorized into three groups: eye tracking, ECG, and EEG. The eye tracking category includes three features with model inputs ADF dot TAK, TDF dot TAK, and ADWF. The ECG category includes six features with model inputs SDNN and LF ratio, TP, LF, HF, LF dot LF, LF dot LF nu. The EEG category includes twelve features with model inputs delta underscore C3, CZ, C4, P3, PZ, P4 and alpha underscore C3, CZ, C4, P3, PZ, P4. Each row lists the number, category, and specific model input, providing a comprehensive overview of the selected features used in the modeling process.
Note: ** and * indicate p < 0.001 and p < 0.05, respectively.
The discriminative performance of typical classifiers

Table 5. Long description
The table presents the discriminative performance of nine classifiers using different evaluation metrics. The classifiers include decision tree (DT), Gaussian naive Bayes (GNB), logistic regression (LR), linear discriminant analysis (LDA), linear support vector machine (Linear SVM), k-nearest neighbors (KNN), multilayer perceptron (MLP), random forest (RF), and nonlinear support vector machine (Nonlinear SVM). The performance metrics include accuracy, precision, recall, and F1 score, with mean and standard deviation values provided for each classifier across different outer and inner folds. The table highlights the best-performing classifier, which is the linear SVM with an accuracy of 80.65% and an F1 score of 79.42%.
4.0 Discussion
To identify HAT-sensitive physiological features and accurately discriminate between high and low HAT levels, this study designed a simulated aviation monitoring and takeover task based on a 2 (reliability) × 2 (transparency) factorial design. High and low HAT levels were classified according to their Jian scale scores under different task scenarios, and paired t-tests confirmed significantly lower scores in the LHAT condition than in the HHAT condition. Statistical analyses of five categories of physiological signals, including fNIRS, EEG, eye tracking, facial expression and ECG, revealed that the LHAT condition, relative to HHAT, was associated with significant increases in EEG
 $\alpha$
relative power, decreases in
 $\delta$
relative power, shorter eye-tracking metrics such as ADWF, ADF.TAK and TDF.TAK and elevated ECG metrics including SDNN, LF/HF and LF ratio. Using these HAT-sensitive physiological features, a highly interpretable linear SVM model was constructed for HAT classification, achieving a discrimination accuracy of 80.65% and an F1-score of 79.42%. These results demonstrate that the fusion of multimodal physiological features can effectively support the objective identification of HAT levels in aviation environments.
Experimental results demonstrated that EEG
 $\alpha$
relative power under LHAT was significantly higher than under HHAT, thereby supporting H1. This finding aligns with results reported by Blais et al.in a coin toss game [Reference Blais, Ellis, Wingert, Cohen and Brewer14], but contrasts with observations in simulated automated driving tasks [Reference Seet, Harvy, Bose, Dragomir, Bezerianos and Thakor12], decision-making scenarios involving automatic versus manual control [Reference Oh, Seong, Yi and Park10], word elicitation studies [Reference Oh, Seong, Yi and Park11] and scaffolding design and rectification tasks [Reference Chen and Chan13]. Elevated
 $\alpha$
activity is generally associated with a state of relaxed alertness and the active suppression of task-irrelevant external stimuli [Reference Bonnefond and Jensen51, Reference Risqiwati, Wibawa, Pane, Yuniarno, Islamiyah and Purnomo52]. Under distrust conditions, however, the brain may recruit additional cognitive resources to process uncertainty, suggesting that increased
 $\alpha$
power reflects efforts to maintain focus on primary tasks while suppressing interference induced by distrust. Additionally,
 $\delta$
relative power was significantly lower under LHAT compared to HHAT.
 $\delta$
waves are thought to be associated with deep relaxation or unconscious states [Reference Frohlich, Toker and Monti53], whereas distrust might involve heightened alertness or anxiety, which could activate stress-related neural pathways and potentially suppress
 $\delta$
activity. Although these findings suggest that both
 $\alpha$
and
 $\delta$
relative power are sensitive to variations in HAT-related status, previous research has also highlighted that
 $\alpha$
and
 $\delta$
reflect multiple overlapping processes, including workload, vigilance, attentional disengagement and inhibitory control. Therefore, the relationship between these measures and HAT remains to be further explored. At the regional level, central electrodes (C3/CZ/C4), which are associated with emotional processing and conflict monitoring, and parietal sites (P3/PZ/P4), which are involved in spatial attention and sensory integration, were implicated in HAT-related cognitive processes, providing neural insights into the underlying mechanisms. In contrast, no significant differences in fNIRS HbR or HbO concentrations were observed between LHAT and HHAT, resulting in the rejection of H2. This result diverges from findings in non-driving tasks during highly automated driving [Reference Perello-March, Burns, Woodman, Elliott and Birrell15], crime mapping tasks [Reference Eloy, Doherty, Spencer, Bobko and Hirshfield16], image classification tasks with an AI teammate [Reference Bandara, Liao, Chowdhury and Abbott17] and collaborative tasks with a UR10 robot [Reference Hopko and Mehta18]. These discrepancies may be attributed to contextual differences across experimental setups; nevertheless, the present findings offer new insights into trust assessment from an fNIRS perspective.
Additional analyses were conducted on eye tracking, facial expression and ECG signals under high and low HAT levels. Supporting H3, eye-tracking metrics, including ADWF, ADF.TAK and TDF.TAK, exhibited significant sensitivity to different HAT levels, with all three fixation metrics being significantly shorter under LHAT compared to HHAT. This pattern may stem from operators frequently shifting visual attention between critical takeover areas and other monitoring points under distrust conditions, coupled with the exclusively auditory alerts delivered by the TWS in this experiment, which distracted their visual attention. Although these findings differ from several previous studies reporting increased fixation duration and frequency under distrust [Reference Yi, Cao, Song, Wang, Zhao, Guo and Cao29, Reference Krausman, Neubauer, Forster, Lakhmani, Baker, Fitzhugh, Gremillion, Wright, Metcalfe and Schaefer54, Reference Wang, Fang, Qiu and Wang55], as well as from results of a UAV target identification task [Reference Lu and Sarter20] where fixation behaviour showed no significant variation across reliability levels, they provide new and actionable eye-tracking features for HAT classification in comparable scenarios. In contrast, no significant differences in facial micro-expressions or AUs were detected across HAT levels, leading to rejection of H4. This outcome contradicts the expectation that affective trust breaches often trigger observable negative emotional expressions [Reference Krausman, Neubauer, Forster, Lakhmani, Baker, Fitzhugh, Gremillion, Wright, Metcalfe and Schaefer54] and differs from findings in a bluff game task study [Reference Alzahrani, Nasir, Tayeb, André and Ahmad23], likely due to the formal and high-stakes context of aviation tasks suppressing natural emotional expressivity. For ECG measures, significant increases in SDNN, LF/HF and LF ratio were observed under LHAT relative to HHAT, supporting the acceptance of H5. This finding contrasts with results from a planetary gear assembly task [Reference Zhang, Yadav, Hopko and Mehta21]. A plausible physiological explanation is that distrust triggers a state of alertness or tension, activating the sympathetic nervous system (reflected by elevated LF power and LF/HF ratio) while suppressing parasympathetic activity, leading to an overall increase in HRV as indexed by SDNN.
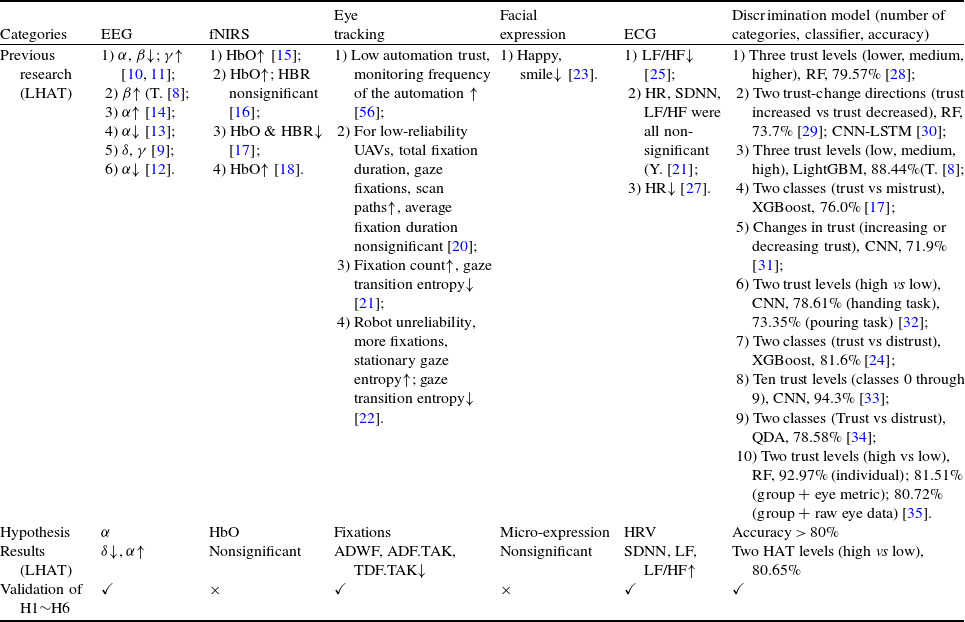
Based on paired t-test results and repeated-measures ANOVA, this study identified physiological features sensitive to HAT. After PCA-based dimensionality reduction, these features were used as input to a supervised machine learning model. Results showed that the linear SVM based on the selected sensitive features achieved an accuracy exceeding 0.80 under nested cross-validation (outer eight-fold or five-fold, inner five-fold), thereby supporting H6. Table 6 summarises the validation outcomes for H6 and related hypotheses, along with comparative results from previous studies and the experimental results. The discriminative performance attained in this study can be attributed to the rigorous selection of sensitive features and the consideration of their relative contributions. By excluding conflicting features during feature selection, the risk of classification confusion was effectively reduced. In terms of algorithm selection, this study differs notably from existing HAT models. Whereas prior studies often employed less interpretable models, such as RF or CNN [Reference Yi, Cao, Song, Wang, Zhao, Guo and Cao29, Reference Chang, Gonzalez Garcia and Hasanzadeh31, Reference Campagna, Chrysostomou and Rehm32], the present results demonstrate that an linear SVM model, characterised by higher interpretability, can also achieve strong performance when supplied with well-selected HAT-sensitive physiological features. This finding offers a feasible direction for implementing trust discrimination in real-world scenarios.
Summary of assumptions and results

By analysing physiological features across different HAT levels and distinguishing between them, this study aims to elucidate the underlying mechanisms of trust degradation and propose feasible prevention and alerting strategies to ensure the safe and efficient accomplishment of aviation-related tasks. The distinctive contributions of this research are presented in three aspects of an explainable ‘output–input–discrimination algorithm’ framework. First, regarding output interpretability, in contrast to previous studies that rarely focused on aviation-specific contexts, this study designed a simulated aviation monitoring and takeover task that incorporated both reliability and transparency considerations. Based on the Jian scale, two distinct HAT levels (HHAT and LHAT) were clearly defined, providing an interpretable labeled basis for subsequent exploration of sensitive features and discrimination. Second, with respect to input interpretability and the exploration of HAT-sensitive features, while existing studies typically limited physiological assessments to three categories [Reference Ajenaghughrure, Sousa and Lamas57] and often failed to clarify the relationship between physiological responses and HAT, this study innovatively employed five physiological categories. The findings revealed that EEG
 $\alpha$
and
 $\delta$
relative power, eye-tracking metrics (such as ADWF, ADF.TAK and TDF.TAK) and ECG metrics (such as SDNN, LF/HF and LF ratio) were sensitive to variations in HAT levels, offering explainable features for a discriminant classifier. Finally, concerning algorithmic interpretability, to address the common limitations of restricted interpretability and prediction accuracy in existing HAT discrimination methods, this study integrated the sensitive features into an LDA model, achieving a discriminative outcome with both high interpretability and accuracy.
However, this study has several limitations. First, as a pilot investigation conducted in a laboratory environment, its findings require further validation in real-world task scenarios, particularly with professional pilots training in high-fidelity flight simulators. Second, given the complexity of defining HAT and its underlying drivers, research should not only focus on HAT itself but also consider the HAT-related state. This study primarily explored cross-modal features of HAT-related states manipulated by reliability and transparency and identified their dynamics. These insights are crucial for refining the operational definition of HAT and advancing both theoretical and empirical research. Future research could explore HAT manipulation more closely aligned with real flight scenarios, defining three or more HAT levels to better uncover the underlying mechanisms linking physiological features to trust dynamics. Furthermore, it should be noted that manipulations of reliability and transparency may still induce variations in other task-related factors, such as workload, monitoring demand and takeover frequency, which are inherent to the characteristics of HAT and may be associated with attentional and cognitive states. Although we measured mental workload and attentional demand in the current experiment to address these potential confounds, future studies should continue to optimise experimental paradigms to more clearly disentangle HAT-related states from other task-related processes. Deeper exploration of HAT-sensitive features, alongside the incorporation of additional labeled data, would facilitate more interpretable trust assessment. Although this study verified the feasibility of using physiological features to evaluate and distinguish HAT levels, future work could integrate other physiological measures, such as GSR and functional magnetic resonance imaging (fMRI), to extend and validate the findings. Additionally, research could investigate optimal combinations of physiological sensors for flight environments, minimal configuration requirements and suitable non-contact approaches, thereby facilitating the translation of laboratory findings to real-time monitoring in operational settings. Finally, subsequent studies should examine different participant groups, including male and female cohorts, as well as populations such as professional pilots, flight cadets and students with an aviation background, to explore potential group differences in physiological features of HAT, while also expanding the sample size and broadening the range of measured physiological features.
5.0 Conclusions
This study classified LHAT and HHAT levels based on Jian scores during a simulated aviation monitoring and takeover task and analysed associated physiological signals to identify HAT-sensitive features across five categories: EEG, fNIRS, eye tracking, facial expression and ECG. A machine learning model incorporating these features was subsequently developed to discriminate between HAT levels. The results indicated that: (1) compared with HHAT, LHAT showed significantly decreased
 $\delta$
relative power and increased
 $\alpha$
relative power in EEG; (2) no significant differences were found in fNIRS HbR and HbO concentrations between HAT levels; (3) the LHAT exhibited significantly shorter durations in eye-tracking metrics, including ADWF, ADF.TAK and TDF.TAK; (4) none of the seven micro-expressions derived from facial analysis showed significant differences across different HAT levels; (5) the highly interpretable linear SVM model integrating these sensitive physiological features achieved a discrimination accuracy of 80.65% and an F1-score of 79.42%. These findings can provide empirical support for real-time HAT assessment based on physiological features, contributing to the mitigation of flight safety risks resulting from inappropriate trust.
Data availability statement
The data presented in this study are available on request from the corresponding author. The data are not publicly available due to privacy concerns.
Acknowledgements
The authors gratefully acknowledge the agencies NSFC, ZPNSFC and RFRPTL for the financial support. In addition, the authors acknowledge the participants for their participation.
Financial support
This research was funded by the National Natural Science Foundation of China (No. 52402507), Zhejiang Provincial Natural Science Foundation of China (No. ZCLMS26E0503), National Natural Science Foundation of China (No. 52272382) and Reward Funds for Research Project of Tianmushan Laboratory (No.TK-2024-D-012).
Competing interests
The authors declare no conflicts of interest.
Author contributions
Conceptualisation, formal analysis, methodology, software, funding acquisition, validation, visualisation and writing – original draft preparation, CY.F.; formal analysis, investigation, methodology, resources, software, validation and writing – review and editing, S.L.; conceptualisation, data curation, funding acquisition, methodology, project administration, resources, supervision and writing – review and editing, XR.WY.; investigation, methodology, software and validation, CY.Q.; investigation, methodology, software and validation, YQ.D.; formal analysis, visualisation, investigation, YR.L.; project administration, funding acquisition, resources, supervision, YM.Z. All authors have read and agreed to the published version of the manuscript.