


Introduction
Glaciers in Patagonia, especially Hielo Patagónico Norte and Sur (HPN and HPS; northern and southern Patagonia icefields) and to a lesser degree the glaciated areas of Tierra del Fuego, have been subject to intensive glaciological and climatological research (Reference Holmlund and FuenzalidaHolmlund and Fuenzalida, 1995; Reference Casassa, Sepúlveda and SinclairCasassa and others, 2002b; Reference Rivera, Acuña, Casassa and BownRivera and others, 2002; Reference Porter and SantanaPorter and Santana, 2003; Reference Rignot, Rivera and CasassaRignot and others, 2003; Reference Strelin and IturraspeStrelin and Iturraspe, in press). Volumetric glacier change studies are rare around both Patagonia and Tierra del Fuego. Most studies only consider the variations of individual glacier tongues (e.g. Reference Casassa, Brecher, Rivera and AniyaCasassa and others, 1997; Reference Naruse, Skvarca and TakeuchiNaruse and others, 1997; Reference Skvarca and NaruseSkvarca and Naruse, 1997; Reference Warren, Rivera and PostWarren and others, 1997; Reference Rivera and CasassaRivera and Casassa, 1999). The only comprehensive study that includes most of HPN and HPS is that of Reference Rignot, Rivera and CasassaRignot and others (2003), which shows a mean annual thinning of 1.0 ±0.1 ma–1 during the period 1968/75–2000. Knowledge of glaciers in Patagonia remains limited for many smaller ice caps and glaciers (Reference Casassa, Smith, Rivera, Araos, Schnirch and SchneiderCasassa and others, 2002a). For southernmost Chile including the Aysén and Magallanes regions, which are the research area of this paper, an overall thinning has been estimated for smaller ice masses during the period 1945–96, ranging between 0.5–1.0ma–1 within the ablation zones and 0.3 ma–1 within the accumulation zones (Reference Rivera, Acuña, Casassa and BownRivera and others, 2002).
Southernmost South America has been subject to a pronounced positive temperature trend of about 0.3 K decade–1 (Reference Rosenblüth, Casassa and FuenzalidaRosenblüth and others, 1995, Reference Rosenblüth, Fuenzalida and Aceituno1997). There are no consistent trends to be found within precipitation data. However, the west coast of southern Patagonia between 51˚S and 55˚S is affected by a decrease in precipitation associated with west wind weather systems during El Niño–Southern Oscillation (ENSO) warm phases (negative Southern Oscillation Index) (Reference Schneider and GiesSchneider and Gies, 2004) due to a weakening of the large-scale pressure gradient between the subtropical high-pressure system over the eastern Pacific and the low-pressure trough over the Bellingshausen Sea.
The aim of this study is to derive the volumetric glacier change of the ice cap Gran Campo Nevado (GCN) during the period 1984–2000 by computing the differences in terrain elevation between two digital terrain models (DTMs) representing the glacier surface elevations at the beginning and at the end of the observed period. This approach partly follows the methods presented by Reference Rignot, Rivera and CasassaRignot and others (2003) who derived the volumetric glacier change of HPN and HPS by comparing temporally different DTM data.
The resulting mean overall glacier change is compared with the results of a degree-day model (DDM) in order to reconstruct the climate forcing responsible for the elevation dependency of the volumetric glacier change. We link this elevation-dependent glacier change to climate variability, which in this case is expressed by specific combinations of minimum temperature and precipitation offsets. These offsets could explain the observed changes when compared with steady-state conditions.
Study Site
Located in southern Chilean Patagonia on the southern part of Penıínsula Muñoz Gamero, the GCN and the associated minor ice bodies that surround the main ice cap form a glaciated area of about 253 km2 (Fig. 1) (Reference Schneider, Schnirch, Acuña, Casassa and KilianSchneider and others, in press b). It is the only major ice cap between the HPS and the Strait of Magellan. The southern Andes between 48˚S and 55˚S form one of the very few topographic barriers for the westerlies of the Southern Hemisphere around the globe. Therefore, the area is subject to some of the world’s most extreme climatic differences between the windward and leeward sides of a mountain range in terms of precipitation. Annual precipitation ranges from about 2000– 4000 mm on the Pacific coast to >10000mm in the summit regions and to <500mm in eastern Patagonia (Reference Cerveny, Hobbs, Lindesay and BridgmanCerveny, 1998; Reference Aceituno, Fuenzalida, Rosenblüth, Mooney, Fuentes and KronbergAceituno and others, 1993; Reference Schneider, Glaser, Kilian, Santana, Butorovic and CasassaSchneider and others, 2003). These large precipitation quantities along the main divide support the perpetual existence of an ice cap down to comparatively low altitudes ranging from 1000 to 1700ma.s.l., with outlet glaciers reaching down to sea level even though the climatic setting of the GCN region is somewhat temperate and characterized by a mean annual temperature of +5.7˚C at sea level (Reference Schneider, Glaser, Kilian, Santana, Butorovic and CasassaSchneider and others, 2003). Due to its small size and therefore short response times, the GCN can reflect recent climatic changes in the southern part of the Andes more rapidly than the far larger ice bodies of HPN and HPS.
Location of the GCN and terrain surface classification of the research area. Coordinates correspond to Universal Transverse Mercator (UTM) zone 18S. AWS is the automated weather station located at Puerto Bahamondes at 28ma.s.l.

Data, Method and Results
Change detection by analysis of DTMs
The terrain situation in 1984 is represented by a 10m grid DTM based on aerial photographs acquired in March 1984. Its original vertical accuracy at single pixels was limited to 35 m (Reference Schneider, Schnirch, Acuña, Casassa and KilianSchneider and others, in press b).
The second DTM represents the terrain surface situation in 2000. It is part of the freely available 90m grid Shuttle Radar Topography Mission (SRTM) dataset acquired in February 2000. Generated from the records of the C-band antenna (wavelength λ = 5.6 cm), the data subset shows a vertical error of distinctly less than 10m at each pixel (Reference RodriguezRodriguez and others, 2005). This nominal relative vertical error of 10m for the C-band is considerably less at 53˚S because vertical error in the SRTM data decreases as the latitude increases (Reference Rabus, Eineder, Roth and BamlerRabus and others, 2003).
Both DTMs were geo-referenced to a uniform 10 m grid. The subtraction of the terrain elevations of the 1984 DTM from those of the 2000 DTM resulted in a systematic spatial distribution of positive and negative elevation differences that suggested a dependency on relief exposition. As this could not be explained by natural processes, there was an obvious need to analyze this systematic error in more detail. Moreover, a two-part analysis of these elevation differences considering, on the one hand, the glaciated areas and, on the other hand, the non-glaciated areas illustrates that the ice masses of the GCN must have been subject to a considerable glacier change between 1984 and 2000. The frequency distribution of the elevation differences within the glaciated areas shows a much broader and more irregular distribution shifted to more negative values than those within the non-glaciated areas (Fig. 2). This obviously indicates that an overall loss of ice volume has occurred.
Histograms of elevation change for glaciated and non-glaciated areas of the GCN.

This finding indicates that the potential systematic error between the two DTMs is masked by additional surface changes on glacier surfaces. Only the non-glaciated areas are characterized by an almost symmetric and strongly centred frequency distribution of elevation differences (Fig. 2). This implies that the observed pattern of elevation differences between the two DTM surfaces could only have been introduced by a systematic error. The irregular changes within the glaciated areas in contrast to the non-glaciated parts must be due to real surface changes. The systematic pattern of the spatial distribution of the elevation differences between the DTMs can be very well described by computing the mean elevation differences of unchanged surfaces (e.g. rock and forest areas) as a function of exposition. The result (Fig. 3) confirms the hypothesis of a systematic error depending on exposition. This error is most probably explained by a minimal geo-referencing error resulting in a minimal displacement of the two DTMs to each other (Reference KääbKääb, 2005). Consequently, the terrain elevations of the 1984 DTM had to be corrected according to this dependency. The empirically derived deviations presented in Figure 3 were approximated by a regression in six different sections composed of both polynomial and sine fits with an explained variance of 89%. Based on this regression analysis, an exposition-dependent correction of the terrain elevations of the 1984 DTM was performed, eliminating the described exposition dependency of the elevation differences (Fig. 3). By now the result of the subtraction of the corrected 1984 DTM from the 2000 DTM showed an altitude dependency of the elevation differences. Hence, a systematic error within the SRTM data comparable with findings by Reference Berthier, Arnaud, Vincent and RémyBerthier and others (2006) must be assumed. This altitude dependency was approximated by a simple linear fit (r2 = 0:60) which was used to correct the SRTM surface. To evaluate the achieved improvement of vertical accuracy, the terrain elevations of all non-glaciated areas of the two DTMs were compared once again. The result indicates a high similarity between the two terrain surfaces. The non-corrected 1984 DTM minus the non-corrected 2000 DTM difference for non-glaciated areas shows a mean of 0.9±40 m. The difference between non-glaciated areas of the corrected DTMs amounts to –0.3±35m (Fig. 2). The given ranges indicate one standard deviation. This result is considered as a successful adaptation of the two DTMs by correcting the systematic errors inherent in both DTMs. The near-zero mean of the histogram (Fig. 2) indicates that a significant systematic elevation offset between the two DTMs after both corrections can be ruled out. Subsequently, it was possible to obtain reliable results of the volumetric glacier changes of the GCN by subtracting the corrected terrain elevations of the 1984 DTM from those of the corrected 2000 DTM.
Mean elevation changes of the non-glaciated terrain surface depending on relief exposition.

The analysis of the volumetric glacier change was performed exclusively for the 199.5 km2 large GCN (Fig. 1) (Reference Schneider, Schnirch, Acuña, Casassa and KilianSchneider and others, in press b). The basic prerequisite for the computation of this volumetric glacier change is the existence of terrain elevations in both DTMs. Hence, it was necessary to omit all areas characterized by missing elevation values. Due to a lack of contrast in the underlying aerial photographs, extensive areas of the 1984 DTM surface had been interpolated. Consequently, these areas had to be treated as missing values because of the insufficient accuracy of their elevation data. In the case of the 2000 DTM, the much smaller areas of missing values are due to the specific method of terrain elevation data acquisition by means of interferometric radar remote sensing. Therefore, missing values correspond to very steep areas where shadow effects, layover and phase unwrapping problems are relevant. Thus the glaciated area where the volumetric glacier changes were derived was limited to 64.4% of the total extent of the GCN. Large gaps in data occur especially in the ice cap’s summit region (Fig. 4). To interpolate these gaps, the relation between the change in elevation of the glacier surface and absolute altitude was analyzed. By classifying the mean elevation change related to 50 m altitudinal intervals, a dependency of glacier surface change on altitude was found (Fig. 5). For its approximation, both a logarithmic and a polynomial fit were considered. The extrapolation of the logarithmic fit down to lower altitudes would have led to an obvious overestimation of ablation (Fig. 5). Therefore the polynomial fit was chosen, even though its variance of r2 = 0.90 is marginally smaller than the variance of the logarithmic fit (r2 = 0.91). From this regression analysis the estimated mean values for the change in surface elevation were obtained for the whole set of terrain elevations (Fig. 6). With the subsequent replacement of all gaps in the data, the volumetric analysis of the glacier changes of the GCN was completed. Subsequently, it was possible to derive the overall volumetric change of the ice cap and its spatial distribution. The results of this analysis serve as a basis for the constraints of possible climate forcing.
Areas of positive (DTM surface 2000 > DTM surface 1984) and negative (DTM surface 2000 < DTM surface 1984) elevation changes of the glacier surface as derived from the comparison of the two DTMs. Gaps resulting from areas of missing values in at least one of the underlying datasets are plotted as grey striped areas. Contour lines are placed at an equidistance of 250 m.

Mean elevation changes of the glacier surface depending on altitude. Data points show error bars of rms error. The plotted lines represent a logarithmic (regression 1) and a polynomial (regression 2) fit to the data.

Glacier surface change computed according to the regression analysis against altitude as presented in Figure 5. Contour lines are placed at an equidistance of 250 m.

A negative mean glacier change of 3.80m on average during the years 1984–2000 was derived for the whole GCN. This corresponds to a mean annual change of -0.35mw.e. when assuming a mean density of glacier ice of 0.9 kgm–3 (Reference PatersonPaterson, 1994). A zone of zero elevation change at ~975ma.s.l. was identified. Below this altitude the data indicate a strongly increasing thinning of the glacier tongues, with decreasing altitude resulting in a massive loss of ice of 12.6 m on average. In contrast to that, above ~975ma.s.l. a thickening of the ice cap was observed which shows a moderate increase with altitude, resulting in a gain of ice of 7.4m on average. On an annual basis, the mean elevation change of the glacier surface approximately ranges between -2.86mw.e. at the lower ends of the outlet glaciers and +0.60mw.e. in the central part of the ice cap. Concerning the ablation areas these results are in reasonable agreement with the estimate presented by Reference Rivera, Acuña, Casassa and BownRivera and others (2002). The thickening of the central parts of the GCN, however, is unique in southernmost Patagonia to our knowledge.
Error analysis regarding DTMs
In order to check whether the elevation differences between the glacier surfaces of 1984 and 2000 are clearly distinguishable from stochastic noise, a Student’s t test was applied to the deviations between the mean differences of both DTMs in general and both the glaciated areas above and below 975 ma.s.l. It was found that the surface change of the glacier cannot be attributed to stochastic noise with a significance level of >99.9%. Consequently, the glacier change of the GCN was accepted as real change.
Error analyses shows an error of 36m for individual elevation differences between the glacier surfaces of the DTMs based on single pixels. However, the rms error over the whole domain is only 0.26 m based on the 90 m grid spacing of the original SRTM data. When each altitudinal interval of 50 m is addressed separately, the rms errors range from 1.0 m at lower altitudes to 3.9 m in the upper parts of the ice cap (Fig. 5). The polynomial fit (Fig. 5) used to approximate the altitudinal variability of the glacier change is characterized by an rms error of 5.3 m. Accordingly, the interpolated values of the glacier change show a much lower accuracy then the non-interpolated values. To assess the overall error of the mean glacier change, the rms errors of non-interpolated areas of each 50 maltitudinal interval and the rms error of the interpolated areas were combined by weighting them according to the number of pixels in each category. This calculation yields an error range of ±2.5mw.e. for the 16 year period. Hence, the annual mean glacier change of the GCN is given by -0.35±0.16mw.e. a–1.
Reference Rignot, Echelmeyer and KrabillRignot and others (2001) report a penetration depth of the radar beam into the snowpack of 1–2 m. In the case of the GCN, where short-term melt events in summer frequently extend up to the summit area, it is reasonable to assume that this value is <1 m, so it was not taken into account in this study. Nevertheless, the penetration depth would add to the observed positive change in elevation in the accumulation area. Since the estimated precipitation offset is considered as a minimal change, this does not affect the general result obtained in this study.
Climate forcing estimated using a DDM
In order to determine the climatic forcing responsible for the observed glacier changes, a set of theoretically derived specific mass-balance gradients using varying combinations of temperature and precipitation offsets were computed by a DDM. DDMs have been studied intensely during recent decades (e.g. Reference BraithwaiteBraithwaite, 1981). Recently, reviews have been presented by Reference OhmuraOhmura (2001) and Reference HockHock (2003). The DDM calculates the ablation M at the surface, based on the positive mean daily air temperature Ti , a degree-day factor f and a stochastic term xi = 0 mmd–1, according to

and

In this equation, f is set to 7.0mmK–1 d–1 for ice surface and 3.5 mmK–1 d–1 for snow surface according to energy-balance measurements on the ice surface of one of the outlet glaciers, Glaciar Lengua, in summer 2000 as described in detail in Reference Schneider, Kilian and GlasserSchneider and others (in press a) and on the basis of long-term measurements at ablation stakes (Table 1). The set of ablation stakes consists of 12m long, flexible, white plastic tubes that were placed into holes drilled using a steam driller. Details of the ablation stake network are presented in Reference Schneider, Kilian and GlasserSchneider and others (in press a). The measurements are in reasonable agreement with the DDM result. Differences are generally within 10%. However, at stake ‘L-up’ the deviations of 38% in 2001 and 15% in 2002 indicate a serious error which may be caused by movement of the stake within the borehole or by some other measurement error. Since the long-term measurements include periods with snow cover it is assumed that taking f for snow surfaces to 50% of f for ice surfaces is an appropriate choice, which is supported by values presented in other studies (e.g. Reference BraithwaiteBraithwaite, 1995).
Comparison of ablation modelled with the DDM and ablation measured at stakes

In order to consider the sensitivity of the DDM to inaccuracies of the degree-day factors, the model runs are additionally performed with f for ice surface set to 6 and 8mmK–1 d–1 and f for snow surface set to 3 and 4 mmK–1 d–1 (see Discussion).
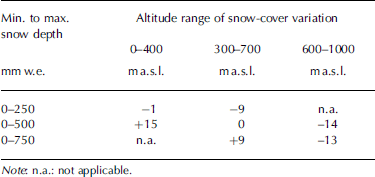
The decrease of air temperature with altitude (–0.63 K (100 m)–1) and the increase of precipitation with altitude (5% (100 m)–1) were set according to measurements at automated weather stations (AWSs) at different altitudes in the years 2000–03. The details on the AWSs and the measurements for the period 2000–02 are presented in Reference Schneider, Glaser, Kilian, Santana, Butorovic and CasassaSchneider and others (2003). As a boundary condition for the start of each model run, a pattern of existing snow cover based on field observations according to Table 2 is assumed. In the course of the model run, this snow cover develops according to ablation and/or solid precipitation with respect to altitude and the meteorological record. Different snow-cover patterns at the start of each model run were considered in order to check the effect on model results (Table 2). The sensitivity of the model to this introduces an error of ±15mmw.e. a–1. The proportion of solid precipitation, SSP, is assumed to vary depending on air temperature T according to
Annual mass-balance differences between DDM runs based on different starting conditions of the snow cover. Each snow pattern shows a specific variability throughout the transition zone between the ablation and accumulation zones. Snow depth is scaled linearly, using six classes between the stated upper and lower limits of altitude and snow depth. The pattern of the chosen model uses a starting snow cover of 0–500mmw.e. that is scaled between 300 and 700ma.s.l.

Equation (2) smoothly scales the proportion of solid precipitation between 100% (0˚C) and 0% (2˚C), as similarly suggested by Reference Hantel, Ehrendorfer and HaslingerHantel and others (2000) for the relation between monthly air temperature and snow-cover duration.
The DDM was extended to a surface mass-balance model for the complete GCN according to the method outlined in Reference Braithwaite and ZhangBraithwaite and Zhang (2000) on the basis of the 2000 DTM. The gaps within the 2000 DTM were replaced by terrain elevation according to the corrected 1984 DTM plus the mean glacier change between 1984 and 2000 (Fig. 6).
The DDM was run using temperature and precipitation records of an AWS named AWS GCN Puerto Bahamondes (Fig. 1) operated approximately 3.5 km from the ice margin at 28ma.s.l. since October 1999 (Reference Schneider, Glaser, Kilian, Santana, Butorovic and CasassaSchneider and others, 2003). The mean air temperature at this station between September 2000 and August 2005 is 5.8˚C, and the mean annual precipitation during the same period amounts to 4780 mm. The mass balance for this period yields a reasonable overall value of –502±15mmw.e. a–1 according to the DDM calculation since a general retreat of the outlet glaciers can be observed. The absolute values of mass balance derived from the DDM are subject to many uncertainties and are not important in the context of this paper. However, systematic variations of precipitation and temperature yield reliable estimates of relative mass-balance changes due to climatic forcing. This makes it possible to quantify the deviation of these variables from steady-state conditions that can explain the observed surface changes. Therefore, the change in mass balance forced by temperature and precipitation offsets was computed by varying both variables stepwise. The resulting matrixes of relative mass balance of DDM runs with f over ice set to 6, 7 and 8mmK–1 show the change in annual mass balance compared with an overall zero mass balance (Fig. 7). These data are compared with the mean annual overall elevation change of the glaciated areas derived from the DTM analysis. Both methods treat the ice cap as a whole and represent a mean glacier change including whatever thinning or thickening might have occurred within it. This means that both types of estimates represent the ice cap as a closed system including dynamic adjustment of the ice body. By interpolating the data within the matrices it was therefore possible to identify all combinations of temperature and precipitation offsets that could have led to the specific magnitudes of glacier change obtained from the DTM analysis (–346±155mmw.e. a–1). This change is represented as bold lines in Figure 7.
Change of mass balance as a function of temperature and precipitation offsets for values of f as 6, 7 and 8mmK–1. Changes are computed in mmw.e. a–1 by adding constant values of temperature and precipitation changes to the input records of the DDM for the period September 2000–August 2005.

Discussion
The response time of the GCN is relatively short due to the high ablation rates near the tongue (Reference Jóhannesson, Raymond and WaddingtonJóhannesson and others 1989). Therefore, we assume that the adjustment of the ice cap to climate variability has no pronounced long-term memory. Most of the effects revealed during the observation period of 16 years are driven by concurrent climate variability because the observation period exceeds the estimated response time. Nevertheless, it cannot be ruled out that the observed changes are partly due to dynamic adjustment to climate variability of the preceding decades.
The elevation dependency of the glacier change and the contrast between absolute gain and absolute loss of ice masses at different altitudes suggest a complex climate-change forcing. To analyze and demonstrate the sensitivity of the ice cap to possible climatic changes, the effects of nine different climate-change scenarios on the glacier body are expressed by the resulting specific mass-balance gradients computed with the DDM (Fig. 8). Figure 8 illustrates that each set of scenarios with equal temperature offsets shows a strong correlation within the ablation zone, and within the accumulation zone a strongly decreasing correlation as altitude increases. Using these sets of scenarios it can be seen that the more positive the underlying temperature offset is, the greater is the correlation within the ablation zone. In marked contrast to that, the sets of scenarios with equal precipitation offsets show a weak correlation within the ablation zone, but an increasing correlation as altitude increases. In the upper parts of the accumulation zone there exists an obvious correlation within each set of scenarios of equal precipitation offsets. Therefore, it could be assumed that the specific mass balance of the lower parts of the ice cap is almost exclusively sensitive to changes in air temperature, and thus ablation. The observed loss of ice in the lower parts could be seen as entirely induced by warming, which in the context of this paper is expressed by a positive temperature offset. Correspondingly, the uppermost parts of the ice cap show a specific mass balance that is prevailingly sensitive to changes in precipitation. Therefore, the observed thickening has to be considered as a result of likewise increasing precipitation expressed by a positive precipitation offset.
Sensitivity of the specific mass-balance gradient of the GCN to different combinations of temperature and precipitation offsets according to Figure 7.

Quantification of the temperature and precipitation offsets firstly requires a consideration of the influence of increased precipitation on the upper central parts of the ice cap. Due to the rather high air temperature, minor snowmelt events frequently occur even at high altitudes. This leads to a fast densification of snow and firn, so that no pronounced interannual differences within the stratification of the snowpack and the overall depth of the snowpack are assumed. Hence, a rise in snow surface elevation is attributed rather to an increase in ice or heavily compressed firn underneath instead of an increase of the snow cover. Moreover, a seasonal effect in snow depth can be ruled out because both datasets were acquired in late summer. Additionally, mean monthly precipitation at the GCN is almost uniformly distributed throughout the year (Reference Schneider, Glaser, Kilian, Santana, Butorovic and CasassaSchneider and others, 2003). Year-to-year variability that adds to ‘real’ long-term changes cannot be ruled out completely although the observed changes are much greater than any reasonable year-to-year change in accumulation of snow.
From the specific mass-balance gradients (Fig. 8) a gain of net accumulation of approximately 1700–2100mmw.e. for a positive precipitation offset of 25% can be derived for these parts of the ice cap. The actual mean gain of ice within these upper sections of the ice cap in the period 1984–2000 amounts to 500–600mmw.e. according to the analysis of elevation differences between the DTMs. By relating these two facts to each other, and by assuming that the thickening in the central parts of the ice cap was caused exclusively by a gain in net accumulation, the equivalent positive precipitation offset amounts to 7–8%. However, this view of glacier change is only applicable as long as the glacier is treated as a static ice body without any inherent flow dynamics. Thus, the additional accumulation of 500–600 mmw.e. has to be treated as a minimum net accumulation required to force glacier change because even in the centre of the ice cap the ice flow had to have thinned the ice masses at least slightly. Therefore, the increase in precipitation during the period 1984–2000 probably slightly exceeded the precipitation offset of 7–8%. The theoretically possible combinations of temperature and precipitation offsets that could have led to the observed mean glacier change of –346±155mmw.e. a–1 as presented in Figure 7 imply that for the same period a temperature trend equivalent to an offset of about 0.3 K must have prevailed. For an overall glacier change of –346±155mmw.e. a–1 the effect of different values for f on the resulting combinations of precipitation and temperature offsets is negligible. Furthermore, the influence of the varying starting conditions of the snow cover (±15mmw.e. a–1) is of minor importance.
The result suggests a climate-change magnitude that corresponds with other findings regarding temperature and precipitation trends in southernmost South America. Air-temperature data from weather stations (Islotes Evangelistas, Punta Arenas Jorge Schythe and Punta Arenas Aeropuerto) located at approximately the same latitude (Fig. 1) show positive trends for the end of the last century of around +0.3 K decade–1. A similar magnitude of warming is given by Reference Rosenblüth, Fuenzalida and AceitunoRosenblüth and others (1997) for Punta Arenas for the second half of the 20th century. Since this study covers a period of 16 years, this increase would be sufficient to produce the effects of a positive temperature offset of about 0.3 K.
The inferred increase of precipitation is also supported by measured data (Reference Rosenblüth, Casassa and FuenzalidaRosenblüth and others, 1995; Reference Casassa, Smith, Rivera, Araos, Schnirch and SchneiderCasassa and others, 2002a). However, in contrast, the prevailing ENSO warm phases since the mid-1970s and the correlation with a decrease of precipitation on the west coast of southern Patagonia at 53˚S could also suggest a negative precipitation trend (Reference Daniels and VeblenDaniels and Veblen, 2000; Reference Schneider and GiesSchneider and Gies, 2004). However, it must be taken into consideration that the influence of the ENSO on precipitation in this part of Patagonia is weak and can easily be masked by other effects, such as a change in the strength of the westerlies (Reference TurnerTurner, 2004). The strength of the westerlies determines the amount of precipitation on the windward side of the Andes because their strengthening would result in an increase of oro-graphically induced precipitation. Reference Marshall, Stott, Turner, Connolley, King and Lachlan-CopeMarshall and others (2004) show that the Southern Annular Mode (SAM) as a measure of the zonal pressure gradient between 40˚S and 60˚S was subject to a positive trend from the mid-1960s until 2000. This implies an increase in the strength or frequency of the westerly winds at these latitudes. Therefore, an increase in precipitation at the end of the last century can most likely be attributed to a strengthening of the westerlies represented by a positive trend of the SAM. Thus, the derived results of a positive temperature offset amounting to about 0.3 K and a positive precipitation offset of 7–8% can be consistently attributed to a moderate warming trend in southernmost South America combined with a positive precipitation trend as reflected in the positive trend of the SAM.
Conclusion
The approach of comparing two genetically and temporally different but structurally comparable DTMs to derive glacier changes methodologically proved to be a successful means of deriving the volumetric change of the GCN from the elevation changes of its glacier surfaces. Overall, the GCN lost about 346±155mmw.e. a–1, with a considerable decrease in volume at lower altitudes and a small increase in volume in the uppermost central parts in the period 1984– 2000. An approach has been introduced to link the mean overall glacier change of the ice cap and its altitudinal variability to climate forcing by the retrograde use of a DDM.
Even though the DDM cannot be calibrated with the available measurements in order to produce reliable absolute values of the mass balance, it makes it possible to derive a set of overall mass-balance changes which refer to varying combinations of temperature and precipitation offsets. By this means the sensitivity of the GCN to changes in temperature and precipitation was derived.
Finally, it can be concluded that the glacier changes of the GCN can in fact be attributed to the combined effects of climate warming and increased precipitation. The overall volume loss was traced back to climate variability comparable to a positive precipitation offset of at least 7–8% and a positive temperature offset of at least about 0.3 K compared with theoretically balanced steady-state conditions. This result is in good agreement with observed climate change in southernmost South America. It is concluded that this approach successfully connects the observed glacier changes of the GCN between 1984 and 2000 with the climate trends prevailing in Patagonia over this period.
Acknowledgements
We thank all members of the various field campaigns that helped to obtain mass-balance and weather data from the GCN in recent years. Comments on the manuscript by R. van de Wal, G. Casassa and an anonymous reviewer are gratefully acknowledged. This study was funded by grant Nos. Schn-680 1/1 and Ki-456/6-1 of the German Research Society (Deutsche Forschungsgemeinschaft: DFG).



