Implications
Linear random regression models (RRM) were used as a new longitudinal approach for genetic evaluation of clinical mastitis data in dairy cattle. This approach has theoretical advantages compared to the method of linear cross-sectional models (CSM) currently used. The estimated genetic parameters and predicted breeding values from the RRM were in good agreement with the results from linear longitudinal multivariate and linear CSM. However, the RRM approach was sensitive to parameter estimation in the current setting.
Introduction
Mastitis is a major problem in the dairy cattle industry because of its serious and negative effects on farm economy and animal welfare. The disease also results in an increased use of antibiotics. It is well known that unfavorable genetic correlations exist between milk production and several fertility and health disorders, including mastitis (e.g. Rauw et al., Reference Rauw, Kanis, Noordhuizen-Stassen and Grommers1998; Heringstad et al., Reference Heringstad, Klemetsdal and Ruane2000; Hinrichs et al., Reference Hinrichs, Stamer, Junge and Kalm2005). Therefore, it is highly relevant to include functional traits, in addition to milk production traits, in the breeding goal. Most of the countries that perform genetic evaluation for mastitis resistance lack records of clinical cases and therefore use indirect measures, such as milk somatic cell count (SCC). In the joint Nordic (Sweden, Denmark and Finland) cattle genetic evaluation (NAV) and in Norway, both indirect and direct measures of the disease are used. Information on treatments of clinical mastitis (CM) is available from veterinary reporting and milk-recording schemes (Interbull, 2008).
For an efficient genetic evaluation of CM, it is important to use the most appropriate methodology and trait definition. The most common current approach is to apply a linear cross-sectional model (CSM) to an all-or-none trait, distinguishing between cows with at least one case of CM (1) and cows without cases (0) within a defined time period covering a large part of the lactation. This approach has some disadvantages, which have been discussed thoroughly by e.g. Heringstad et al. (Reference Heringstad, Chang, Gianola and Klemetsdal2003) and Carlén et al. (Reference Carlén, del Schneider and Strandberg2005 and Reference Carlén, Emanuelson and Strandberg2006). The main problem with a CSM is that available information on multiple cases and time of occurrence are ignored. Further, ongoing and incomplete records, because of culling, cannot be treated properly. Another potential disadvantage with a linear model is that the assumption of normally distributed data is not fulfilled.
Alternatives to the linear CSM for genetic evaluation of CM have been studied. Binary CM data have been analyzed with the theoretically more appropriate threshold CSM (e.g. Kadarmideen et al., Reference Kadarmideen, Thompson and Simm2000; Hinrichs et al., Reference Hinrichs, Stamer, Junge and Kalm2005; Zwald et al., Reference Zwald, Weigel, Chang, Welper and Clay2006). However, this approach is not in routine use and does not use more of the available information than a linear CSM. Survival analysis has been used to analyze time to first CM (Saebø and Frigessi, Reference Saebø and Frigessi2004; Carlén et al., Reference Carlén, del Schneider and Strandberg2005 and Reference Carlén, Emanuelson and Strandberg2006). Compared to CSM, survival analysis uses more of the available information because it considers the timing of the case and properly deals with ongoing and incomplete records. However, in a simulation study by Carlén et al. (Reference Carlén, Emanuelson and Strandberg2006), only marginal differences were observed in correlations between simulated true breeding values and predicted breeding values (PBV) from survival analysis, linear CSM and threshold CSM. Further, survival analysis does not consider multiple cases. Longitudinal multivariate models (LMVM), treat CM measured in defined shorter intervals of lactation as separate but correlated traits, and random regression models (RRM) for CM, on the other hand, would deal with all the above-stated disadvantages of CSM. LMVM and RRM could also model environmental effects, such as lactation stage, and describe genetic variation over time better than CSM. A disadvantage compared to the CSM is the increased number of records to analyze and parameters to estimate (Jensen, Reference Jensen2001). Studies using threshold LMVM to analyze mastitis data concluded that mastitis cannot be regarded as the same trait genetically throughout lactation (Chang, Reference Chang2002; Chang et al., Reference Chang, Gianola, Heringstad and Klemetsdal2004a; Heringstad et al., Reference Heringstad, Chang, Gianola and Klemetsdal2004). Compared to RRM, LMVM are more flexible in capturing differential gene expressions in different parts of lactation because no structure is assumed for the (co)variances among defined traits. However, the often high number of traits requires many more parameters to be estimated (Jensen, Reference Jensen2001).
Random regression models have become increasingly popular for the analysis of longitudinal data, which are repeated records on individuals over time. Applications are numerous but the most common is genetic evaluation of dairy cattle test day records on e.g. milk production and SCC (Schaeffer, Reference Schaeffer2004). To a lesser extent, RRM have also been used for longitudinal binary data, in the context of a linear model for survival data (Veerkamp et al., Reference Veerkamp, Brotherstone, Engel and Meuwissen2001) and a threshold model for fertility (Averill et al., Reference Averill, Rekaya and Weigel2006) as well as for CM (Heringstad et al., Reference Heringstad, Chang, Gianola and Klemetsdal2003; Rekaya et al., Reference Rekaya, Gianola, Weigel and Shook2003; Chang et al., Reference Chang, Gianola, Heringstad and Klemetsdal2004b). According to Veerkamp et al. (Reference Veerkamp, Brotherstone, Engel and Meuwissen2001), RRM for longitudinal binary data can be expected to combine some of the advantages of survival analysis and LMVM.
The aim of this study was to investigate the feasibility and suitability of estimating genetic parameters and predicting breeding values for CM with a univariate linear sire RRM.
Material and methods
Data and trait definition
Data were extracted from the Swedish milk-recording scheme and were edited to include records from first-lactation Swedish Holstein cows with calving dates between 1998 and 2000 and with age at first calving between 20 and 38 months. Cows either with missing sire information or from sires with fewer than 50 daughters in the data, and cows belonging to a herd-year at calving class with fewer than five cows were excluded. The resulting data set consisted of 89 987 cows from 7468 herd-year classes and sired by 477 bulls. Pedigree information of these sires was traced back as far as possible resulting in a sire pedigree file with 759 sires.
Included mastitis cases in this study were veterinary-treated CM. In addition to the veterinary treatments, cases of culling for mastitis were included if they occurred within 60 days after first calving and without preceding veterinary treatment in first lactation. This was done because we wanted to capture only those cases of culling for mastitis that had most probably occurred in connection to a true case of CM. If a recorded mastitis occurred within 8 days of a preceding case, they were considered to be the same case (International Dairy Federation, 1997) and only the first recording was kept.
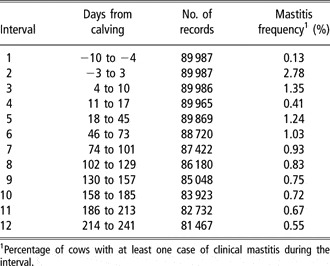
To create a series of binary responses for each cow, a period starting from 10 days before first calving was initially divided into eleven 4-week intervals, and the first interval was further divided into four 1-week intervals. The reason for the shorter intervals in the beginning of the lactation was that most of the CM cases occurred around calving and we wanted to capture this larger variation. Within each interval, the presence or absence of CM was scored as ‘1’ or ‘0’ and in the case of several CM cases within the same 4-week interval only the first case was kept. If a cow had CM in a given interval, the day of the case was used in the time-dependent function (described later); otherwise the midpoint of the interval was used. A preliminary analysis showed that the genetic variation was extremely low after day 250 with erratic and unrealistic estimates as a consequence. Therefore, we decided to exclude the last two intervals. The final data set consisted of 1 045 286 binary observations divided on four 1-week intervals (1 to 4) followed by eight 4-week intervals (5 to 12) and spanning a time period from 10 days before to 241 days after first calving. Cows that were culled before day 241 in lactation got a shorter time period and could consequently get fewer than 12 intervals. The number of cows with observations ranged from 89 987 in interval 1 to 81 467 in interval 12 (Table 1). The overall CM frequency, i.e. the percentage of cows with at least one case of CM in the period from 10 days before to 241 days after first calving, was 10.1%. This was only 0.8% lower (710 cases less) than that observed in the original data set, which included cases up to 297 days. Less than 1% of the cows had more than one case (maximum four) of CM. The CM frequency in each of the 12 intervals was much lower than the overall CM frequency as a consequence of adding zeros when creating a series of binary responses for each cow. The highest CM frequency (3%) was found in interval 2 (around calving), whereas the CM frequency in most of the other intervals was very low (Table 1).
Number of records and mastitis frequencies in 12 separate intervals for first-lactation Swedish Holstein cows

1Percentage of cows with at least one case of clinical mastitis during the interval.
Statistical analysis
To analyze the longitudinal CM trait we used a linear sire RRM where the phenotypic trajectory of CM over time was accounted for by a lactation stage effect and deviations around this trajectory were modeled by a random regression function for sire using orthogonal Legendre polynomials as covariables. Different models with varying orders of polynomials for the random sire effects, ranging from intercept up to fourth order, were tested and the fit of the models was assessed using likelihood ratio tests. The chosen model used for the final analysis contained a third-order (cubic) Legendre polynomial function of time:
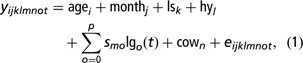
where yijklmnot = binary CM observation on cow n, daughter of sire m, recorded at time t in age class i, month of calving class j, lactation stage class k and herd by year class l; agei = fixed effect of age at calving i in months (1 month per class except for the first class which contained both month 20 and 21; 18 classes); monthj = fixed effect of month of calving j (12 classes); lsk = fixed effect of lactation stage k corresponding to the interval of the observation (12 classes); hyl = random effect of herd by year at calving l (7468 classes); smo = random regression coefficient o of y on lgo(t) for additive genetic effect of sire m (759 classes); lgo(t) = covariates of Legendre polynomials of time t up to order p (3); cown = random effect of permanent environmental effect within cow n (89 987 classes); eijklmnot = random residual effect.
Random effects were assumed to be normally distributed with zero means and the covariance structure was:
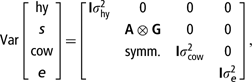
where I is an identity matrix, A is the additive genetic relationship matrix and G is a 4 × 4 (co)variance matrix of the random regression coefficients for the sire additive genetic effects.
Estimates of (co)variance components were obtained by the AI-REML algorithm in the DMU package (Madsen and Jensen, Reference Madsen and Jensen2008). The genetic parameters obtained from an RRM are functions of time and the sire variance was computed as:

where L′(ti)=[1 lg1(ti) lg2(ti) lg3(ti)] represents a third-order Legendre polynomial at time ti. Similarly, an estimate of the sire covariance between time ti and tj was obtained by:

The heritability of CM at time ti was calculated as:

and the genetic correlation between CM at times ti and tj was calculated as:

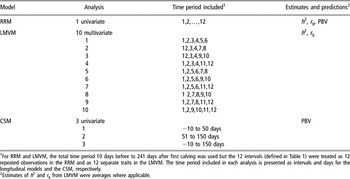
To informally validate the linear RRM, estimated heritabilities and genetic correlations from this model were compared with the corresponding genetic parameters from similar linear LMVM of binary CM for the separate intervals (defined as for the RRM; see Table 1), where CM was scored as 1 if the cow had at least one case of CM during the specific interval and 0 otherwise. Estimates of heritabilities and correlations were averages, where applicable, of 10 multivariate analyses with six intervals in each (interval 1 and 2 included in all) (Table 2). The following linear sire model was used for LMVM:

where yijlmn was the binary CM observation in a specific interval of cow n, daughter of sire m and belonging to age class i, month class j and herd by year class l.
Information on the analyses of clinical mastitis from linear random regression (RRM), longitudinal multivariate (LMVM) and cross-sectional models (CSM), and from which analyses presented heritabilities (h 2), genetic correlations (r g) and predicted breeding values (PBV) were obtained

1For RRM and LMVM, the total time period 10 days before to 241 days after first calving was used but the 12 intervals (defined in Table 1) were treated as 12 repeated observations in the RRM and as 12 separate traits in the LMVM. The time period included in each analysis is presented as intervals and days for the longitudinal models and the CSM, respectively.
2Estimates of h 2 and r g from LMVM were averages where applicable.
The effects in the model were the same as those described for equation (1), except that the lactation stage effect and cow effect, as well as the random regressions of the sire effect, were excluded. Random effects were assumed to be normally distributed with zero means and the covariance structure was:
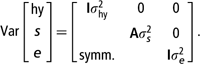
Estimates of (co)variance components were obtained by the same means as described for the RRM above. For calculation of the heritabilities, only the random effects of sire and residual were included in the phenotypic variance.
For further validation of the linear RRM, Pearson product–moment correlations (SAS, 2002) between sire PBV from this model and sire PBV from linear CSM were calculated for the time periods −10 to 50, 51 to 150 and −10 to 150 days after calving. Thus, three analyses of a linear sire CSM according to equation (6) were run where CM was scored as 1 if the cow had at least one case of CM during the specific time period and 0 otherwise (Table 2). In addition we studied the re-ranking of the best and worst five sires, as well as the number of common sires and Spearman’s rank correlations (SAS, 2002) among the best (worst) 10% of sires based on sire PBV from the linear CSM and their rank and PBV from the linear RRM for the same time periods. With our chosen RRM each sire got four random regression coefficients rather than a single PBV as is obtained from a CSM. These coefficients were combined with the vector of Legendre polynomials for a specific time to get a time-specific breeding value, which was then summarized over three different time periods to get three summarized PBV according to:
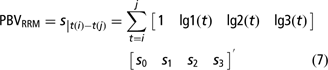
where time ti and tj represents 10 days before and 50 days after calving, 51 and 150 days after calving or 10 days before and 150 days after calving, respectively, for the three PBV.
Results and discussion
Genetic parameters
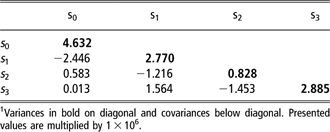
Estimates of the G matrix from the RRM are shown in Table 3. The remaining variance components from the RRM were 6.77 × 10⁻⁵ for  , 3.86 × 10⁻⁵ for
 and 9.33 × 10⁻³ for
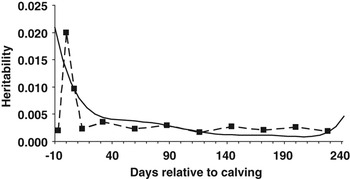
 . The estimated heritability for CM from the linear RRM was overall lower than the 2% to 3% which is most commonly obtained from linear CSM covering a larger part of the lactation (Heringstad et al., Reference Heringstad, Klemetsdal and Ruane2000; Carlén et al., Reference Carlén, Strandberg and Roth2004). This was, however, expected because the RRM gives the heritability at a specific point in time (week or month). The highest heritability (2.1%) was obtained at the beginning of lactation, and declined thereafter with time down to 0.1% around day 210. Thereafter there was a small increase in the heritability.
Estimated (co)variance componentsFootnote 1 of the random regression coefficients for the sire additive genetic effects (s 0–s 3) from a linear random regression model for Swedish clinical mastitis data
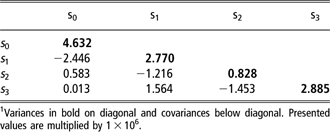
1 Variances in bold on diagonal and covariances below diagonal. Presented values are multiplied by 1 × 10⁶.
The heritability curve obtained from the linear RRM corresponded quite well with the point estimates from the linear LMVM for the separate intervals that ranged from 2% (interval 2) to 0.17% (interval 8) (Figure 1). The first interval had a much lower heritability than the second, probably because of the lower CM frequency in this interval (Table 1). The RRM creates a smoother curve and with the chosen order of the polynomials, it could not capture the low heritability obtained in the linear LMVM for the first interval.
Heritability for clinical mastitis from a linear random regression model (solid line) and from linear longitudinal multivariate models for 12 separate intervals plotted at midpoint in each interval (▪).

Although the estimated variances from linear models are frequency-dependent, the intervals with the lowest heritabilities did not have the lowest CM frequencies. For example, interval 8 with the lowest heritability had a CM frequency in agreement with, but a genetic variance lower than, the surrounding intervals.
To our knowledge there are no previous studies where CM has been successfully analyzed with a linear RRM. Negussie et al. (Reference Negussie, Strandén and Mäntysaari2008) described a preliminary analysis with a linear RRM for CM, which however resulted in erratic estimates and computational difficulties because of the very low CM frequencies. Heritability estimates of the liability to CM from threshold models are generally higher than those from linear models (Heringstad et al., Reference Heringstad, Klemetsdal and Ruane2000). Rekaya et al. (Reference Rekaya, Gianola, Weigel and Shook2003) reported heritabilities for test-day records of CM of 27% at day 14, 5% at day 60, 3% at day 120 and 7% at day 305, from a Bayesian threshold RRM on 329 first-lactation Holstein cows. Heringstad et al. (Reference Heringstad, Chang, Gianola and Klemetsdal2003) and Chang et al. (Reference Chang, Gianola, Heringstad and Klemetsdal2004b) studied the same data from first-lactation Norwegian cattle using similar approaches as Rekaya et al. (Reference Rekaya, Gianola, Weigel and Shook2003). They presented heritabilities for CM between 7% and 13% before calving and between about 3% to 4% and 11% to 15% between calving and day 260. After that the heritability increased sharply, caused by an artifact of the Legendre polynomials, to reach unrealistically high levels near day 300. Similar to our results, the highest heritability from these three studies up to around day 260 was at the beginning of lactation where the CM frequency was highest. However, compared with the results from Heringstad et al. (Reference Heringstad, Chang, Gianola and Klemetsdal2003) and Chang et al. (Reference Chang, Gianola, Heringstad and Klemetsdal2004b), our results did not show any considerable increase in the heritability towards the end of the defined period of the lactation. From threshold LMVM, Chang (Reference Chang2002) reported that the heritability for CM was 14% in the first period (30 days before calving to the day of calving) and dropped in subsequent periods up to day 300, but was always larger than 6%. The fact that our heritabilities were overall much lower than those presented in other longitudinal studies was expected because of our use of a linear rather than a threshold model. Another explanation for the lower heritabilities in our study is probably the much lower CM frequency. In our data, the overall CM frequency was about 10% to 11% compared to 18% (Rekaya et al., Reference Rekaya, Gianola, Weigel and Shook2003) and 23% (Chang, Reference Chang2002; Heringstad et al., Reference Heringstad, Chang, Gianola and Klemetsdal2003; Chang et al., Reference Chang, Gianola, Heringstad and Klemetsdal2004b) in other longitudinal studies of CM.
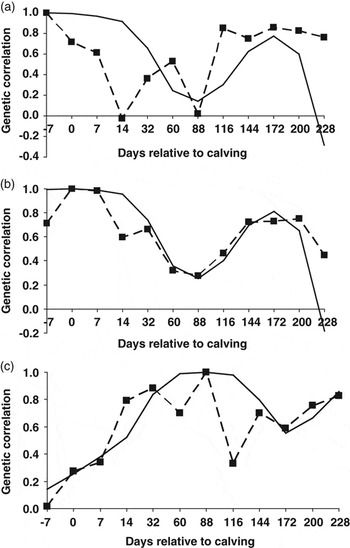
The estimates of genetic correlation between CM in different time periods of the lactation indicated that CM is not the same trait genetically for the whole lactation. Looking at selected days (midpoint in each interval) between day of calving and day 200 after calving, the genetic correlations from the linear RRM and linear LMVM ranged from about 0.25 and −0.2, respectively, to near unity for both models. The range of genetic correlations between different days of the lactation was somewhat higher in our study than those reported in other longitudinal studies of CM (Chang, Reference Chang2002; Heringstad et al., Reference Heringstad, Chang, Gianola and Klemetsdal2003; Chang et al., Reference Chang, Gianola, Heringstad and Klemetsdal2004b).
The pattern of within-lactation genetic correlations from our two models agreed fairly well. This is illustrated for day 7 before calving, the day of calving and day 88 after calving, respectively (midpoints in interval 1, 2 and 7), and the remaining part of the lactation (Figure 2). The general picture shows that CM at the beginning of lactation (the first 30 days) is highly genetically correlated to CM around day 140 to 200 (Figure 2a and b), whereas CM in between these two time periods seems to be a somewhat different trait genetically (Figure 2c). It has been concluded in previous studies, using either LMVM (Chang, Reference Chang2002; Heringstad et al., Reference Heringstad, Chang, Gianola and Klemetsdal2004) or RRM (Heringstad et al., Reference Heringstad, Chang, Gianola and Klemetsdal2003; Chang et al., Reference Chang, Gianola, Heringstad and Klemetsdal2004b), that CM is not the same trait genetically throughout lactation. In those studies, they suggested that the genetic correlation between different days was generally higher between adjacent days and decreased, the further apart the days were. This trend can be seen also in our results for the genetic correlation between day 7 before calving and the day of calving, respectively, and all the days up to day 88 after calving (Figure 2a and b). After that, however, the genetic correlation increases and remains moderate to high for the rest of the lactation (except for at day 228 where the genetic correlation from the linear RRM drops rather dramatically). The similarity between models indicate that this is not an artifact caused by the polynomial function and the extremely low genetic variation in some of the time periods. A closer inspection of the results in previous longitudinal studies (Chang, Reference Chang2002; Heringstad et al., Reference Heringstad, Chang, Gianola and Klemetsdal2003; Chang et al., Reference Chang, Gianola, Heringstad and Klemetsdal2004a and Reference Chang, Gianola, Heringstad and Klemetsdal2004b) showed a similar phenomenon for early CM. For example in Chang (Reference Chang2002), where CM in eleven 30-day periods from 30 days before to 300 days after calving were studied, the highest genetic correlation (0.55) was between the first and the second period and the lowest genetic correlation (0.13) was between the first and the third period. In Chang et al. (Reference Chang, Gianola, Heringstad and Klemetsdal2004a), the period from 30 days before calving to the day of calving was more highly genetically correlated with the period up to day 30 after calving and the period after day 120 after calving, respectively, than with the period in between. Using a linear sire model, Lund et al. (Reference Lund, Jensen and Petersen1999) also reported, less than unity, genetic correlations of CM before and after 50 days in lactation. These findings indicate that different genes operate at different parts of lactation. Pathogen-specific differences in the mastitis incidence over the course of lactation have been reported (Hogan et al., Reference Hogan, Smith, Hoblet, Schoenberger, Todhunter, Hueston, Pritchard, Bowman, Heider, Brockett and Conrad1989). Different pathogens might initiate different defense mechanisms, resulting in differences in genetic correlations of CM across the lactation.
Genetic correlations for clinical mastitis between day 7 before calving (a), day of calving (b) and day 88 after calving (c), respectively, with the remaining part of the lactation from a linear random regression model (solid line) and from linear longitudinal multivariate models for 12 separate intervals plotted at midpoint in each interval (▪).

The agreement of estimates from the two models was best for the day of calving (interval 2), where the point estimates from the linear LMVM follow the curve obtained from the linear RRM rather closely (Figure 2b). This is probably because of the higher genetic variation in this interval. It is interesting to note that even for the time period before calving (interval 1), where the heritabilities differed considerably and the estimate from the linear LMVM was very low, the patterns of the genetic correlations agreed rather well (Figure 2a). However, the pattern from the linear LMVM fluctuates more, with some of the point estimates deviating considerably and being biologically unreasonable. Most of the deviating estimates occurred when one of the intervals with very low CM frequency and heritabilities were involved, for example interval 1, 4, 8 and 12. One example of this is the near-zero genetic correlation between day 7 before calving and day 14 after calving (Figure 2a). Here, we would expect the genetic correlation to be somewhere between the genetic correlations of 0.6 and 0.4 estimated between day 7 before calving, and day 7 and day 32 after calving, respectively. We certainly do expect CM 1 week before calving and 2 weeks after calving to be relatively strongly genetically related traits. Another example of an unrealistic estimate from the linear LMVM is the low genetic correlation of 0.3 between day 88 and day 116 after calving, where the surrounding genetic correlations were considerably higher (Figure 2c). Some of the estimates from the linear RRM were also difficult to explain biologically, but in general they seemed more reasonable. This is because the polynomial function in the RRM to some extent determines the shape of the curve by limiting the number of bends. Therefore, this curve looks smoother and with more stable estimates than the curve obtained if point estimates from the linear LMVM are tied together. As described by Jensen (Reference Jensen2001), the parameters from an LMVM can be ‘jumpy’ because no structure is assumed for the (co)variances over time and usually small data sets are used for parameter estimation.
Predicted breeding values and sire ranking
The correlations between sire PBV from the linear RRM, summarized over different time periods, and sire PBV from linear CSM were used as a validation of the linear RRM. Correlations less than unity imply re-ranking of sires. For the full time period (−10 to 150 days), the correlation was as high as 0.96, indicating that the PBV from the two models were in good agreement and that only some re-ranking among sires occurred. The correlation for the early time period (−10 to 50 days) was nearly as high as for the full time period, 0.92, whereas the correlation for the late time period (51 to 150 days) was 0.74. From these results it is not possible to conclude which model better predicts the sires true breeding values. Further, summarizing over different time periods may not even be appropriate since our results indicate that CM is not the same trait genetically throughout lactation.
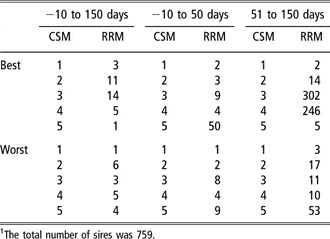
The re-ranking of sires is illustrated in Table 4, which lists the best and worst five sires based on PBV from linear CSM and their ranking based on PBV from the linear RRM for the described full, early and late time period of first lactation. The number of common sires among the best (worst) 10% of sires (76 sires) for these time periods was 56, 58 and 31 (64, 58 and 46), respectively. The rank correlations between PBV for the same groups of sires and time periods were 0.61, 0.61 and 0.28 (0.80, 0.80 and 0.46), respectively. This is another way to show that the ability of the two models to predict sire breeding values was in best agreement (less re-ranking) when the full or early time periods were considered and in least agreement when only the late time period was chosen. Further, the agreement was better among the worst sires than among the best sires. This was in agreement with the results by Carlén et al. (Reference Carlén, Emanuelson and Strandberg2006) where sires with a larger proportion of daughters with CM got more precise breeding values and were ranked more correctly.
The best and worst five siresFootnote 1 ranked on predicted breeding values for clinical mastitis from linear cross-sectional models (CSM) for different time periods of first lactation and their ranking based on predicted breeding values, summarized over the corresponding time periods, from a linear random regression model (RRM)

1 The total number of sires was 759.
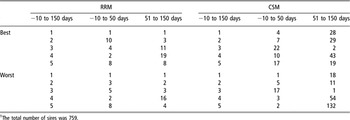
Within models, the correlations between PBV from the different time periods described above, early–full, late–full and early–late, were 0.92, 0.89 and 0.65 from the linear RRM and 0.91, 0.60 and 0.24 from the linear CSM. This implies that the sire ranking, especially when based on CSM, is affected by the chosen time period. The within method re-ranking is illustrated in Table 5 for the best and worst five sires.
The best and worst five siresFootnote a ranked on predicted breeding values for clinical mastitis from linear random regression models (RRM) or cross-sectional models (CSM) for the time period 10 days before to 150 days after first calving and their ranking for other time periods of first lactation

1 The total number of sires was 759.
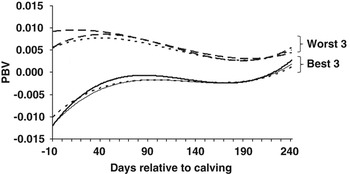
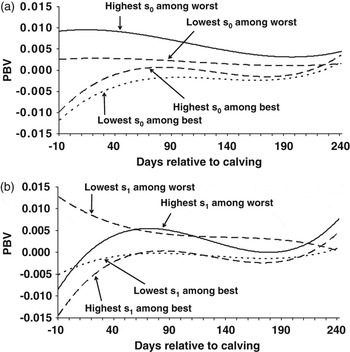
Rather than considering the summarized PBV from the linear RRM, the individual time-specific PBV could be used for looking at re-ranking of sires within different parts of lactation. Further, the illustration of different sire curves demonstrates that PBV for a specific sire changed over time. A too early selection of sires, based mainly on on-going lactations, could therefore be risky. Figure 3 shows the sire curves up to day 241 for the three best and worst sires based on summarized PBV for the full period (10 days before to 150 days after calving). Lower genetic merit implies less CM, thus better mastitis resistance, and this figure illustrates clearly that the curves of the three best sires are lower than the curves of the three worst throughout lactation. Figure 4a and b shows the curves from the sires with the highest and lowest intercept and slope, respectively, among the 10% best and 10% worst sires based on the same criteria as above. In general, the best sires had a lower intercept and a higher (more positive) slope than the worst sires. The correlation between the random regression coefficients for the level and the slope was −0.7. This estimate was of similar sign and magnitude as the corresponding estimate from Chang et al. (Reference Chang, Gianola, Heringstad and Klemetsdal2004b). There was a larger difference in both intercept (Figure 4a) and slope (Figure 4b) among the worst than among the best sires, which implies that it is easier to distinguish among the worst sires because of more available information.
Predicted breeding values for clinical mastitis from a linear random regression model during the first 241 days in first lactation for the three best and the three worst sires based on their summarized predicted breeding value from 10 days before to 150 days after calving.

Predicted breeding values for clinical mastitis from a linear random regression model during the first 241 days in first lactation for the sires with the highest and lowest intercept (s 0) (a) and slope (s 1) (b), respectively, among the 10% best and 10% worst sires based on their summarized predicted breeding value from 10 days before to 150 days after calving.

Methodological considerations
It was not straightforward to estimate genetic parameters for CM with this type of linear RRM. Preliminary analyses of different RRM (i.e. the order of the polynomials) in combination with different trait definitions for CM (i.e. the length of intervals) gave rather different results and often erratic and unrealistic estimates or convergence problems. We used orthogonal Legendre polynomials of standardized time units, which have been recommended because of their advantage to reduce correlations among the estimated coefficients (Schaeffer, Reference Schaeffer2004). However, in several of our preliminary analyses the correlations between the random regression coefficients for sire were all near unity. An alternative to Legendre polynomials could be linear splines, but then knots have to be pre-defined i.e. adding subjectivity to the analyses. A comparison between those two approaches for RRM on CM data was done by Negussie et al. (Reference Negussie, Strandén, Mäntysaari and Tsuruta2006).
Our study was done on a data set with binary observations of CM in very low frequencies, and with very low genetic variance, especially in some time periods. It would be interesting to see if an increased frequency would overcome some of the problems that we experienced. However, the linear RRM finally chosen did fairly well in comparison to the linear LMVM. Some of the estimates from this RRM were unstable and had large standard errors, although this was also the case for the estimates from the linear LMVM.
We must conclude from our analyses that the method of linear RRM was unstable and sensitive for estimation of parameters for longitudinal binary CM data. It is however expected to work well for genetic evaluation purposes, thus prediction of breeding values, when the genetic parameters are known. Genetic evaluation for longitudinal binary CM data with a linear RRM has several advantages compared to the currently used linear CSM, but more research is needed to develop an RRM that will work satisfactorily for this purpose. In general, clearer evidence of the gain achieved by replacing a CSM with a longitudinal model, such as RRM or LMVM, for genetic evaluation of CM data is desirable. In a future study, cross-validation to assess the predictive ability of different models could be a useful complement to the results in this study. Comparisons of models are, however, complicated when the analyzed trait is defined differently for the different models.
Acknowledgements
The authors are grateful to the Swedish Dairy Association for providing the data and to Freddy Fikse for his suggestions on improvements of the analyses.