I. INTRODUCTION
Since its appearance a few decades ago, spark plasma sintering (SPS), nowadays more correctly known as pulsed electric current sintering (PECS), has raised increasing interest within the ceramics community due to its fast sintering cycles and the capacity to produce ultra-high density materials. The reasons for these fast sintering cycles and successful processing of ceramics still raise questions within the community Reference Bernard-Granger and Guizard1,Reference Olevsky and Froyen2 as illustrated by the fact that some researchers use PECS more like a conventional sintering method with sintering cycles up to several hours, Reference Kim, Hiraga, Mortia and Yoshida3–Reference Roussel, Lallemant, Chane-Ching, Guillemet-Fristch, Durand, Garnier, Bonnefont, Fantozzi, Bonneau, Trombert and Garcia-Gutierrez6 while others focus their work on ultra-short ones of only a few minutes. Reference Stuer, Zhao, Aschauer and Bowen7–Reference Morita, Kim, Hiraga and Yoshida10
Olevsky et al. Reference Olevsky and Froyen2 have suggested that the most pertinent difference between PECS and conventional sintering is the density of diffusion paths rather than changes in the mechanism itself. This follows the principle idea of Bernard–Granger et al. who suggested treating PECS as a normal hot-press sintering method. Reference Bernard-Granger and Guizard1
In this work, dilatometry studies combined with stress exponent determinations are used to compare the apparent activation energies for densification of Al2O3 by PECS with those obtained by conventional sintering or dilatometry. The combination of both provides a deeper insight into the dominant mechanisms involved during sintering. Although, the exact mechanism(s) involved in the sintering cannot be directly addressed by this method, it is commonly accepted that for a certain material a given apparent activation energy relates to a specific (dominant) sintering mechanism. These considerations are important for the defect free processing of alumina needed for the production of transparent polycrystalline alumina (PCA). Reference Apetz and van Bruggen11–Reference Pecharroman, Mata-Osoro, Diaz, Torrecillas and Moya13 The main limitations for the production of high real in-line transmittances (RITs) for PCAs are the elimination of defects and limiting the grain growth. The use of SPS to minimize grain growth has been shown to be a viable processing route for medium to high RITs. Reference Roussel, Lallemant, Chane-Ching, Guillemet-Fristch, Durand, Garnier, Bonnefont, Fantozzi, Bonneau, Trombert and Garcia-Gutierrez6,Reference Stuer, Zhao, Aschauer and Bowen7 For the critical defect size, e.g., porosity SPS should also be interesting as a pressure-assisted sintering method. However, recent work on optical modeling of SPS/PECS sintered samples Reference Stuer, Bowen, Pecharroman, Cantoni and Zhao8 has shown that pores below a critical size of around 50 nm do not contribute to losses in RIT. This means that the control of grain size and grain alignment (to reduce the birefringence effects) is a key to the future improvement of transparent PCAs. This needs a better understanding of sintering mechanisms, as discussed in this paper, be it via PECS or more traditional sintering routes. Reference Krell, Klimke and Hutzler14
Here, we investigate the sintering of doped (Mg, La, and Y) α-Al2O3 powders by conventional dilatometry and PECS dilatometry. We estimate the activation energy for the two different routes using both the master sintering curve (MSC) and constant heating rate methods. The dopants are investigated as single dopants (450–500 ppm) as well as a triple-doped sampled with Mg, La, and Y together. The results for the apparent activation energies are presented and the differences in conventional sintering and PECS are discussed.
II. BACKGROUND
A. Apparent activation energy
The apparent activation energies of densification were determined by two approaches, each with its own assumptions and limitations: the MSC and the constant heating rate.
The concept of the MSC is based on the instantaneous normalized densification rate as follows Reference Su and Johnson15 :
 $${{{\rm{d}}\rho } \over {\rho {\rm{d}}t}} = {{3\gamma \Omega } \over {{k_{\rm{B}}}T}}\left( {{{{\Gamma _{\rm{v}}}{D_{\rm{v}}}} \over {{G^3}}} + {{{\Gamma _{{\rm{gb}}}}{D_{{\rm{gb}}}}} \over {{G^4}}}} \right)\quad ,$$
with ρ, the instantaneous density; γ, the surface energy; Ω, the atomic volume; k B, the Boltzmann constant; T, the absolute temperature; D v and D gb, the coefficients for volume and grain boundary diffusion, respectively; G, the mean grain size diameter; and Γv, Γgb scaling parameters that depend on ρ and G.
If there is a single predominant diffusion mechanism, a function Θ(t, T(t)) can be defined by separating the parameters depending on the temperature from the others. This function combines the effects of time and temperature into a single master variable Reference Su and Johnson15 as follows:
 $$\Theta \left( {t,\,T\left( t \right)} \right) \equiv \int_0^t {{1 \over T}\exp \left( { - {{{Q_{\rm{d}}}} \over {RT}}} \right){\rm{d}}t} = {{{k_{\rm{b}}}} \over {\gamma \Omega {D_0}}}\int_{{\rho _0}}^\rho {{{G{{\left( \rho \right)}^m}} \over {3\rho \Gamma \left( \rho \right)}}{\rm{d}}\rho } \quad ,$$
with Q d the apparent activation energy, R the perfect gas constant, t the instantaneous sintering time, D 0 the diffusion coefficient for the dominant diffusion mechanism, ρ0 the initial green body density, ρ the instantaneous density, and m a parameter that equals 3 for volume and 4 for grain boundary diffusion. The last expression on the right-hand side incorporates the changes of the grain size G(ρ) and the scaling parameter Γ(ρ), both assumed to be exclusively density-dependent. The density ρ as a function of Θ(t, T(t)) is the MSC. Provided the assumptions above are met (i.e., single predominant mechanism), the MSC is unique for a given powder and a given—reproducible—green body forming technique and is independent of the sintering path.
In the case of PECS, it has been shown that the concept of the MSC remains valid under the assumption that the applied pressure is larger than the sintering stress but insufficient to induce plasticity and that deformation is controlled by a diffusion process. Reference Guillon and Langer16 In such a case, Eq. (2) then becomes
 $$\Theta \left( {t,T(t)} \right) \equiv \int_0^t {{1 \over T}{\rm{exp}}\left( { - {{{Q_{\rm{d}}}} \over {RT}}} \right){\rm{d}}t} = {{{k_{\rm{b}}}} \over {H{D_0}p_{\rm{a}}^n}}\int_{{\rho _0}}^\rho {{{G{{\left( \rho \right)}^m}} \over {\rho \varphi {{\left( \rho \right)}^n}}}{\rm{d}}\rho } \quad ,$$
with H, a numerical constant; p a, the uniaxial pressure; φ, a stress-intensification factor depending on the density; and n, the stress exponent equal to 1 in the case of grain boundary or volume diffusion and viscous flow.
Using the equality relation between both right-hand side terms in Eqs. (2) and (3), Θ(t, T(t)) is calculated from the dilatometry data using an estimated apparent activation energy Q by summation over the data acquisition time interval. Reference Kiani, Pan and Yeomans17 In a second step, the correct apparent activation energy is determined by minimization of the overall difference between the densification curves from the various heating rates. Based on the formula given by Kiani et al., Reference Kiani, Pan and Yeomans17 the following expression was used for this error minimization calculation:
 $${\rm{error}} = \sqrt {{1 \over {M + 1}}\left( {\mathop \sum \limits_{k = 1}^N \mathop \sum \limits_{j = 1}^{M - 1} {{\left[ {{\rho _j}\left( {{\Theta _k}} \right) - {\rho _{j + 1}}\left( {{\Theta _k}} \right)} \right]}^2} + X} \right)} \quad ,$$
 $${\rm{with}}\;X = \mathop \sum \limits_{k = 1}^N {\left[ {{\rho _M}\left( {{\Theta _k}} \right) - {\rho _1}\left( {{\Theta _k}} \right)} \right]^2}\quad ,$$
where K is a summation over the discrete points Θ k , j is a summation over the various heating rates, and X is the variation between the first and the last heating rates, included to avoid potential inaccuracies arising from a systemic shift between the subsequent heating rates.
The method used for the determination of the apparent activation energy for densification is given in detail elsewhere Reference Bernard-Granger and Guizard18 and will not be further described in the present paper. It should be noted, however, that in the present work, the effect of thermal expansion as described in Ref. Reference Bernard-Granger and Guizard18 does not apply for the PECS case and is removed by subtracting a baseline curve obtained by resintering a fully dense sample inserted into the (same) graphite dye for each sintering cycle. Furthermore, the shrinkage occurs only in one direction during PECS due to the uniaxial applied pressure, so that the instantaneous density can be simplified as follows:
 $${\rho _T} = {{{\rho _{0,{T_0}}}} \over {\rho _{{T_0}}^{{\rm{th}}}}}{1 \over {{{\left( {1 + \Delta {L_T}/{L_{0,{T_0}}}} \right)}^3}}}\quad ,$$
with
 ${\rho _{0,{T_0}}}$
, the initial compact density at temperature T
0;
 $\rho _{{T_0}}^{{\rm{th}}}$
, the theoretical density at T
0; ΔL
T
, the instantaneous sample height variation at temperature T; and
 ${L_{0,{T_0}}}$
, the initial sample height.
B. Stress exponent
Assuming matter transport during PECS to be similar to the high temperature creep, the densification rate at constant temperature T can be written as follows Reference Bernard-Granger and Guizard1 :
 $${{{\rm{d}}{\rho _T}} \over {{\rm{d}}t}} = A{{\Phi {\mu _{{\rm{eff}}}}b} \over {kT}}{\left( {{b \over G}} \right)^p}{\left( {{{{\sigma _{{\rm{eff}}}}} \over {{\mu _{{\rm{eff}}}}}}} \right)^n}{\rho _T}\quad ,$$
with A, a constant; Φ, the diffusion coefficient; b, the Burgers vector; G, the grain size; p, the grain size exponent; and n, the stress exponent. σeff and μeff refer to the effective microscopic shear modulus and stress modulus, respectively, depending on the instantaneous density ρ T ,
 $${\sigma _{{\rm{eff}}}} = {{1 - {\rho _0}} \over {\rho _T^2\left( {{\rho _T} - {\rho _0}} \right)}}\sigma \quad ,$$
 $${\mu _{{\rm{eff}}}} = {{{E_{{\rm{eff}}}}} \over {2\left( {1 + {\upsilon _{{\rm{eff}}}}} \right)}} = {{{E_{{\rm{th}}}}} \over {2\left( {1 + {\upsilon _{{\rm{eff}}}}} \right)}}{{{\rho _T} - {\rho _0}} \over {1 - {\rho _0}}}\quad ,$$
with ρ0, the starting powder compact density; σ, the uniaxial sintering pressure (50 MPa in our case); E eff, the effective Young’s modulus; E th, the theoretical Young’s modulus; and υeff, the effective Poisson modulus. If the dwell temperature is selected such that grain growth can be neglected, Eq. (6) can be rearranged and simplified as follows:
 $$\ln \left( {{1 \over {{\mu _{{\rm{eff}}}}}}{1 \over {{\rho _T}}}{{{\rm{d}}{\rho _T}} \over {{\rm{d}}t}}} \right) = n\ln \left( {{{{\sigma _{{\rm{eff}}}}} \over {{\mu _{{\rm{eff}}}}}}} \right) + {K_1}\quad ,$$
with K 1, a constant.
The stress exponent can be obtained from the slope by plotting the left-hand side as a function of ln(σeff/μeff). For n = 1, densification is said to be controlled by grain boundary diffusion (Coble creep), lattice diffusion (Nabarro-Herring creep), or viscous flow. Reference Guillon and Langer16 For n = 2, densification is potentially governed by the grain boundary sliding accommodated by the interface-reaction step-controlled lattice diffusion or cavity formation. Reference Bernard-Granger and Guizard1 For n > 3, densification dislocation-climb mechanisms have been proposed. Reference Weertman19
III. MATERIALS AND EXPERIMENTAL METHODS
A. Materials
The powder used was a polyhedral near-spherical high purity α-Al2O3 with a median particle size D v50 of 510 nm (Laser diffraction, Mastersizer, Malvern, UK), a total impurity concentration of less than 0.01 mass% (≤5 ppm for Si, Na, Mg, Cu and Fe), and a specific surface S BET of 4.2 m2/g (G BET = 360 nm). Scanning electron microscopy (SEM) images of the powder can be found elsewhere. Reference Stuer, Zhao and Bowen20
Doping was carried out by dispersing 25 g of the powder in 60 mL 0.01 M HNO3 and adding Mg2+, Y3+, and La3+ aqueous nitrate solutions (purity >99%, Fluka for La- and Aldrich for Mg- and Y-hexa-hydrated nitrates, dissolved in 0.01 M HNO3) to achieve the desired cationic dopant ratio. After the dopant addition, 0.01 M HNO3 was added to reach a final suspension volume of 80 mL. Prior to freezing in liquid nitrogen and freeze-drying (45 h with the condenser temperature of −50 °C @ 0.08–0.1 mbar, Alpha 1–4, Christ, Germany), the suspension was stirred for 5 min and sonicated in an ultrasonic bath for 10 min.
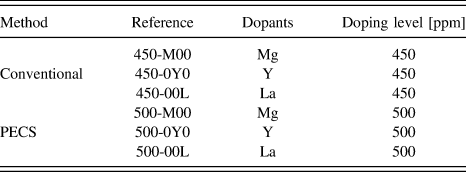
The various doping strategies that have been investigated are summarized in Table I; for the triple-doped samples equal quantities of Mg, La, and Y were used giving a total cationic ratio of 1500 ppm.
Summary of the powder doping levels studied for each method. Doping levels are given in the total cationic ratio.

B. Conventional dilatometry
For conventional dilatometry, 8 mm diameter green bodies were prepared by dry pressing 0.5 g of powder under 50 MPa uniaxial pressure. Dilatometry experiments (L75/1750; Linseis GmbH, Selb, Germany) were performed with heating rates at 2.5, 5, 10, and 20 °C/min up to 1500 °C in air. The samples were kept at 1500 °C for 1 h before cooling. The initial powder compact density was first reverse-calculated from the height and final sample density as determined by the Archimedes method, using the dilatometry shrinkage and anisotropy data. As a second step, the initial sample height was readjusted to fix their initial densities to the average of the series of green bodies. This step was based on the assumption that the powder compacts prepared from the same powder under identical conditions should have identical starting densities.
C. PECS dilatometry
For PECS dilatometry (Dr. Sinter 2050; Sumitomo Coal Mining Co., Tokyo, Japan), 0.8 g of powder was directly loaded into the graphite dye (12 mm diameter) and the initial compact density reverse-calculated from the final sample densities and height as described for the conventional dilatometry experiment. A series of four samples were sintered with 25, 50, 100, and 200 °C/min constant heating rates under 50 MPa uniaxial pressure, without any dwell time. For stress exponent measurements, an isothermal profile was applied, with the dwell temperature of 900, 950, 1000, or 1050 °C reached in 2 min and kept constant for 15 min. To incorporate the changes in the dominant densification mechanism as indicated by a change in the stress exponent in the MSC analysis with its single-mechanism assumption, the MSC was divided into two or three segments with independent error minimization for each of them. This segmentation is a requirement to account for the hypotheses of validity—a single predominant diffusion mechanism—of the MSC analysis. We believe that this is true even for the high temperature segments, when pressure and temperature could induce grain growth, because of the very short times spent in this regime due to the fast heating rates used in the PECS experiments. The resultant step-discontinuities in the curve are the natural consequence of the densification mechanism not remaining constant over the full density range.
IV. RESULTS AND DISCUSSION
A. Mg2+-doping
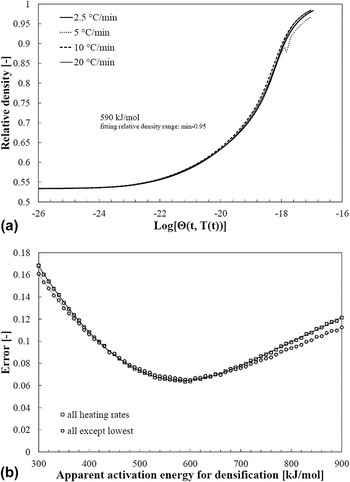
The results from conventional dilatometry reveal that throughout the whole investigated density regime—up to 0.98 relative density—the different sintering curves can be collapsed into a single MSC [Fig. 1(a)]. The observation of a net and stable minimum from error minimization by varying the apparent activation energy [Fig. 1(b)] allows the determination of an apparent activation energy of 590 kJ/mol without any ambiguity.
(a) MSC by conventional dilatometry for 450 ppm Mg-doped alumina for heating rates ranging from 2.5 to 20 °C/min. (b) By minimization of the error between the starting density and 0.95 relative density, an apparent activation energy of 590 kJ/mol is obtained.

This value lies in the range of densification of apparent activation energies recently reported for nondoped alumina determined by conventional dilatometry experiments (538 kJ/mol for a 19 m2/g alumina Reference Croquesel, Bouvard, Chaix, Carry, Saunier and Marinel21 and 652 kJ/mol for a 6 m2/g alumina Reference Zuo, Saunier, Marinel, Chanin-Lambert, Peillon and Goeuriot22 ). An increased apparent activation energy for densification compared to pure alumina (480 kJ/mol Reference Cho, Harmer, Chan and Ricman23 ) is consistent with the observation that in the case of grain boundary diffusion, the apparent activation energy increases with increasing dopant ionic radius. Reference Cho, Harmer, Chan and Ricman23
Note that the error minimization without the lowest heating rate [Fig. 1(b)] has always been used to verify the trend. Indeed, this allows us to verify that the measured apparent activation energy for densification is not influenced by nondensifying surface diffusion at lower sintering temperatures, which tends to increase the apparent value.
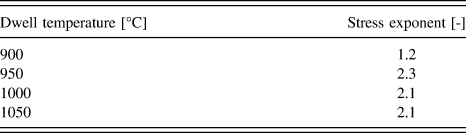
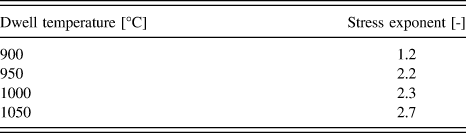
From the stress exponent measurements by PECS, it can be observed that there is a change of the densification mechanism between 900 and 950 °C at 50 MPa (Table II). The stress exponent changes from ∼1 to approximately ∼2, suggesting a change from viscous flow toward the interface-reaction step-controlled diffusion. However, as reported elsewhere, Reference Cho, Wang, Chan, Rickman and Harmer24 it is believed that a stress exponent value of 2 may not be incompatible with the grain boundary diffusion controlled densification, which better describes the observed apparent activation energy changes in this study.
Stress exponent at 50 MPa for 500 ppm Mg-doped AA04.

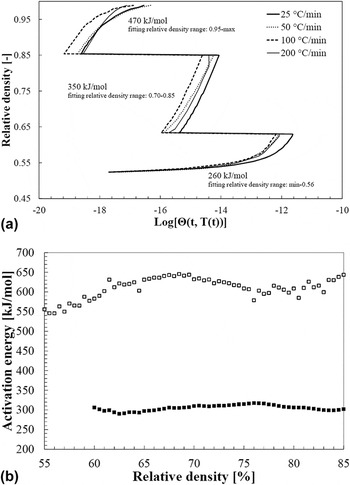
Based on the observation of a stress exponent change, a three-interval MSC fitting was performed [Fig. 2(a)]. That is, the relative density ranges for each interval were selected to separate three potential dominating mechanisms: (i) rearrangement, (ii) viscous flow, and (iii) grain boundary diffusion. The apparent activation energy for each interval was determined from the corresponding piecewise error minimization curve.
(a) MSC by PECS dilatometry for 500 ppm Mg-doped AA04 powder. A three-interval error minimization was performed in the relative density ranges from the minimum to 0.56, from 0.70 to 0.85, and from 0.95 to the maximum density. (b) Apparent activation energy for Mg-doped AA04 by conventional dilatometry (empty markers) and PECS (filled markers) at various relative densities.

The MSC by interval from PECS dilatometry does not result in a unique sintering curve as was the case for conventional dilatometry. However, it is believed from the work of Guillon et al. Reference Guillon and Langer16 that the concept of the MSC can still be applied under the conditions used here. The relative noisy fit between the different heating rates can be attributed to the blank correction and the reduced data acquisition density for the PECS dilatometry thereby increasing the stepwise integration error. Nonetheless it is not excluded that the less trivial collapse of the curves into a single segmented MSC may be linked to possible effective doping concentration variations at the grain boundaries during the sintering cycle. This is particularly true in the case of Mg-doping since the solubility limit of Mg is higher than that for Y- and La-doping.
The apparent activation energy in the intermediate sintering stage is lower than that for the free sintering by conventional dilatometry (around 600 kJ/mol), supporting the mechanism change observed from the stress exponent analysis under external pressure [Fig. 2(b)]. In addition, the constant heating rate analysis gives a similar value around 300 kJ/mol over a broad overlapping relative density regime.
At high densities where the effective pressure is low, the apparent activation energy seems to roughly match 590 kJ/mol obtained from conventional dilatometry, presumably linked to the grain boundary diffusion.
B. Y3+-doping
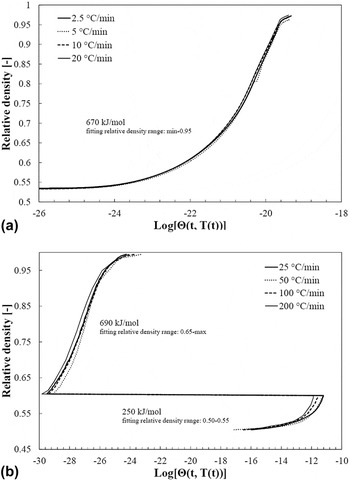
For Y3+ dopants, the data from conventional dilatometry can be matched into a single MSC in a density range up to 0.95 relative density [Fig. 3(a)]. From the error minimization, an apparent activation energy of 670 kJ/mol was obtained, which agrees well with the previously reported 685 kJ/mol. Reference Cho, Harmer, Chan and Ricman23 Above a relative density of 0.95, an abrupt change in the slope of the MSC can be observed, occurring at different densities for different heating rates. This indicates that the assumptions of the MSC are no longer all satisfied in this regime, where nondensity linked, elongated, or abnormal grain growth can occur.
(a) MSC by conventional dilatometry for 450 ppm Y-doped AA04. By minimization of the error between the starting density and 0.95 relative density, an apparent activation energy of 670 kJ/mol is obtained. (b) MSC by PECS dilatometry for 500 ppm Y-doped AA04. A two-interval error minimization has been done within the density ranges from the minimum to 0.55 and from 0.65 to the maximum relative density.

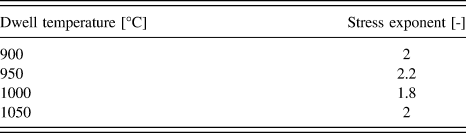
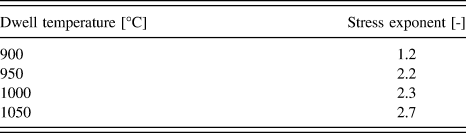
The stress exponent analysis at 50 MPa did not reveal any significant change for the PECS results and was close to ∼2 for the series of tested dwell temperatures (Table III). Consequently, a two-step MSC was used accounting only for (i) rearrangement and (ii) grain boundary diffusion [Fig. 3(b)]. Error minimization revealed an apparent activation energy of 690 kJ/mol. The similarity between the conventional and PECS dilatometry results throughout the sintering cycle may be explained by the reported improved creep resistance of alumina upon Y-doping. Reference Cho, Wang, Chan, Rickman and Harmer24 Indeed, the ability of Y3+ cations to be accommodated in a relatively compact way at the grain boundary may improve the apparent coherency of the grain boundary, as recently supported by atomistic simulations. Reference Galmarini, Aschauer, Bowen and Parker25 This may reduce the viscous response, but does not necessarily require coherent site lattices (CSLs). Reference Galmarini, Aschauer, Bowen and Parker25–Reference Cho, Chan, Harmer and Rickman28 Furthermore, this may not only explain the need for higher sintering temperatures or pressures. Reference Pezzotti29 Indeed, it has been reported that the apparent activation energy for varying viscous responses at different grain boundaries is identical. Reference Cho, Harmer, Chan and Ricman23 This leads to the conclusion that viscous responses have a common thermally activated mechanism and thus indicates how a constant apparent activation energy was obtained for the intermediate and final sintering stages.
Stress exponent at 50 MPa for 500 ppm Y-doped AA04.

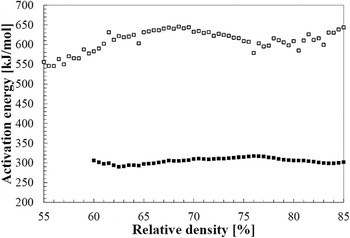
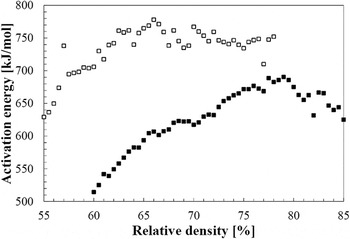
From the constant heating rate analysis (Fig. 4), similar apparent activation energies were obtained, within a reasonable range. For conventional dilatometry, the apparent activation energy increases slightly from 670 to 720 kJ/mol over the analyzed density range, and for PECS, the plateau value of 600 kJ/mol is slightly lower than the 690 kJ/mol value obtained from the MSC. The increase of the apparent activation energy from the PECS data at low relative densities to a final constant value may, however, indicate that some viscous flow occurs at the very early sintering stage, which has not been observed from the stress exponent analysis in the investigated temperature range. However, the fact that the apparent activation energy increases rapidly to its final plateau value is consistent with the results obtained from Mg-doping. Indeed for Mg2+-doped alumina, viscous flow is expected to be active over a much broader density range, keeping the apparent activation energy low at the intermediate energy level.
Apparent activation energy for Y-doped AA04 by conventional dilatometry (empty markers) and PECS (filled markers) at various relative densities.

C. La3+-doping
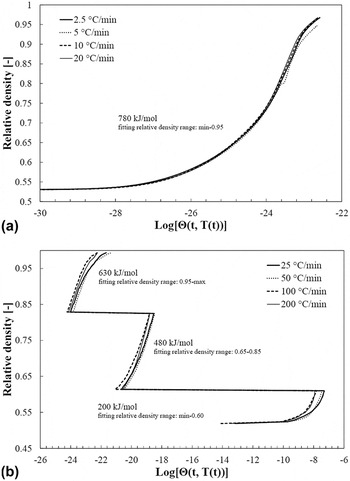
The conventional sintering constant heating rate data could also be collapsed into a unique MSC for La-doping [Fig. 5(a)]. From the error minimization, an apparent activation energy of 780 kJ/mol was obtained, which agrees with the reported value of 800 kJ/mol. Reference Cho, Harmer, Chan and Ricman23 Above 0.95 relative density, no abrupt change in the slope of the MSC can be observed, and the curves for all the different heating rates follow the same trend. It should be noted that for the 5 °C/min curve, a systematic mismatch can be observed above a relative density of 0.8. This is most likely due to a problem with the empty calibration curve of the dilatometer setup and was disregarded in the analysis.
(a) MSC by conventional dilatometry for 450 ppm La-doped AA04. By minimization of the error between the starting density and 0.95 relative density, an apparent activation energy of 780 kJ/mol was obtained. (b) MSC by PECS dilatometry for 500 ppm La-doped AA04. A three-interval error minimization has been done in the relative density ranges from the minimum to 0.60, from 0.65 to 0.85, and from 0.95 to the maximum density.

Again similar to Mg-doping, there is a change in the stress exponent and thus in the densification mechanism between 900 and 950 °C at 50 MPa (Table IV). The stress exponent changes from ∼1 to approximately 2. The PECS dilatometry data were merged into a three-interval MSC [Fig. 5(b)]. The error minimization at the intermediate density range yielded an apparent activation energy below 780 kJ/mol. This again suggests a pressure-activated mechanism to be predominant in this intermediate sintering regime. Although La3+, like Y3+, has been reported to improve the high temperature creep in alumina Reference Cho, Harmer, Chan and Ricman23,Reference Fang, Thompson, Harmer and Chan30 with similar grain boundary segregation energies, Reference Galmarini, Aschauer, Tewari, Aman, Van Gestel and Bowen31 the efficiency of La3+ is much lower and accompanied by a long initial nonsteady-state primary creep regime. Reference Cho, Harmer, Chan and Ricman23 Combining these reports with the actual results, it is suggested that the first primary creep regime is dominated by the sliding of the grain boundaries with the lowest apparent coherence before, upon their disappearance, a steady-state regime can be achieved.
Stress exponent at 50 MPa for 500 ppm La-doped AA04.

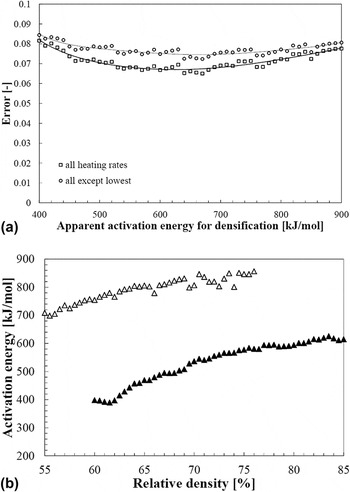
At the upper relative density range, error minimization resulted in an apparent activation energy around 630 kJ/mol, which is considerably lower than 780 kJ/mol obtained by conventional sintering. Assuming that the final sintering stage might be governed by Coble creep and subsequent Nabarro-Herring creep with a limited effect from the externally applied pressure, higher apparent activation energies would be expected at this stage. However, from the error minimization [Fig. 6(a)], no clear and well-defined minimum can be observed such that indeed a higher final apparent activation energy—analogous to the Mg- and Y-doping analysis—cannot be excluded.
(a) Error minimization for 500 ppm La-doped AA04 at a relative density range between 0.95 and the maximum achieved density. No well-defined minimum can be observed. (b) Apparent activation energy for La-doped AA04 by conventional dilatometry (empty markers) and PECS (filled markers) at various relative densities.

From the constant heating rate apparent activation energy determination over a wide density range, a similar discrepancy between the results from conventional and PECS can be observed [Fig. 6(b)]. Again, the apparent activation energy by PECS increases from 400 kJ/mol to roughly 600 kJ/mol. This increase is assumed to be linked to the better creep resistance of La-doped alumina compared to Mg2+, and the fact that it happens over a larger relative density range than for Y3+ agrees with the stress exponent analysis and the similar but slightly higher segregation energies than Y3+. Reference Galmarini, Aschauer, Tewari, Aman, Van Gestel and Bowen31
D. Mg2+–Y3+–La3+-doping
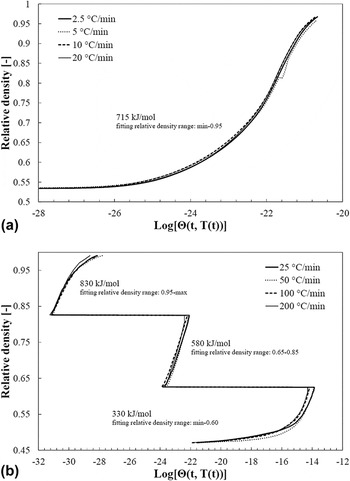
Finally, for triple doping, the conventional dilatometry sintering curves could also be collapsed into a single unified MSC, without any divergence observed over the whole investigated density regime up to 0.95 [Fig. 7(a)]. Error minimization gave an apparent activation energy of 715 kJ/mol, which is in between 780 kJ/mol for La- and 670 kJ/mol for Y–La-doping. Potentially, the addition of Mg2+ into the Y–La-doping system and the resulting oxygen vacancies created may lead to a more compact and/or homogeneous dopant accommodation over all the grain boundaries than for the Y–La-doping itself. This would result in an increased grain boundary diffusion barrier according to the reported hypothesis Reference Cho, Harmer, Chan and Ricman23 and recent atomistic simulations. Reference Tewari, Galmarini, Stuer and Bowen32–Reference Tewari, Nabiei, Parker, Cantoni, Stuer, Bowen and Hébert34
(a) MSC by conventional dilatometry for 450 ppm Mg–Y–La-doped AA04. By minimization of the error between the starting density and 0.95 relative density, an apparent activation energy of 715 kJ/mol has been obtained. (b) MSC by PECS dilatometry for 1500 ppm Mg–Y–La-doped AA04. A three-interval error minimization has been done in the relative density ranges from the minimum to 0.60, from 0.65 to 0.85, and from 0.95 to the maximum density.

As for Mg- and La-doping, the stress exponent analysis revealed once more a densification mechanism change between 900 and 950 °C (Table V). However, a tendency toward a stress exponent of 3 is observed at 1050 °C, which could indicate a shift toward a dislocation-climb controlled regime. Again from the stepwise MSC [Fig. 7(b)], a lower apparent activation energy (580 kJ/mol) was observed in the intermediate relative density regime compared to conventional dilatometry (715 kJ/mol). At the final sintering stage, this apparent activation energy increases to 830 kJ/mol, which is higher than that in the case of conventional sintering, but might be due to the much higher doping level (1500 ppm see 500 ppm for the single dopants) of the powder used in the PECS triple-doping experiment.
Stress exponent at 50 MPa for 1500 ppm Mg–Y–La-doped AA04.

The data from the constant heating rate analysis (Fig. 8) show similar trends as for Y- and La-doping, with the same discrepancy observed between the maximum apparent activation energy obtained by the MSC analysis and the plateau value obtained from the PECS dilatometry results. However, since in all those cases the relative density regime covered by the constant heating rate analysis is below the density regime covered in the MSC, it could be argued that the plateau value from the constant heating rate analysis corresponds to the steady-state creep after an initial particle rearrangement and rapid neck growth.
Apparent activation energy for Mg–Y–La-doped AA04 by conventional dilatometry (empty markers) and PECS (filled markers) at various relative densities.

V. CONCLUDING REMARKS
From the above results, it is suggested that the sintering mechanisms by conventional and PECS are governed by the same under-lying mechanisms in the final sintering stage (>∼0.85 relative density). For all the dopant combinations analyzed by both dilatometry techniques, the MSC revealed similar apparent activation energies during the final PECS sintering stage as for conventional dilatometry. At intermediate sintering stages, reduced activation energies were observed in most cases due to potential viscous flow under uniaxial pressure. The changes in the apparent activation energies in that region fit well with the observed stress exponent variations. However, the temperature range at which a stress exponent change is observed—between 900 and 950 °C—cannot be directly linked to the temperature range at which the resulting transition of the apparent activation energy is observed from the PECS MSC analysis—between 1200 and 1300 °C. It is believed that this is a dynamic effect. Indeed, the stress exponent measurements were done at low constant dwell temperatures. Under these conditions, the thermal gradients within the samples are at most very low. However, viscous flow at the necks and grain boundaries—especially at the early sintering stage—is specifically favored by the high local temperature gradients during PECS. Reference Olevsky and Froyen2 Hence, this explains why at constant dwell temperature or at very low heating rates viscous flow can be minimized or even eliminated.
The overall results from the current study suggest that the improved densification in PECS compared to hot-press sintering is not due to modified sintering mechanisms (see also Bernard-Granger et al. Reference Bernard-Granger and Guizard1 ), but rather to improved mass exchange. This observation agrees with the suggestion that the primary benefits of PECS are linked to the rapid pulsed heating condition. Reference Olevsky and Froyen2 The high heating rates, as well as the pulsed nature of the heating, lead to high micro- and macro-thermal gradients and thereby enhance diffusion (i.e., concept of thermal diffusion Reference Olevsky and Froyen2 ).
Microthermal gradients appear as a consequence of the poor heat exchange at the necks, leading to neck temperatures exceeding those of the inner particle volume. As was just discussed, this presumably not only promotes densification by atom-vacancy separation Reference Olevsky and Froyen2 but also through higher viscous flow probabilities. Microthermal gradients are expected to increase with increasing pulse frequency, due to the reduced time for local temperature homogenization. Reference Olevsky and Froyen2 Thus, stress exponent measurements at varying pulse sequences could potentially validate or invalidate the present assumptions. Indeed, the stress exponent should be reduced over a wider temperature range with increasing pulse frequency. Furthermore, the effect could be more pronounced with smaller particles compared to larger ones, because of the smaller contact area at the necks. Macrothermal gradients, instead, result from a direct heat exchange between the graphite PECS mold and the nonelectrically conducting—i.e., non-self-heating—alumina powder compact. These macrothermal gradients lead to thermal stresses that can promote dislocation generation. The increased dislocation concentration could potentially influence densification through dislocation-climb mechanisms.
In conclusion, we have seen that for a series of doped aluminas there is no major change in densification mechanisms using PECS. Although, an improved densification is observed when alumina is sintered under an electric field (e.g., PECS and microwave Reference Croquesel, Bouvard, Chaix, Carry, Saunier and Marinel21 ) when compared with conventional sintering. The keys to producing higher in-line transmittance PCA lie in the control of grain growth and grain alignment to reduce the birefringent contribution to the light scattering.
ACKNOWLEDGMENTS
Swiss National Science Foundation (SNF) is acknowledged for supporting MS with the Grant No. 200021-122288/1.