INTRODUCTION
Multiple sclerosis (MS) is a degenerative disorder of the central nervous system (CNS) characterized by demyelination. Lesions throughout the CNS not only signify damage to the myelin sheath, thereby affecting the transmission of nerve impulses along the nerve pathways (Perry, 1994), but also involve areas of axonal transection (Ferguson et al., 1997; Raine & Cross, 1989; Trapp et al., 1998). The resulting neurological damage can lead to various clinical symptoms, including motor impairments, somatosensory problems, cognitive dysfunction, and fatigue (Miller, 1996), although not all patients experience all of these symptoms (Brassington & Marsh, 1998). Gray matter involvement has also been identified in MS, which may be the result of degenerative processes that begin in the white matter and/or may be a direct part of the disease process (Benedict et al., 2004; Simon et al., 1999; Zivadinov et al., 2001).
Cognitive impairment affects 30–70% of patients (Amato et al., 1995; Heaton et al., 1985; Peyser & Poser, 1986; Rao et al., 1991). Speed of information processing (Achiron et al., 2005; DeLuca et al., 2004) and working memory (WM) deficits are often seen in patients with MS (D'Esposito et al., 1996; Diamond et al., 1997; Grigsby et al., 1994; Lengenfelder et al., 2003; Litvan et al., 1988). WM, as conceptualized by Baddeley (1992, 2003), is a limited capacity system enabling the storage, processing, and manipulation of information, and WM impairment can affect the ability to encode newly acquired information into long-term memory storage (Johnson, 1992).
The Paced Auditory Serial Addition Task (PASAT; Gronwall, 1977) is used commonly within a clinical setting to assess WM in patients with MS (Fisk & Archibald, 2001; Rao et al., 1991). The PASAT is a speed-dependent, continuous performance task that is sensitive to WM, sustained attention, and processing speed (Fisk & Archibald, 2001; Gronwall, 1977; Gronwall & Wrightson, 1981; Litvan et al., 1988). During this task, single digit numbers are presented at a specified speed (e.g., every 3 s) and patients are asked to add the presented number to the one immediately preceding it. In other words, patients must hold a digit in WM while adding it to the next number, all at a predetermined pace.
As discussed in Fisk and Archibald (2001) and Shucard et al. (2004), respondents may skip items intermittently, thus making the PASAT a less challenging task. When items are skipped, the presented information is put into more manageable units, or chunks (Snyder et al., 1993). By performing the task in this manner, the PASAT places less demand on WM, yet participants can still obtain a score in the normal range of performance. As a result, it has been argued that a score based only on the total number of correct responses on the PASAT may not be a sensitive indicator of WM ability (Fisk & Archibald, 2001; Shucard et al., 2004). Fisk and Archibald found that, compared to a healthy control group, patients with MS had similar total number correct scores, but were more likely to “chunk” while performing this task. Conversely, these patients had fewer correct “dyads,” or consecutive correct answers, than normal controls. Because of the increased chunking score, and fewer dyads, the authors suggested that patients with MS used an alternative approach to the task than explained in the instructions, thus reducing their WM load. Similar results were seen in a PASAT study with systemic lupus erythematosus patients (Shucard et al., 2004). Thus, it appears that inclusion of chunking and dyads, along with the total number of correct responses, provides a more sensitive index of how participants actually perform the task. This scoring procedure has been described in greater detail elsewhere (see, for example, Shucard et al., 2004; also see below).
Although the PASAT is used commonly to assess WM in clinical settings, the n-back task (see, for example, Carlson et al., 1998; Gevins et al., 1987) has been used more frequently in research, particularly with functional magnetic resonance imaging (fMRI) studies of WM. For example, several fMRI n-back studies have demonstrated the significance of the ventrolateral prefrontal cortex in the maintenance of information and the role of the dorsolateral prefrontal cortex in the executive components of WM, such as monitoring and manipulation (Braver et al., 2001; Manoach et al., 1997; Ragland et al., 2002). In fact, a handful of studies have used this measure in fMRI studies investigating neuroplasticity and WM in patients with MS. These studies showed that, relative to control participants, MS patients had increased activation in brain regions associated with the WM system (Hillary et al., 2003; Sweet et al., 2004; Wishart et al., 2004) as well as in brain regions not typically associated with WM (Penner et al., 2003; Wishart et al., 2004).
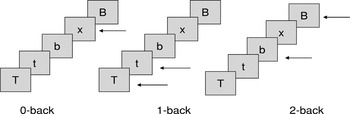
The n-back task was designed to manipulate factors associated with WM such as load (Carter et al., 1998) and is thought to tap executive aspects of WM (Baddeley, 2003). During the n-back task, participants have to decide whether a currently presented visual stimulus matches the stimulus previously presented “n” trials back, with “n” equaling zero, one, or two for the different conditions. As illustrated in Figure 1, in the 0-back condition, participants simply respond when a specified letter, generally X, is presented in an array of letters presented one at a time; whereas in the 1-back condition, participants have to decide if the presented letter matches the one just before it (letter presented one back). As n increases, so does the difficulty of the task (load) and its demand on WM. Similar to the PASAT, the n-back task is continuous. Unlike the PASAT, the n-back provides a measure of reaction time (RT), a behavioral index of processing speed that ranges from simple, as in the 0-back, to more complex, as in the 2-back, and is related to task difficulty. Also, because the n-back task does not require arithmetic calculations, it may provide a more straight forward measure of WM than the PASAT.

Examples of the 0-, 1-, and 2-back condition for the n-back task. Arrows refer to correct relationships.
Although the PASAT and the n-back tasks are assumed to be measuring similar WM processes, their common variance has never been documented. Furthermore, although the n-back has been used often in studies of WM, chunking and dyad scoring procedures have not been applied to this task. Knowledge that participants are performing the task in the prescribed manner is critical for drawing appropriate conclusions in studies of WM.
In the present study, we hypothesized that, compared to healthy controls, patients with MS will demonstrate impaired performance on both the PASAT and n-back tasks. Compared to healthy controls, patients with MS will be more likely to use the chunking strategy while performing tasks with the highest demand on working memory, namely both versions of the PASAT and, in particular, the 2-back of the n-back task, both of which require considerable executive processing/manipulation. The 1-back condition has less WM demand than the 2-back or PASAT, so that there should be less chunking for this relatively less demanding task. Additionally, patients with MS will exhibit longer reaction times than healthy controls on the n-back, especially as WM load, and thereby task difficulty, increased. We also hypothesized that the PASAT and n-back tasks assess similar abilities (WM and speed of information processing) and that an individual's performance on one task will be highly correlated with performance on the other. Therefore, individual PASAT and n-back performance scores (total correct, chunking, and dyads) will be highly correlated. That is, using the chunking and dyad scoring procedure for both tasks, individuals who do well on the PASAT should do well on the n-back and vice versa. Although it was hypothesized that the PASAT and n-back scores will be intercorrelated, we believe that each task has unique properties. Comparison of each of these tasks with neuropsychological measures of WM will allow us to determine whether these tasks are related to validated neuropsychological measures of WM.
METHOD
Participants
A total of 32 patients with clinically definite MS, according to standard diagnostic criteria (McDonald et al., 2001), and 20 healthy controls participated in the study. Patients were matched for age, level of education, and estimated full-scale intelligence. There were 18 female and 14 male patients, 22 of whom were diagnosed with relapsing–remitting MS and 10 with secondary–progressive MS. There were 15 female and 5 male controls. Participants were excluded from the study if they had a history of head trauma, hearing or visual problems, or learning disability. Additional exclusionary criteria included psychiatric, neurologic, or medical conditions other than MS. However, because of the high prevalence rate of depression in MS, depression was allowed in the patient sample only.
All participants were recruited as part of a larger study. Participants completed a neuropsychological battery that included the PASAT; the Digit Span and Letter-Number Sequencing subtests from the Wechsler Adult Intelligence Scale, 3rd edition (WAIS-III); the Spatial Span subtest from the Wechsler Memory Test, 3rd edition (WMS-III); Trail Making Tests A and B (TMT A and B; Reitan & Wolfson, 1985); and the North American Adult Reading Test (NAART). In addition, as part of an electrophysiological component of the study (event-related brain potentials were recorded during the n-back task), participants also received an n-back task (0-, 1-, and 2-back conditions). The focus of the present manuscript is on the behavioral data. To minimize the effects of fatigue, the order of the n-back task and PASAT was varied across patients. For some patients, n-back and PASAT testing occurred on different dates.
Measures
The PASAT was administered using the procedure described by Rao et al. (1991). Two trials were presented on audiotape, one with a 3.0-s interstimulus interval (ISI) and another with a 2.0-s ISI. For each trial, 61 numbers from one to nine were presented randomly. The duration of each number was 0.4 s. The trials were presented to participants using a dual-speaker tape player adjusted for each participant to a comfortable listening level. Participants were instructed to add the first pairs of numbers together and to state the sum to the examiner. When they heard the next number, they were told to add it only to the number immediately preceding it rather than to the sum of the first numbers, and so on. For example, if the participant was provided numbers “2” and “3,” they would answer “5”; if the next number was “8,” they would add it only to the “3” and answer “11.” To be consistent with the scoring procedure for the n-back task (see below), to be counted as correct, the participant had to give his/her answer before the next number was presented. Participants were provided with a written demonstration of how to complete the task, and were also given sample trials for both presentation rates to ensure that they understood the directions and were familiar with the task. All participants began with the 3.0-s ISI presentation rate followed by the 2.0-s ISI presentation rate (faster rate), with a short break between the two. They were informed about the faster rate of the second trial before its beginning.
The examiner recorded both correct and incorrect responses. PASAT scores obtained for each presentation rate were total number correct, total number of dyads, percentage dyads, total number of chunking responses, and percentage chunking. Chunking and dyad scores were calculated following the procedure described by Fisk and Archibald (2001) and Shucard et al. (2004). A dyad was scored when two consecutive correct answers were given. A chunking response was a correct response that followed a skipped response. The proportion of the total correct responses accounted for by dyads and chunking was also calculated for each participant at each presentation rate [percentage dyad = (total correct dyad score/total correct score) × 100; percentage chunking = (total correct chunking score/total correct score) × 100]. Although the percentage dyads does not measure overall performance accuracy for the PASAT, it does reflect the participant's adherence to the test instructions (Fisk & Archibald, 2001).
The n-back task had three conditions in the present study: 0-, 1-, and 2-back (see Figure 1). The conditions were presented in the same order (0-, 1-, 2-back) for all participants. A practice trial preceded each condition. For the 0-back, participants were instructed to identify the Xs in the array; for the 1-back, participants were asked to match each letter with the one preceding it; for the 2-back, participants were asked to match each letter to the letter that occurred two back. Participants were asked to press two different sets of buttons on a handheld device with both the left and right thumbs for matching and nonmatching letters, and responses had to be given before the next stimulus was displayed to be counted as correct. Ten letters of the alphabet were repeated for a total of 150 trials for each condition (0-, 1-, and 2-back). Case (lower or upper) was not a determinant of a correct response. One third of the trials presented were a “match,” and two thirds were a “nonmatch.” The n-back, including the percentage of “match” and “nonmatch” trials, was modeled after previously published studies using this task (see Carlson et al., 1998; Gevins et al., 1996; Segalowitz et al., 2001). Stimulus duration was 400 ms, with a 2000-ms ISI. The n-back measures obtained were identical to those of the PASAT: total number correct, total number of dyads, percentage dyads, total number of chunking responses, and percentage chunking. Dyads and chunking were calculated using the aforementioned procedures. Additionally, reaction time measures were obtained for correct responses on the 0-, 1-, and 2-back conditions.
Raw scores on Digit Span, Letter–Number Sequencing, and Spatial Span subtests were converted to standard scores based on published norms (Wechsler, 1997a,b). Raw scores for Trail Making Tests A and B were converted to scaled scores based on norms published by Heaton and colleagues (1991). Estimated full-scale intelligence was calculated using the NAART. Participants were also administered the Beck Depression Inventory-II (BDI-II). In addition to a total depression score, responses were divided into cognitive and somatic symptoms of depression following the recommendation of Beck and colleagues (1996). Briefly, cognitive symptoms included items that reflect feelings of sadness and anhedonia; whereas somatic symptoms included items that reflect fatigue and agitation. Somatic symptoms could be produced by disease states rather than due to depression, per se.
RESULTS
Participant Characteristics
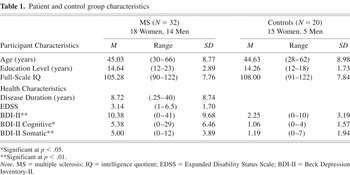
Demographic and health-related characteristics of participants are presented in Table 1. The two groups did not differ on age [t(49) = .16, not significant (n.s.)], education [t(49) = −.52, n.s.], estimated full-scale intelligence [t(49) = 1.21, n.s.], or proportion of males and females (χ2 = 1.87, df = 1, n.s.). Patients with MS reported significantly greater subjective depression on the BDI-II compared to healthy controls [t(46) = −3.25; p < .01]. Because self-report depression scales can be artificially inflated by physical symptoms of MS, we examined cognitive and somatic subscales of the BDI-II. Compared to healthy controls, patients with MS reported greater cognitive complaints [t(46) = −2.62; p = .01] and somatic complaints [t(46) = −3.69; p < .01] related to depression.
Patient and control group characteristics

Group Differences
n-back findings.
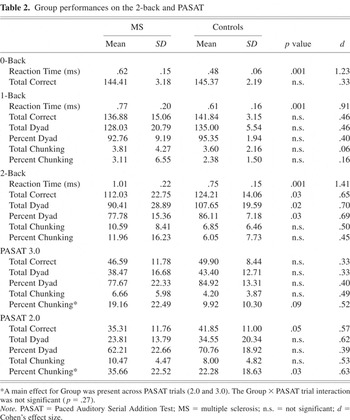
Analyses of variance (ANOVAs) were conducted to examine the difference between groups with regard to total correct on the 0-, 1-, and 2-back conditions, and total/percentage of dyads and chunking on the 1-back and 2-back conditions. For total correct, a 2 (group) × 3 (condition) ANOVA revealed a main effect for group [F(1,49) = 4.90; p = .03]. Because the group × condition interaction approached significance [F(2,98) = 2.67; p = .08], we conducted post hoc analyses, and using the Bonferroni correction method, each simple effect was tested at the .01 level. The two groups differed for total correct only on the 2-back [F(1,50) = 4.73; p = .03; see Table 2], with MS patients having fewer total correct compared with controls.
Group performances on the 2-back and PASAT

Two (group) × 2 (condition) ANOVAs were conducted to evaluate group differences for the dyad and chunking scores during the 1- and 2-back conditions. Group main effects were found for number of dyads [F(1,50) = 5.36; p = .03] and percentage of dyads [F(1,50) = 5.18; p = .03]. As seen in Table 2, MS patients had fewer dyads and a lower percentage of dyads compared to controls, mainly for the 2-back condition. To analyze chunking effects, 2 (group) × 2 (condition) ANOVAs were performed for total number and percentage of chunking responses. These analyses failed to reveal a main effect for group. Because the group × condition interaction for number of chunking responses approached significance [F(1,50) = 3.42; p = .07], we conducted post hoc analyses. However, one-way univariate ANOVAs failed to find any significant group differences. Thus, for the n-back task, MS patients had a lower total correct score, fewer dyads, and a lower percentage of dyads than healthy controls, particularly during the more demanding 2-back task, but were no more likely to use the chunking strategy than controls.
PASAT findings.
To examine group differences for both trials of the PASAT, 2 (group) × 2 (trial) ANOVAs were conducted separately for total correct, total number of dyads, total number of chunking responses, percentage of dyads, and percentage of chunking responses. Group main effects were not found for total correct, number of dyads, number of chunking responses, or percentage of dyads. A group main effect was present for percentage of chunking [F(1,50) = 4.40; p = .04] across trials on the PASAT, with MS patients having a greater percentage of chunking responses compared to controls, irrespective of PASAT pacing (2.0 ISI or 3.0 ISI). For the total correct score, the group × trial interaction approached significance PASAT [F(1,50) = 3.11; p = .08]; therefore, we conducted post hoc analyses. As seen in Table 2, the total score differed between MS patients and controls only on the PASAT 2.0 ISI [F(1,50) = 3.99; p = .05]. The group × trial interaction for total number of dyads was not significant [F(1,50) = 2.68; p = .11] nor was the main effect for group [F(1,50) = 3.50; p = .07]. Thus, on the PASAT, MS patients had greater percentage of chunking responses, irrespective of the trial, and fewer total correct responses only on the 2.0 ISI of the PASAT.
Analyses of covariance were conducted to determine whether group differences were influenced by depression. The total BDI-II score was used as the covariate. Findings described above remained for both n-back and PASAT performance scores. Therefore, depression did not appear to be a factor in the relationships obtained between MS patients and controls.
Reaction Time on n-Back in Patients With MS
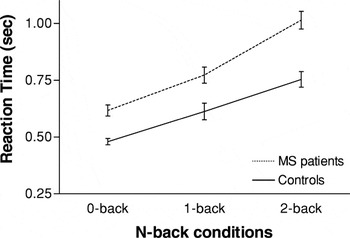
Reaction times (RT) were compared across each n-back condition and between the two groups [group (2) × condition (3)] using ANOVA. A significant condition by group interaction was found [F(2,49) = 3.96; p = .03]. Follow-up one-way ANOVAs were performed to examine group differences at each n-back condition. Using the Bonferroni correction method, each ANOVA was tested at the .01 level. MS patients had significantly longer RTs for each condition of the n-back compared to controls [0-back: F(1,50) = 15.91, p < .01; 1-back: F(1,50) = 9.68, p < .01; 2-back: F(1,50) = 22.46, p < .01]. As seen in Figure 2, although all participants showed slower RTs with increasing WM load, patients with MS had significantly slower RTs for each of the three conditions, particularly for the 2-back.

Mean reaction time for total correct responses on 0-, 1-, and 2-back conditions for healthy controls and patients with multiple sclerosis (MS).
Relationship Between PASAT and n-Back
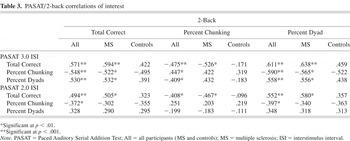
Pearson product moment correlations were obtained between the following PASAT and n-back measures: total correct, percentage dyad, and percentage chunking. These correlations were computed for all participants as well as separately for patients and healthy controls. Table 3 is presented to illustrate the pattern of correlations obtained. Two patterns were noted in these data: (1) the three variables of the 2-back showed significant correlations with both versions of the PASAT, but particularly for the slower 3.0 ISI, and (2) more performance measures on the PASAT and n-back were correlated in patients with MS than in healthy controls. However, comparisons of the differences between correlations for MS and controls as well as between the PASAT and n-back were not statistically significant, according to Fisher's r-to-z transformation tests.
PASAT/2-back correlations of interest

Relationship Among PASAT, n-Back, and Additional Neuropsychological Measures of WM
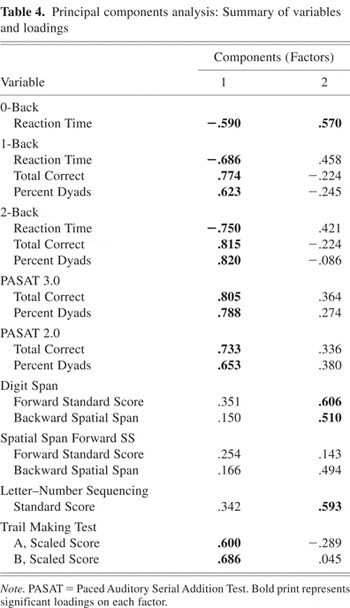
Principal components analysis (PCA) was performed on data from all participants (both patients and controls) to examine further the relationships among PASAT and n-back performance measures and the other neuropsychological measures of WM, and to obtain an empirical summary of the data. The following variables were included: (1) reaction time from 0-, 1-, and 2-back; (2) total correct from 1-back, 2-back, PASAT 3.0 ISI, and PASAT 2.0 ISI; (3) percentage dyads from 1-back, 2-back, PASAT 3.0 ISI, and PASAT 2.0 ISI; (4) scaled scores from TMT A and TMT B; (5) standard scores from WAIS-III Digit Span forward and backward; (6) standard scores from WAIS-III Letter–Number Sequencing; and (7) standard scores from WMS-III Spatial Span forward and backward.
Criteria for retention of factors were eigenvalues greater than 1, scree plot, and interpretability of the factors (Cattell, 1966). Based on these criteria, five components (factors) were retained, accounting for 76.47% of the total variance. The first two factors accounted for most of the variance (54.26%) and were consistent with our theoretical perspective. Table 4 summarizes the PCA solutions for the two factors. Factor loadings above .500 were considered significant. These factors were conceptualized as follows: (1) speeded information processing, and (2) nonspeeded working memory. Interestingly spatial span loaded in a category by itself (fourth factor). Note that for Factor 1, both PASAT (3.0 and 2.0) and n-back tests accounted for 39.58% of variance. Percentage dyads and total correct responses had high loadings on this factor. Reaction times for the n-back, particularly for the 1- and 2-back measures, were highly correlated with this factor. Finally, Trail Making Tests A and B also showed high loadings on Factor 1. Factor 2 (nonspeeded WM) accounted for 14.68% of the variance. Four measures showed loadings above .500 on this factor: 0-back reaction time, Digit Span Forward and Backward, and Letter–Number Sequencing.
Principal components analysis: Summary of variables and loadings

DISCUSSION
The present study was designed to examine the relationship between two purported tests of working memory, the PASAT and n-back tasks, through the application of measures of performance previously used for the PASAT. To our knowledge, this is the first time the relationship between these tests has been studied. When performance on the two tests was analyzed for all participants, a pattern of significant relationships was found, all in the predicted direction. For example, correlations between the total correct score, percentage dyads, and percentage chunking on the 2-back versus the PASAT 3.0 ISI were all significant when all participants were included (see Table 3). Furthermore, significant correlations were present between total correct responses on the PASAT 2.0 ISI and the total correct responses, percentage chunking, and percentage dyads on the 2-back. Thus, the participants who gave more correct responses on the PASAT also had more correct responses on the n-back task. Similar findings were seen when performance was analyzed only for the MS group. Performance measures between the PASAT and n-back tasks were not significantly correlated for the control group, although the pattern of correlations was in the appropriate direction. The lack of significant correlations for the control group is likely due to the relatively small sample size and the relatively low performance variability within the control group compared to the patient group. Performance measures for control participants were more homogenous than performance measures in patients.
Overall, we found significant group differences for performance on both the PASAT and 2-back tasks, and these differences remained when subjective depression, based on the BDI-II, was used as a covariate. Patients with MS showed poorer performance compared to healthy controls. This finding supports our hypothesis that patients with MS have difficulty on tasks with high WM demand. Compared to the 1-back, the 2-back requires greater manipulation, and thereby more executive involvement, placing greater demand on WM abilities. Correct performance on both versions of the PASAT is also associated with high demands on WM (Deary et al., 1991; Fisk & Archibald, 2001; Lengenfelder et al., 2003; Shucard et al., 2004).
Differences were also found with respect to how each group completed the WM tasks. On both versions of the PASAT, patients with MS were more likely to use chunking compared to healthy controls. This finding is consistent with the observation by Snyder et al. (1993). In their study, patients with MS were more likely to chunk presented information into more manageable units to make the task easier and less cognitively demanding. Shucard and colleagues (2004) found similar results when studying patients with systemic lupus erythematosus. In the present study, we found that on the n-back task, patients with MS had fewer total dyads and total correct responses compared to controls but were no more likely to use the chunking strategy than controls. This finding suggests that on the n-back, unlike on the PASAT, patients were performing this task as instructed and that their performance, as measured by total correct responses, is a reliable indicator of WM capacity.
A unique component of the n-back task is that it provides a measure of RT as a behavioral index of simple processing speed. RT is also a behavioral index of task difficulty in that as difficulty increases, RT generally slows. As expected, for both groups, RT increased as n-back task difficulty (load) increased. However, as indicated by the interaction, although MS patients were slower than controls across all three n-back conditions, the slowing was more so for the 2-back condition. Thus, as cognitive load increased, there was a steeper slope from the 1- to 2-back conditions for MS patients compared to controls (see Figure 2). A general simple motor slowing in MS cannot sufficiently explain these findings. Rather, it appears that MS patients have slowed simple processing speed (0-back RT) and slowed complex processing speed (1- and 2-back RTs), as well as WM deficits revealed by increasing cognitive load (i.e., the 2-back condition). This notion is consistent with previous research showing longer RTs and general cognitive slowing in patients with MS (Demaree et al., 1999; Denney et al., 2004; Kail, 1998; Rao et al., 1991).
Findings based on PCA pointed to a common feature of the PASAT, n-back, and specific other neuropsychological measures, that is, speed of information processing. Both the PASAT and n-back tasks present stimuli at a predetermined pace, and the examinee must keep up with the presentation rate to perform adequately. The Trail Making Test, on the other hand, allows the participant to perform at his/her own speed, but performance is based on how quickly the task is accurately completed. For the remaining WM measures, such as Digit Span, Spatial Span, and Letter–Number Sequencing, although the stimuli are presented at the rate of one per second, the examinee is able to respond at any rate without negative consequences to his/her scores. Using PCA, both the n-back task and the PASAT loaded on a factor we labeled as speeded information processing, which included both simple (i.e., RT for 0-back) and more complex processing speeds (RT for 1- and 2-backs; Chiaravalloti et al., 2003). However, it is important to note that these PCA results are based on a small sample size, and the results should be replicated using a larger group of participants.
Other points of comparison between the PASAT and n-back are relevant to the selection of these tests for the measurement of WM and processing speed. For example, performance on the PASAT has been correlated with age, although with inconsistent results. A handful of studies have reported that older adults, especially those over 50 years of age, generally demonstrate poorer performance on this task compared to younger adults (Brittain et al., 1991; Roman et al., 1991). On the other hand, other researchers reported that older adults 60–69 years of age perform better than younger adults (Stuss et al., 1987; Ward, 1997). Poorer performance by younger adults could be a “by-product” of a generation reliant on calculators (Gow & Deary, 2004; Ward, 1997). Furthermore, several studies report a significant relationship between performance on the PASAT and intellectual functioning (see Gow & Deary, 2004, for review), and researchers have questioned the appropriateness of the task for use with individuals with lower intellectual ability (Roman et al., 1991; Weins et al., 1997). Additionally, stronger performance on the PASAT appears to be related to an objective measure of mathematical ability as well as one's belief about their mathematical skills (Chronicle & MacGregor, 1998). A study by Audoin and colleagues (2005) used fMRI to document activation of verbal working memory and semantic memory retrieval networks during the PASAT. They speculated that involvement of such networks could be related to arithmetic fact retrieval or, in other words, arithmetic ability.
The n-back has not been studied as extensively as the PASAT, and only one study was found that investigated how age affects performance on this task. Missonnier et al. (2004) found that elderly patients (i.e., mean age, 75 years) performed significantly worse compared to younger adults (i.e., mean age, 26 years), but only on the 2-back. No studies were found that examined relationships between intelligence and other cognitive functions and the n-back. Finally, considering the very nature of the task, the n-back does not appear to be dependent on mathematical ability and may be more appropriate to use with individuals with poor mathematical skills.
Based on a review of the literature, it is not uncommon for participants to report distress while performing the PASAT. In fact, a study by Holdwick and Wingenfeld (1999) found that immediately after performing this measure, participants reported increases in negative mood states, specifically sadness and anxiety. However, it is important to note that such mood states were not associated with poorer performance on the measure. In our laboratory, the n-back appears to be less distressing for participants compared to the PASAT, although we only have observational data and patient reports to support this finding.
There are also disadvantages of the n-back task compared with the PASAT. In particular, the administration of the n-back task typically requires the use of a computer, whereas the PASAT requires a tape recorder. Use of a computer may not be possible or practical in all clinical settings. Additionally, the n-back requires more time for administration. In the present study, 5 min were needed to administer the two trials of the PASAT; whereas approximately 15 min were required to administer all three trials of the n-back task. During situations in which time is an issue, the PASAT may be the better choice.
In summary, the current study found that performance measures on the PASAT and n-back tasks are related; therefore, these tasks assess similar processes. As revealed by the principal components analysis, both tasks loaded on a factor that can be conceptualized as speeded information processing (which includes measures of both simple and complex processing speed). Also, reaction time and the Trail Making Test, but none of the other clinically validated measures of WM, loaded on this same factor, further supporting the theoretical bases for that factor.
There appears to be unique information provided by the n-back for evaluation of WM in clinical populations. The n-back task includes a direct measure of speed of information processing that is not available with the PASAT. In the present study, reaction time showed significant increases as WM load increased for both MS and controls, but MS patients were slower overall for all conditions and had more of an increase in RT as a function of WM load than controls. Furthermore, compared to the PASAT, the n-back task may offer a more accurate assessment of processing speed and WM and, thus, may be more appropriate for patients who are likely to experience WM deficits. As noted in the present study, for the n-back task, chunking did not differ between MS and controls, but dyads and correct responses did (only for the 2-back); however, across both trials of the PASAT, more chunking occurred for MS patients than controls. If a task is so difficult that some patients with WM problems cannot perform it at all, then it may not provide information about WM processes that are defective in these patients. Although currently a task primarily used in experimental settings, based on the present findings, the n-back may have considerable clinical utility for evaluation of patients with processing speed and WM deficits. However, further study of the n-back task with a larger sample size is needed, as well as increased understanding of the effects of age and intelligence on performance of this task.
ACKNOWLEDGMENTS
This research was supported in part by a grant from the National Multiple Sclerosis Society to JLS. We thank Rachel Cho and Danielle McCabe for their assistance with data reduction; and Jane Braun, Ph.D., for data collection and organization of the database. Portions of this research were presented at the 33rd Annual Meeting of the International Neuropsychological Society.