


I. INTRODUCTION
The current energy crisis makes alternative sources of energy very attractive, and research in these areas is a necessity. One of the most ubiquitous and abundant sources of energy is the heat supplied by the sun and dissipated by virtually every energy-consuming process. It is estimated that nearly 15 terawatts of energy is lost annually in the US alone through waste heat emitted to the environment.Reference Hochbaum, Chen, Delgado, Liang, Garnett, Najarian, Majumdar and Yang1 Heat and charge transport in materials are coupled processes, and this coupling leads to thermoelectric (TE) effects: a temperature gradient leads to a voltage drop and vice versa. Thermoelectric effects are important for probing elementary excitations in materials and have practical applications to refrigeration and power generation. Efficient thermoelectric devices are the key to our ability to harvest thermal energy from virtually any source, ranging from waste heat in industrial processes and engines to solar energy from parts of the solar spectrum, which cannot be efficiently captured by photovoltaics. The global need for sustainable energy coupled with the recent advances in thermoelectrics inspires a continued excitement in this field. As thermoelectric generators are solid-state devices with no moving parts, they are silent, reliable, and scalable, making them ideal for small, distributed power generation. Silicon-based thermoelectrics also have potential for on-chip cooling of local hot spots in dense nanoelectronic-integrated circuits where continued scaling of complementary metal oxide semiconductor (CMOS) circuits necessitates improvement in on-chip cooling techniques. However, both waste heat recovery and on-chip thermal management require materials with both low cost and high-thermoelectric conversion efficiency to be competitive with other technologies.
Silicon is cheaper and more widely available than some of the traditional bulk thermoelectric materials, such as bismuth telluride (Bi2Te3), and the processing techniques are well established. Unfortunately, bulk silicon is not a very efficient TE material due to its low-conversion efficiency, given as the ratio between heat absorbed over the energy produced
 $$\eta = \left( {1 - {{{T_{\rm{C}}}} \over {{T_{\rm{H}}}}}} \right)\left( {{{\sqrt {Z\bar T + 1} - 1} \over {\sqrt {Z\bar T + 1} + {{{T_{\rm{C}}}} \over {{T_{\rm{H}}}}}}}} \right)\quad ,$$
where T H and T C are the absolute temperatures of the hot and cold sides of the system between which the temperature gradient is applied, and the resulting heat flux is maintained, while  $\bar T$ is the average temperature inside the TE device. Fig. 1 shows the evolution of the overall efficiency as a function of ZT for several different values of T H while keeping T C at room temperature (T C = 300 K). Low-grade heat sources with small differences between T H and T C result in lower conversion efficiency but require a smaller ZT to reach the upper bound set by the Carnot limit. When T H − T C = 50 K, even a ZT = 1 might suffice. As the T H increases, so does the overall efficiency, but at the expense of needing a larger ZT. Hence, for high-grade heat sources having large temperature gradients T H − T C > 200 K, we need a ZT = 3 to reach 35% efficiency.
Thermoelectric conversion efficiency η as a function of the figure of merit ZT with the cold size kept at room temperature (T C = 300 K) and the hot size incremented in steps of 100 K so that the curves represent, from lowest to highest, T H = 350, 450, 550, 650, and 750 K. As T H increases, so does the Carnot limit, requiring a larger ZT to reach it.

Hence, the TE conversion efficiency is strongly governed by the dimensionless figure of merit 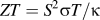 $ZT = {{{S^2}\sigma T}/ \mathord{\left{\vphantom {{{S^2}\sigma T} \kappa }} \right\kern-\nulldelimiterspace} \kappa }$.Reference DiSalvo2 Most moderately doped semiconductors have high-electrical conductivity and a moderate Seebeck coefficient. However, even with doping levels optimized for highest power factor, ZT is still limited in most bulk semiconductors by a high-thermal conductivity, which is mainly due to the lattice contribution from phonons, κph. The lattice contribution typically dominates over that of the charge carriers, electrons, or holes, κe and provides the one independent property, which can be tuned, at least to some extent, without adversely affecting the power factor. Silicon in its bulk form has a thermal conductivity of 146 W/mKReference Glassbrenner and Slack3,Reference Maycock4 at room temperature, and this limits the ZT to about 0.05.Reference Liao, Chen and Tu5 It has been an enormously challenging task to increase ZT > 1 with bulk materials despite decades of research due to the interdependence of material properties. However, a ZT of 1.5–2 may suffice for kW-range applications, such as vehicle heat recovery, car cooling/heating, and home cogeneration.Reference Vining6
Alloying is one approach that has been successful in improving the thermoelectric conversion efficiency of many bulk materials, including Si,Reference Bera, Soulier, Navone, Roux, Simon, Volz and Mingo7 where alloys of Si and Ge with varying composition have been typically used for TE conversion at high temperatures having ZT > 1 around 900 K.Reference Jeffrey Snyder and Toberer8 The improvement in ZT of bulk alloys comes primarily from the order-of-magnitude reduction in the lattice thermal conductivity κph caused by the dramatic increase in phonon scattering from the random mass variation present in the alloy. However, the lattice thermal conductivity in Si1−xGex alloys reaches a broad plateau for concentrations 0.2 < x < 0.8,Reference Maycock4 limiting the amount of reduction in lattice thermal conductivity, which can be achieved through alloying alone. The reason for this broad plateau is related simply to the fact that the mass-difference phonon scattering, which dominates lattice transport in the alloy, depends on the difference in atomic mass between the constituent materials (in this case Si and Ge) and the average mass in the alloy (given by M Si(1 − x) + M Gex). Increasing the Ge concentration initially moves the average further from the Si mass, causing a fast increase in the scattering rate (discussed in detail later in this paper). However, increasing the Ge concentration past a certain point does move the average further from the Si mass but at the expense of moving it closer to the increasingly large fraction of Ge atoms in the alloy. Hence, additional methods of reducing the lattice thermal conductivity in alloys are highly desirable.
Another approach to improving TE conversion efficiency is using low-dimensional nanostructures,Reference Hicks and Dresselhaus9,Reference Dresselhaus, Chen, Tang, Yang, Lee, Wang, Ren, Fleurial and Gogna10 such as thin films, nanowires,Reference Wang, Chen, Khitun and Balandin11 superlattices (SLs),Reference Lazarenkova and Balandin12 and nanocomposites. The approach to maximizing ZT by utilizing low-dimensional nanostructures was first proposed theoretically by Hicks and Dresselhaus in 1993.Reference Hicks and Dresselhaus13 Reducing physical size of the conductor below some threshold, typically given by the phonon mean free path in the bulk material, is expected to bring about a 2-fold benefit: first is a significant decrease in the thermal conductivity, resulting in an improvement of thermoelectric conversion efficiency.Reference Joshi, Lee, Lan, Wang, Zhu, Wang, Gould, Cuff, Tang, Dresselhaus, Chen and Ren14–Reference Zhu, Lee, Lan, Wang, Joshi, Wang, Yang, Vashaee, Guilbert, Pillitteri, Dresselhaus, Chen and Ren16 The second is the increase in the electronic Seebeck coefficient and the resulting power factor due to the reduction in the dimensionality. However, there is still much speculation over the effect of quantum confinement on electrons and its effect on the power factor as the physical thickness required to achieve sufficient confinement dips below 10 nm.Reference Ryu, Aksamija, Paskiewicz, Scott, Lagally, Knezevic and Eriksson17 Nonetheless, reducing lattice thermal conductivity without significantly affecting the Seebeck coefficient or electrical conductivity can still dramatically increase the overall ZT so thermal conductivity engineering through nanostructuring should be pursued in its own right as a viable path toward improving TE conversion efficiency.
In this study, we will consider three types of nanostructures with progressively more complex geometrical shape. We will focus on silicon–germanium (SiGe) alloys as the underlying material and demonstrate ways to utilize nanostructuring with the goal of reducing the lattice thermal conductivity to improve the figure of merit and increase the overall TE conversion efficiency. We will begin in Sec. II with the geometrically simplest structure, which is that of a thin film in which the thickness in the out-of-plane direction has been progressively reduced below the phonon mean free path, resulting in additional phonon scattering from the atomically rough boundaries of the film. Next, we will move to SLs in Sec. III as a periodic extension of the thin film case. Finally, we will turn our attention to the geometrically most challenging case, which is that of nanocomposites in Sec. IV, where the heterogenous and complex structure of the nanocomposite poses formidable challenges to simulation and modeling, which overcome by our numerical model based on the Voronoi tessellation and the phonon Boltzmann equation.
Overall, the work presented in this study focuses primarily on the applications of the numerical models developed, which have been validated and reported in earlier work.Reference Aksamija and Knezevic18–Reference Aksamija20 Nonetheless, sufficient theory will be presented to understand the numerical approach and make this work self-contained. The key advancement in the present models is 2-fold: we use the full phonon dispersion calculated from the adiabatic bond charge (ABC) model, and we describe roughness scattering at the boundaries of the nanostructures through a momentum-dependent specularity parameter. Our results show how we can successfully engineer phonon transport in nanostructured SiGe alloys for lower thermal conductivity by taking advantage of the boundary roughness scattering at the outer boundaries of thin films, between layers in SLs, and at the grain boundaries in nanocomposites.
II. LATTICE THERMAL CONDUCTIVITY IN SiGe ALLOY THIN FILMS
Thermal conductivity of bulk Si and Ge is relatively high, especially around room temperature, resulting in the figure of merit, which is not sufficiently large to be used in thermoelectric devices. The case of bulk SiGe alloys is more favorable but still somewhat similar to pure Si and Ge except at very high temperatures, limiting the range of applicability of SiGe alloy TE converters. Here, we consider the combination of nanostructuring and alloying to decrease thermal conductivity of the system. Unlike bulk materials, the phonon properties of semiconductor nanostructures and, in particular, the phonon frequency, group velocity, spectral density, as well as the strength of the interaction with carriers, can be widely modified to improve the performance of optoelectronic and other devices.Reference Cahill, Braun, Chen, Clarke, Fan, Goodson, Keblinski, King, Mahan, Majumdar, Maris, Phillpot, Pop and Shi21 The objective is to use nanostructuring and alloying methods, which have been proposed to boost ZT to improve conversion efficiency of semiconductors while staying within the limits of what is achievable through experimental approaches and fabrication.
Most theories of transport in solids for both electron and phonon transport employ the Boltzmann transport equation (BTE). This theory can explain, in bulk homogeneous materials, the dependence of the electrical conductivity, the thermal conductivity, and the Seebeck coefficient, on temperature, impurity content, isotope scattering, and quantum confinement.Reference Cahill, Ford, Goodson, Mahan, Majumdar, Maris, Merlin and Phillipot22 Once it is obtained from the solution of the phonon BTE (pBTE), the distribution function is used to determine lattice heat conductivity. By solving the time-independent pBTE in its relaxation time approximation form, the steady-state distribution function can be obtained. In the steady state, the time-independent pBTE is given asReference Carruthers23
 $${\vec \upsilon _{{\rm{b}},\vec q}} \cdot \vec \nabla {N_{{\rm{b}},\vec q}}\left( {x,y,z} \right) = - {{{N_{{\rm{b}},\vec q}}\left( {x,y,z} \right) - N_{{\rm{b}},\vec q}^0\left( T \right)} \over {\tau _{\rm{b}}^{{\rm{int}}}\left( {\vec q} \right)}}\quad .$$
As indicated in the pBTE, the steady-state phonon distribution function  ${N_{{\rm{b}},\vec q}}\left( {x,y,z} \right)$ is a function of the phonon branch b, wave vector
 $\vec q$, and position in 3D space (x, y, z).
 $\tau _{\vec q}^{{\rm{int}}}$ is the relaxation time due to all the intrinsic scattering mechanisms occurring in the interior of the material, including both resistive umklapp and non-resistive normal anharmonic phonon–phonon, isotope, impurity, and alloy mass-difference interactions.
 $\tau _{\vec q}^{{\rm{int}}}$ can be obtained using the standard single-mode relaxation time approximation from elasticity theoryReference Morelli, Heremans and Slack24 or from first principles, which typically leads to a quadraticReference Ward and Broido25 or cubicReference Esfarjani, Chen and Stokes26 frequency dependence of the anharmonic scattering rates in the long-wave length limit. The equations hold for each branch, and interbranch scattering is included in
 $\tau _{\rm{b}}^{{\rm{int}}}\left( {\vec q} \right)$. In the calculation of relaxation time
 $\tau _{\rm{b}}^{{\rm{int}}}\left( {\vec q} \right)$ for a phonon in mode b and with wave vector
 $\vec q$, we consider normal (N) and umklapp (U) three-phonon scattering, impurity (I, if present through doping or defects), and mass-disorder scattering (Mass) with branch and momentum-dependent relaxation times
 ${\tau _{{\rm{b}},{\rm{N}}}}\left( {\vec q} \right)$,
 ${\tau _{{\rm{b}},{\rm{U}}}}\left( {\vec q} \right)$,
 ${\tau _{{\rm{b}},{\rm{I}}}}\left( {\vec q} \right)$, and
 ${\tau _{{\rm{b}},{\rm{Mass}}}}\left( {\vec q} \right)$, respectively. The total intrinsic relaxation time is given by
 $${1 \over {\tau _{\rm{b}}^{{\rm{int}}}\left( {\vec q} \right)}} = {1 \over {{\tau _{{\rm{b}},{\rm{N}}}}\left( {\vec q} \right)}} + {1 \over {{\tau _{{\rm{b}},{\rm{U}}}}\left( {\vec q} \right)}} + {1 \over {{\tau _{{\rm{b}},{\rm{I}}}}\left( {\vec q} \right)}} + {1 \over {{\tau _{{\rm{b}},{\rm{Mass}}}}\left( {\vec q} \right)}}\quad .$$
When two materials are combined into an alloy, in this case Si1−xGex, variation in the local atomic mass leads to perturbation of lattice waves, which results in strong mass-difference scattering of phonons. In the case of alloys, mass-difference disorder will have three components: alloying, isotopic mass variation, and the small local strain field induced by variations in the atomic species (Si or Ge). The scattering strength will be proportional to the total fraction of mass-disordered constituentsReference Carruthers23
 $${\Gamma _{{\rm{Mass}}}}\left( x \right) = {\Gamma _{{\rm{Alloy}}}}\left( x \right) + {\Gamma _{{\rm{Iso}}}} + {\Gamma _{{\rm{Strain}}}}\left( x \right)\quad .$$
In the present case of Si1−xGex alloys, the mass disorder depends on the germanium fraction.
 $${\Gamma _{{\rm{Alloy}}}}\left( x \right) = x\left( {1 - x} \right){{{{\left( {{M_{{\rm{Ge}}}} - {M_{{\rm{Si}}}}} \right)}^2}} \over {{{\left[ {x{M_{{\rm{Ge}}}} + \left( {1 - x} \right){M_{{\rm{Si}}}}} \right]}^2}}}\quad .$$
The primary driver of thermal conductivity reduction from pure Si or Ge to the SiGe alloy is the quadratic dependence on the germanium concentration in alloy mass-difference ΓMass(x). The energy dependence of the alloy scattering rate follows a Rayleigh-like (τ−1∝ω4) trend and is calculated fromReference Tamura27,Reference Maris28
 $${1 \over {{\tau _{{\rm{Mass}}}}\left( \omega \right)}} = {\pi \over 6}{V_0}{\Gamma _{{\rm{Mass}}}}{\omega ^2}D\left( \omega \right)\quad ,$$
where V 0 is the volume per atom, and D(ω) is the vibrational density of states (vDOS) per unit volume.Reference Garg, Bonini, Kozinsky and Marzari29 The total energy dependent vDOS is given by a sum over all phonon branches b
 $$D\left( \omega \right) = \mathop\sum\limits_{\rm{b}} {\int {{{d\vec q} \over {{{\left( {2\pi } \right)}^3}}}\delta \left[ {\omega - {\omega _{\rm{b}}}\left( {\vec q} \right)} \right]} } \quad .$$
The volume integral of the energy-conserving delta function over the whole first Brillouin zone is calculated from the full phonon dispersion using the method of Gilat and Raubenheimer.Reference Gilat and Raubenheimer30 The contribution due to isotopic variation in each of the constituent materials can be obtained by combining the isotope constants for each pure material as
 $${\Gamma _{{\rm{Iso}}}}\left( x \right) = {{\left( {1 - x} \right){\Gamma _{{\rm{Si}}}}M_{{\rm{Si}}}^2 + x{\Gamma _{{\rm{Ge}}}}M_{{\rm{Ge}}}^2} \over {{{\left[ {x{M_{{\rm{Ge}}}} + \left( {1 - x} \right){M_{{\rm{Si}}}}} \right]}^2}}}\quad ,$$
where the pure SiGe isotope scattering constants ΓSi and ΓGe were taken from Ref. Reference Morelli, Heremans and Slack24. An additional component to alloy scattering arising from the strain field due to the difference in lattice constants of pure Si and Ge and their alloys has been proposed. The contribution due to strain is then given byReference Abeles, Beers, Cody and Dismukes31
 $${\Gamma _{{\rm{Strain}}}}\left( x \right) = \varepsilon x\left( {1 - x} \right){{{{\left( {{a_{{\rm{Ge}}}} - {a_{{\rm{Si}}}}} \right)}^2}} \over {a_{{\rm{SiGe}}}^2\left( x \right)}}\quad ,$$
where a SiGe(x) is the composition-dependent alloy lattice constant, taken in the virtual crystal approximation, including bowing.Reference Rieger and Vogl32 The empirical strain parameter is taken to be ε = 39.Reference Abeles33 It is estimated on the basis of the impurity modelReference Klemens34 and is in good agreement with experimental results for SiGe alloys.Reference Abeles33 For most values of germanium concentration x, the strain contribution ΓStrain(x) is found to be much smaller than the mass-difference component.
The resistive anharmonic phonon–phonon scattering rate was calculated in the standard approximation for dielectric crystalsReference Morelli, Heremans and Slack24
 $$\tau _{{\rm{b}},{\rm{U}}}^{ - 1}\left( {\vec q} \right) = {{\hbar \gamma _{\rm{b}}^2} \over {\bar M{\Theta _{\rm{b}}}\bar \upsilon _{\rm{b}}^2}}\omega _{\rm{b}}^2\left( {\vec q} \right)T{e^{{{ - {\Theta _{\rm{b}}}} \mathord{\left/ {\vphantom {{ - {\Theta _{\rm{b}}}} {3T}}} \right. \kern-\nulldelimiterspace} {3T}}}}\quad ,$$
where the speed of sound  ${\bar \upsilon _{\rm{b}}}$ of each branch b is determined from the average slope of its dispersion curve near the Γ point, and
 $\bar M$ is the average atomic mass. The Grüneissen parameter γb was obtained for each branch from the phonon dispersion and has the value of 1.1 for the longitudinal acoustic branch and −0.6 for the two transverse acoustic branches. The expression in (10) contains the exponential term
 ${{{e^{ - {\Theta _{\rm{b}}}}}} \mathord{\left/ {\vphantom {{{e^{ - {\Theta _{\rm{b}}}}}} {3T}}} \right. \kern-\nulldelimiterspace} {3T}}$ in the temperature dependence, which controls the onset of resistive umklapp scattering for each phonon branch through the branch-specific Debye temperatures Θb, which were obtained fromReference Slack, Seitz, Ehrenreich and Turnbull35
 $$\Theta _{\rm{b}}^2 = {{5{\hbar ^2}} \over {3k_{\rm{B}}^2}}{{\mathop \smallint \int\nolimits {\omega ^2}{g_{\rm{b}}}\left( \omega \right){\rm{d}}\omega } \over {\mathop \smallint \int\nolimits {g_{\rm{b}}}\left( \omega \right){\rm{d}}\omega }}\quad ,$$
where the vDOS function  ${g_{\rm{b}}}\left( \omega \right) = \mathop \sum \limits_{{\rm{b}},\vec q} \delta \left[ {\omega - {\omega _{\rm{b}}}\left( {\vec q} \right)} \right]$ was calculated for each phonon branch b from the full dispersion. This way, the temperature dependence of the contribution from each phonon branch to the total thermal conductivity is correctly represented.
In the bulk case, the crystal is assumed infinite and uniform. The distribution is only a function of temperature, and in the absence of boundaries and interfaces, the solution of the pBTE equation is simply given by
 $${n_{\vec q}} = {\tau _{{\mathop{\rm int}} }}\left( {\vec q} \right){\vec \upsilon _{\vec q}} \cdot {\nabla _{\vec r}}T{{\partial N_{\vec q}^0\left( T \right)} \over {\partial T}}\quad .$$
In contrast, boundaries and interfaces play an important role in the solution of pBTE in nanostructures. Hence, in nanostructures, we have to add an extrinsic relaxation rate  $\tau _{{\rm{b}},{\rm{B}}}^{ - 1}\left( {\vec q} \right)$ due to boundary roughness (B) scattering. At each time when a phonon reaches the boundary, we capture the probability of it not being scattered by the roughness through the momentum-dependent specularity parameter
 $0 \lt p\left( {\vec q} \right) \lt 1$ given by
 $$p\left( {\vec q} \right) = \exp \left( { - 4{\Delta ^2}{{\vec q}^2}{{\cos }^2}\Theta } \right)\quad ,$$
with Δ being the rms boundary roughness (typically 0.1 < Δ < 1 nm, depending on sample quality and processing) and Θ being the angle between the direction of propagation of the phonon wave and the boundary normal. The specularity parameter allows us to capture both the magnitude and the angle dependence of the scattering and distinguish between the contribution to the heat flux from phonons traveling into the boundary (small Θ, hence smaller  $p\left( {\vec q} \right)$ and more scattering) and phonons traveling parallel to the boundary (large Θ and larger
 $p\left( {\vec q} \right)$, leading to less scattering). The specularity parameter is used in solving the pBTE as a boundary condition, with
 $\left[ {1 - p\left( {\vec q} \right)} \right]$ giving the fraction of the incoming phonons, which are scattered randomly. As boundary scattering is a momentum-randomizing elastic process, the scattered phonons will carry zero heat flux, so they can be represented by the equilibrium Bose–Einstein distribution, leading to a boundary condition of the form
 $${N_{\rm{b}}}{\left( {\vec q} \right)^ + } = p\left( {\vec q} \right){N_{\rm{b}}}{\left( {\vec q} \right)^ - } + [1 - p\left( {\vec q} \right)]N_{{\rm{b}},T}^0\left( {\vec q} \right)\quad ,$$
with + and − representing the solution before reaching and after leaving the boundary, respectively, and  ${N_0}\left( {\vec q} \right)$ is the equilibrium Bose–Einstein phonon distribution of phonon mode
 $\vec q$ in branch b. The boundary scattering rate for a film of thickness H is then obtained asReference Aksamija and Knezevic19
 $$\tau _{{\rm{b}},{\rm{B}}}^{ - 1}\left( {\vec q} \right) = {{{\upsilon _{{\rm{b}}, \bot }}\left( {\vec q} \right)} \over H}{{{F_p}\left( {\vec q,H} \right)} \over {1 - {{\tau _{\rm{b}}^{{\mathop{\rm int}} }\left( {\vec q} \right){\upsilon _{{\rm{b}}, \bot }}\left( {\vec q} \right)} \over H}{F_p}\left( {\vec q,H} \right)}}\quad ,$$
where a mode-dependent scaling factor  ${F_p}\left( {\vec q,H} \right)$ is given by
 $${F_p}\left( {\vec q,H} \right) = {{\left[ {1 - p\left( {\vec q} \right)} \right]\left\{ {1 - \exp \left[ {{{ - H} \mathord{\left/ {\vphantom {{ - H} {\tau _{\rm{b}}^{{\mathop{\rm int}} }\left( {\vec q} \right){\upsilon _{{\rm{b}}, \bot }}\left( {\vec q} \right)}}} \right. \kern-\nulldelimiterspace} {\tau _{\rm{b}}^{{\mathop{\rm int}} }\left( {\vec q} \right){\upsilon _{{\rm{b}}, \bot }}\left( {\vec q} \right)}}} \right]} \right\}} \over {1 - p\left( {\vec q} \right)\exp \left[ {{{ - H} \mathord{\left/ {\vphantom {{ - H} {\tau _{\rm{b}}^{{\mathop{\rm int}} }\left( {\vec q} \right){\upsilon _{{\rm{b}}, \bot }}\left( {\vec q} \right)}}} \right. \kern-\nulldelimiterspace} {\tau _{\rm{b}}^{{\mathop{\rm int}} }\left( {\vec q} \right){\upsilon _{{\rm{b}}, \bot }}\left( {\vec q} \right)}}} \right]}}\quad .$$
This formulation of interface scattering allows for the rates of internal (intrinsic) and boundary roughness scattering to be added together, despite their interdependence.Reference Turney, McGaughey and Amon36 The factor given by Eq. (16) encapsulates the competition between boundary and internal scattering: the effective strength of boundary scattering will depend on the relative strength of the competing internal scattering mechanisms.Reference Sondheimer37
Thermal conductivity of Si1−xGex thin films was calculated, and the values are plotted against either total sample thickness or period thickness in different roughnesses. As we show in Fig. 2, the strong quadratic dependence on germanium concentration dominates the variation in thermal conductivity. In addition, effect of nanostructuring in reducing thermal conductivity is observed in thin films. Our results are in agreement with experimental data by Cheaito et al.Reference Cheaito, Duda, Beechem, Hattar, Ihlefeld, Medlin, Rodriguez, Campion, Piekos and Hopkins38 In the composition range of 0.2 < x < 0.8, thermal conductivity quickly decreases with increasing germanium composition, and then it reaches an almost flat plateau. Additionally, inside the plateau region, changing the thickness has a much greater effect on thermal conductivity than variation of Ge composition, while outside the plateau, compositional variation dominates. As the film thickness decreases, alloying induces smaller changes in the thermal conductivity as size effects begin to dominate. Significant reduction in the thermal conductivities of thin films are observed as compared to bulk, which is due to boundary scattering of the long wave length phonons, which are the primary thermal carriers. Consequently, for minimum thermal conductivity, we want to have composition inside the plateau region in combination with nanostructuring well below the bulk limit.
Thermal conductivity as a function of Ge composition is plotted for bulk and thin films Si1−xGex for three different thickness values of 100, 300, and 500 nm at room temperature. The symbols correspond to experimental data on the thickness series (upward triangles) and composition series (rightward triangles) by Cheaito et al.Reference Cheaito, Duda, Beechem, Hattar, Ihlefeld, Medlin, Rodriguez, Campion, Piekos and Hopkins38 The plot demonstrates strong quadratic dependence on the germanium composition with a plateau for 0.2 < x < 0.8.
Virtual crystal approximation was applied to Si1-xGex by replacing the mass-disordered lattice by an ordered virtual crystal with randomly distributed atoms of constituent materials. A similar alloy reduction for AlxGa1−xN alloys at high temperature using the virtual crystal approximation has been shown by Liu and Balandin.Reference Liu and Balandin39 Their model demonstrated the dependence of thermal conductivity on Al fraction, which results in homogeneous plateau, in which the strongest composition dependence occurs at very low or very high Al mass fraction, as a result the strongest reduction of thermal conductivity is achieved when Al or Ga mass fraction is between 0.1 and 0.9. A similar trend is observed in our model for Si1-xGex alloy, as shown in Fig. 2. More specifically, the thermal conductivity reduces from 200 W/mK for Al1Ga0N to 50 W/mK for Al0.9Ga0.1N and 20 W/mK for Al0.5Ga0.5N, about a factor of 10 decrease in conductivity for the 50% GaN case; the reduction in conductivity is much higher in SiGe alloys, about a factor of 18, as the conductivity reduces from 146 W/mK for Si1Ge0 to 8 W/mK for Si0.8Ge0.2.
Figure 3 is complementary to Fig. 2 as it shows that decreasing film thickness results in reduction of thermal conductivity. Our results are again compared to and in agreement with experimental data by Cheaito et al.Reference Cheaito, Duda, Beechem, Hattar, Ihlefeld, Medlin, Rodriguez, Campion, Piekos and Hopkins38 For example, for a SiGe layer with 20% Ge concentration, thickness of 39 nm and boundary roughness of 0.35 nm, the calculated thermal conductivity is 1.83 W/mK, which is also in agreement with the experimental data. The interesting crossover behavior in the x = 0.8 (largest Ge composition) is caused by the lower phonon velocity of germanium, which leads to a smaller thermal conductivity in the limit of ultrathin samples. The behavior of thermal conductivity as the thickness is reduced to the subnanometer regime depends on the model and the assumptions therein. Cahill minimum thermal conductivity modelReference Cahill, Watson and Pohl40 implies that the scattering rate has an upper bound, which is reached when the phonon lifetime equals one period of vibration. Hence the upper bound on the scattering rate is given by  $\tau _{\max }^{ - 1} = {\omega \mathord{\left/{\vphantom {\omega \pi }} \right\kern-\nulldelimiterspace} \pi }$. Including this maximum scattering rate given by Cahill, minimum thermal conductivity model allows us to reproduce the experimental values for amorphous Si (1 W/mK) and Ge (0.6 W/mK). Setting this upper bound on the phonon scattering rate leads to thermal conductivities, which converge to the values given by the minimum conductivity model, as shown by solid lines in Fig. 4.
Thermal conductivity of Si1−xGex alloy is plotted versus film thickness for four different germanium composition values of 0.2, 0.345, 0.45, and 0.8 at room temperature. The symbols correspond to experimental data on the thickness series (upward triangles) and composition series (rightward triangles) by Cheaito et al. Decreasing the film thickness causes significant reduction in the thermal conductivity for different compositions.
Thermal conductivity of Si1−xGex alloy is plotted versus film thickness for five different roughness values of 0.05, 0.1, 0.25, 0.5, and 1 nm at room temperature for germanium composition of 0.2. The solid lines represent the conductivity tending to the amorphous limit, and the dashed lines show the conductivity scaling with thickness below the amorphous limit. Increasing the roughness yields a gradual reduction in thermal conductivity, starting as the film thickness dips below 10 µm and reaching the amorphous limit as the thickness approaches the nanometer scale. (Inset) The same plot on a log–log scale to show the conductivity scaling linearly with thickness below the amorphous limit (dashed lines).
In the completely diffuse limit (p = 0), the boundary scattering rate is proportional to thickness, and the conductivity scales linearly with thickness. If the boundary scattering rates are allowed to scale with decreasing thickness above the  $\tau _{{\rm{max}}}^{ - 1}$, then the thermal conductivity gradually dips below the minimum value predicted by the minimum thermal conductivity model, often referred to as the amorphous limit, as shown by dashed in Fig. 4. In that case, our trends are in agreement with recent measurements below the amorphous limit by Feser et al.Reference Feser, Chan, Majumdar, Segalman and Urban41 More generally, our model connects the boundary specularity p with roughness, and p depends exponentially on the rms roughness Δ; when thickness is reduced to the point that boundary roughness becomes comparable to the thickness, the exponential dependence of conductivity on roughness becomes more prominent, and the conductivity would tend to zero at a slower rate than the linear dependence predicted by the completely diffuse model. Hence, the dependence of the thermal conductivity on thickness would also include the consideration of roughness, and the amorphous limit is reached when both roughness and thickness become comparable to the unit cell size (0.543 nm in Si). In addition to the thickness dependence, increasing the boundary roughness also produces a reduction in thermal conductivity due to increased boundary scattering, as indicated in Fig. 4, more emphasized in thin films before saturation is reached at large thickness values. Increasing the boundary roughness yields a reduction in thermal conductivity, more emphasized in larger samples as at smaller scales, the conductivity is already limited by the size of the sample, and increasing the boundary scattering will not reduce it further.
III. LATTICE THERMAL CONDUCTIVITY IN SiGe SLs
SiGe SLs are heterostructures composed of regular alternating layers of Si, Ge, or SiGe with varying alloy composition in each layer. The individual thickness of each layer in the repeated bilayer structure is on the order of a few nanometers to several tens of nanometers. SLs have been found both experimentally and theoretically to have thermal conductivity below that of bulk Si1−xGex alloys due to the combined effect of alloying and quantum confinement of particles due to nanostructuring. Bismuth-based SLs have been reported to possess very high figures of merit of around 2.6.Reference Venkatasubramanian, Siivola, Colpitts and O'Quinn42 The impact of the SL structure on lattice thermal conductivity has been attributed to a number of effects, such as phonon spectrum, phonon localization, and scattering of phonons at interfaces. Thermal conductivity of Si/Ge SLs samples was measured to be lower than that of the corresponding alloy films,Reference Huxtable, Abramson, Tien, Majumdar, LaBounty, Fan, Zeng, Bowers, Shakouri and Croke43 while in other materials, such as GaAs/InAs and bismuth-based SLs, the thermal conductivity was measured to be higher than that of the alloy film having equivalent overall composition. Initial research on lattice thermal conductivity in SLs was concentrated on lattice dynamics and the effect of periodicity on the phonon velocity,Reference Hyldgaard and Mahan44 but measured values of thermal conductivity could not be accounted for entirely by considering reflections at interfaces and reduction in phonon velocity due to confinement, measurements indicated an increase in thermal conductivity with increasing period thickness, conflicting the expected trend due to intrinsic effects.Reference Chen45
In SLs with small period thickness, phonons are scattered by atomic-scale roughness present at the boundaries between successive layers. This scattering is especially prominent in the cross-plane lattice thermal conductivity, which is governed by extrinsic rather than intrinsic effects.Reference Chen45–Reference Yang and Chen47 This is particularly true for Si/Ge and Si1−xGex SLs, where the large mismatch between lattice constants and other material properties can lead to significant imperfections and appreciable roughness at the interfaces between layers, typically having several monolayers (ML, where 1 ML ≈ 0.13 nm) of roughness between the dissimilar layers in the SL.Reference Huxtable, Abramson, Tien, Majumdar, LaBounty, Fan, Zeng, Bowers, Shakouri and Croke43 Therefore, interface properties, such as roughness,Reference Martin, Aksamija, Pop and Ravaioli48 transport direction, and crystal orientation,Reference Aksamija and Knezevic18 in addition to alloy composition,Reference Dismukes, Ekstrom, Steigmeier, Kudman and Beers49 are expected to play a significant role in thermal transport. They offer additional degrees of freedom to control the thermal conductivity in semiconductor nanostructures based on SLs, thereby opening up possibilities for further enhancement of the thermoelectric figure of merit through the reduction in lattice thermal conductivity. For Si/Ge and Si/Ge-alloy-based SLs, the interface properties, including roughness, transport direction, crystal orientation, as well as alloy composition play a critical role in thermal transport. Taking control over these properties can lead to reduction of lattice thermal conductivity yielding an enhancement of the TE figure of merit.
The dependence of the lattice thermal conductivity on the interface properties is explored in our model, based on solving the pBTE in the usual single-mode relaxation approximation. The model captures the important role of scattering from the atomic-scale roughness at the sample, interface, including the full dependence of the roughness scattering on the rms roughness height, angle, and phonon wave length, as well as the interaction between extrinsic roughness scattering and intrinsic (internal) scattering mechanisms, including phonon–phonon, alloy (mass-difference), and impurity scattering. Inside each layer of SL, every time the phonon reaches the boundary of that layer, one of two things must happen: the phonon will either continue traveling unscattered to the neighboring layer; this occurs in the case of a specular interaction, with probability given by the momentum-dependent specularity parameter  $p\left( {\vec q} \right)$, given earlier in Eq. (13). In the alternate case, called the diffuse case, the phonon will be scattered in a random direction with probability
 $1 - p\left( {\vec q} \right)$.Reference Aksamija and Knezevic19
In all of our calculations, the full thermal conductivity tensor καβ is calculated for each layer, in this case, each of the two layers in the repeating bilayer structure of the SL, as a sum over all phonon momenta and branchesReference Klemens50
 $${\kappa ^{\alpha \beta }}\left( T \right) = \mathop \mathop\sum \limits_{\rm{b}} \mathop\sum\limits_{\vec q} {{\tau _{\rm{b}}}\left( {\vec q} \right){C_{\rm{b}}}\left( {\vec q,T} \right)\upsilon _{\rm{b}}^\alpha \left( {\vec q} \right)\upsilon _{\rm{b}}^\beta \left( {\vec q} \right)} \quad ,$$
where  ${\tau _{\rm{b}}}\left( {\vec q} \right)$ is the total phonon relaxation time, including all intrinsic mechanisms as well as the roughness scattering at the boundaries of each layer given previously in Eq. (15). In the multilayer SL structure, there is an additional contact scattering term due to ballistic limits on the phonon mean free path imposed from the ends of the sample and given by
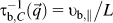 $\tau _{{\rm{b}},C}^{ - 1}\left( {\vec q} \right) = {{{\upsilon _{{\rm{b}},{\parallel} }}} \mathord{\left/ {\vphantom {{{\upsilon _{{\rm{b}},{\parallel} }}} L}} \right. \kern-\nulldelimiterspace} L}$.Reference Bae, Li, Aksamija, Martin, Xiong, Ong, Knezevic and Pop51 Phonons obey Bose–Einstein statics so their equilibrium distribution is given by the Bose–Einstein distribution function. The phonon heat capacity per mode
 ${C_{\rm{b}}}\left( {\vec q,T} \right)$ is consequently given by
 $${C_{\rm{b}}}\left( {\vec q,T} \right) = {{{{\left[ {\hbar {\omega _{\rm{b}}}\left( {\vec q} \right)} \right]}^2}} \over {{k_{\rm{B}}}{T^2}}}{{{e^{\left( {{{\hbar {\omega _{\rm{b}}}\left( {\vec q} \right)} \mathord{\left/ {\vphantom {{\hbar {\omega _{\rm{b}}}\left( {\vec q} \right)} {{k_{\rm{B}}}T}}} \right. \kern-\nulldelimiterspace} {{k_{\rm{B}}}T}}} \right)}}} \over {{{\left[ {{e^{\left( {{{\hbar {\omega _{\rm{b}}}\left( {\vec q} \right)} \mathord{\left/ {\vphantom {{\hbar {\omega _{\rm{b}}}\left( {\vec q} \right)} {{k_{\rm{B}}}T}}} \right. \kern-\nulldelimiterspace} {{k_{\rm{B}}}T}}} \right)}} - 1} \right]}^2}}}\quad .$$
We need to consider all phonon modes in the calculation of heat transport, although optical modes represent standing waves with very low-group velocities and hence contribute very little to the overall thermal transport relative to their acoustic counterparts.
The  $\upsilon _{\rm{b}}^{\alpha ,\beta }\left( {\vec q} \right)$ are the components of phonon velocity vector calculated from the full phonon dispersion based on Weber's ABC model. The ABC model includes interactions between ions, bond charges, bond bending, and long-range electrostatic interactions and has been shown to reproduce measured phonon vibrational frequencies in virtually all group IV,Reference Aksamija and Knezevic18,Reference Martin, Aksamija, Pop and Ravaioli48,Reference Weber52,Reference Rustagi and Weber53 III–V,Reference Rustagi and Weber53,Reference Strauch and Dorner54 and II–VIReference Rajput and Browne55 semiconductors with excellent accuracy. The ABC phonon dispersions for Si can be found in Refs. Reference Aksamija and Knezevic18 and Reference Weber52 and for Ge in Refs. Reference Weber52 and Reference Rustagi and Weber53. Vibrational properties of Si1−xGex alloys, including phonon dispersion and velocity, are calculated here in the virtual crystal approximation.Reference Abeles33 The full phonon dispersion allows us to accurately treat the inherent anisotropy, which arises out of the combination of phonon focusing and the momentum-dependent boundary roughness scattering. Despite the cubic symmetry of the crystal lattice, the addition of boundaries in one of the crystal directions breaks or alters part of the symmetry and increases the anisotropy of the thermal transport between the direction of transport and the direction normal to the boundaries. In general, since the boundary scattering rate for each phonon mode depends on the angle between its group velocity and the boundary normal, phonons interacting with the boundaries at low angles of incidence will undergo fewer and more specular collisions, thereby contributing more to transport in the direction parallel to the boundaries and increasing the anisotropy.
Thermal transport in semiconductor SLs can be separated into two main directions based on symmetry, with one being parallel and the other perpendicular to the plane of the layers. The direction perpendicular to the plane of the layers, which is called the cross-plane direction is typically of much more of interestReference Cahill, Braun, Chen, Clarke, Fan, Goodson, Keblinski, King, Mahan, Majumdar, Maris, Phillpot, Pop and Shi21,Reference Cahill, Ford, Goodson, Mahan, Majumdar, Maris, Merlin and Phillipot22 and will be the focus of our work. Our model successfully captures the in-plane transportReference Khitun, Balandin, Liu and Wang56,Reference Liu, Wang, Khitun and Balandin57 as well as the anisotropy between them, which is also briefly discussed. Once the thermal conductivity tensor for each of the two alternating layers is obtained, it can be decomposed into the two primary in-plane and cross-plane components. Owing to the cubic crystal symmetry of the underlying lattice, the tensor is diagonal. However, the diagonal components are not equal due to the periodic SL structure breaking the rotational symmetry. From the full thermal conductivity tensor Eq. (17), we can compute thermal conductivity by projecting it along any direction as  $\kappa = {\kappa ^{\alpha \beta }}{\hat n^\alpha }{\hat n^\beta }$ with
 $\hat n$ being the unit vector along the direction.Reference Aksamija and Ravaioli58 Subsequently, the conductivities of the two repeating layers in the SL will be combined in series for cross-plane transport and in parallel for in-plane transport; however, the cross-plane direction also has a small additional component of thermal resistance due to the acoustic mismatch between the layers, which adds a Kapitza resistance in series with the individual layers themselvesReference Aksamija and Knezevic19
 $$\eqalign{ & {\kappa _{{\rm{in}} - {\rm{plane}}}} = {{{L_1}\kappa _1^{xx} + {L_2}\kappa _2^{xx}} \over {{L_1} + {L_2}}}\quad , \cr & {\kappa _{{\rm{cross}} - {\rm{plane}}}} = {{{L_1} + {L_2}} \over {{{{L_1}} \over {\kappa _1^{yy}}} + {{{L_2}} \over {\kappa _2^{yy}}} + {1 \over {\sigma _1^{{\rm{AIM}}}}} + {1 \over {\sigma _2^{{\rm{AIM}}}}}}}\quad . \cr}$$
The acoustic impedance mismatch (AIM) term has been found to add only a minor correction to the overall thermal conductivity in the extreme case of a Si/Ge SL, and even smaller in alloy-based SLs due to smaller mismatch when both layers are composed of SiGe alloys.Reference Aksamija and Knezevic19
Our results show that the additional scattering of phonons at the imperfect interfaces separating the SL layers leads to a two orders-of-magnitude reduction of thermal conductivity from bulk to Si/Ge SLs, as shown in Figs. 5 and 6. The resulting thermal conductivity is below the alloy limit, meaning that it is lower than that of a Si1−xGex alloy with the same proportions of SiGe due to the additional boundary roughness scattering of phonons, especially the low-energy (long wave length) acoustic phonons, which are not strongly scattered by the Rayleigh-like mass-disorder scattering, given previously in Eq. (6). The lowest thermal conductivity is achieved when each of the layers is an alloy, which requires that the two layers are made up of different alloy compositions. In such a SL, thermal conductivity reaches almost to the amorphous limit due to the combined effect of strong mass-difference scattering internal to the alloy layer and strong roughness scattering at the boundaries between the alloy layers. In SLs, both period thickness and total length play an important role; however, total sample thickness is only significant when the roughness is small, and the phonon mean free paths are not interrupted by the roughness scattering at the layer boundaries before they can reach the sample ends, as shown for both pure Si/Ge (Fig. 5) and alloy SLs (Fig. 6). The thickness dependence (both on sample and period thickness) is more pronounced in pure Si/Ge SLs, where the absence of alloy mass disorder implies that the thermal conductivity reaches the bulk limit in thick samples. An enormous decrease in thermal conductivity relative to the bulk value can be clearly seen in Fig. 6, where both the layers are Si1−xGex alloys with different compositions of x = 0.2 and y = 0.8, in contrast to Fig. 5 where the layers are pure Si/Ge. Figure 7 and Fig. 8 show the in-plane conductivity for the Si/Ge and Si0.2Ge0.8/Si0.8Ge0.2 SLs. The in-plane thermal conductivity is higher due to the reduced effect of the boundary roughness scattering, which is more emphasized as the thickness of the individual layers is reduced. The inset figures show the anisotropy ratio (in-plane/cross-plane conductivity), which has the highest value at small layer thickness and saturates to a value of around 1.3 as the layer thickness is increased above 1 μm.
Room temperature cross-plane thermal conductivity of a Si/Ge SL versus SL bilayer period thickness (top, total sample thickness is 200 µm) and versus total sample thickness with period thickness of 10 nm (bottom), with five different boundary roughness values of 0.05, 0.1, 0.25, 0.5, and 1 nm. Increasing the boundary roughness yields further reduction in thermal conductivity, more emphasized in larger samples because at smaller scales, the conductivity is already limited by the overall size of the sample, and increasing the boundary scattering between successive layers will not reduce it further.
Room temperature cross-plane thermal conductivity of a Si1−xGex/Si1−yGey consisting of bilayers with germanium composition of x = 0.2 and y = 0.8, respectively. Results are plotted as a function of bilayer period thickness (top, total sample thickness is 200 µm) and as a function of total sample thickness (bottom, period thickness is 10 nm), with five different boundary roughness values of 0.05, 0.1, 0.25, 0.5, and 1 nm.
Room temperature in-plane thermal conductivity of a Si/Ge SL versus SL bilayer period thickness (total sample thickness is 200 µm), with five different boundary roughness values of 0.05, 0.1, 0.25, 0.5, and 1 nm. (Inset) The anisotropy ratio (in-plane/cross-plane conductivity) as a function of bilayer period thickness.
Room temperature in-plane thermal conductivity of a Si1−xGex/Si1−yGey consisting of bilayers with germanium composition of x = 0.2 and y = 0.8, respectively. Results are plotted as a function of bilayer period thickness with five different boundary roughness values of 0.05, 0.1, 0.25, 0.5, and 1 nm (the total sample thickness is 200 µm). (Inset) The anisotropy ratio (in-plane/cross-plane conductivity) as a function of total sample thickness showing increasing anisotropy as thickness is reduced.
In addition to the overall sample and period thickness, we consider the variation of the relative thickness of the two layers, while keeping both period and total sample thicknesses fixed at 20 nm and 200 µm, respectively. Results show that the lowest thermal conductivity occurs when the Si layer is thinner than the Ge layer in pure Si/Ge SLs, as shown in Fig. 9 (top), due to the lower intrinsic thermal conductivity of Ge (κ ≊ 56 W/mK at room T Reference Glassbrenner and Slack3). In contrast, alloy SLs have lower thermal conductivity when the Si-heavy layer (with x = 0.2 of Ge) is dominant (thicker) and the second Ge-heavy layer (with y = 0.8) is thinner, as shown in Fig. 9 (bottom). This is again caused by the layer possessing lower thermal conductivity being preferred; in the alloy case, it is predominantly the Si layer, which has lower conductivity (as seen from the asymmetry of the curves toward the Si side in Fig. 2, especially in the bulk case) due to the smaller Si mass being further from the alloy average than the heavier Ge mass, causing more mass-disorder scattering, as defined in Eq. (5). Hence we conclude that the composition must be taken into account carefully when designing SiGe SLs for thermoelectric applications because the lattice thermal conductivity will in general be minimized by making the layer with lower thermal conductivity thinner; for example, in a SL where only one layer is composed of an alloy (while the other is either pure Si or pure Ge), the non-alloy layer should be made as thin as possible to emphasize the contribution from the roughness scattering, while the alloy layer can be made thicker, since the mass-disorder will keep its conductivity low. The quantum dot SL system measured in Refs. Reference Shamsa, Liu, Balandin and Liu59 and Reference Shamsa, Alim, Balandin, Bao, Liu and Liub60 has alternating layers of silicon and SiGe quantum dots, which are around 1–2 nm thick. The diameter of these dots is smaller than the average phonon mean free path, and they form very efficient scattering sites. In our model, we can treat this as layers of silicon separated by very rough boundaries, with 20 nm thick Si layers and boundary roughness of 1.2 nm, the thermal conductivity is 12.1 W/mK, very close to the measured value of 11 W/mK with 20 nm Si layer and quantum dot layer of 1.2 nm.
Room temperature lattice thermal conductivity of a Si/Ge (top) and a Si1−xGex/Si1−yGey (bottom) consisting of bilayers with germanium composition of x = 0.2 and y = 0.8. The period thickness was held fixed at 20 nm, and total sample thickness was 200 µm, while the thickness of the first layer (Si and Si1−xGex in top and bottom panels, respectively) is varied from 0 to 20 nm.
IV. THERMAL CONDUCTIVITY IN SiGe ALLOY NANOCOMPOSITES
SiGe SLs have been considered as efficient thermoelectrics because of their low-thermal conductivity, below that of bulk SiGe alloys. The high cost of growing SLs requires us to switch from SLs to SiGe-based nanocomposites, which have similar effects. Nanocomposites are made by relatively simple and inexpensive mechanical processing of materials, typically involving ball milling the bulk material into a fine powder of nanoscale grains, followed by spark plasma sintering into a nanostructured bulk composite.Reference Lan, Jerome Minnich, Chen and Ren61 Because the lattice thermal conductivity of SiGe SLs is reduced by scattering from rough boundaries between layers, it is expected that grain boundary properties, for example roughness, orientation, and composition, will also substantially effect thermal transport in nanocomposites, resulting in many ways of adjusting their thermal conductivity by manipulation of grain size, shape, and crystal angle distributions. Hence nanocomposites can be designed to improve ZT by reducing lattice thermal conductivity by a combination of approaches, including additional scattering of phonons from the interfaces between nanoscale grains of dissimilar materials, alloys of different compositions, or grains with different crystal orientations.
Our model has the ability to capture the full structure of the nanocomposite and calculate the combined effect of grain boundary scattering and scattering internal to the grains (arising from various “bulk” mechanisms, such as anharmonic 3-phonon interactions as well as alloy, isotope, and impurity mass-difference scattering), without resorting to the often-used Mathiessens rule, which treats all mechanisms, including the extrinsic scattering at the boundaries, as completely independent. The model is based on solving the pBTE with partially diffused boundary conditions at the grain boundaries, similar to the model described previously in Sec. II but modified to capture fully the complex heterogenous structure of the nanocomposite. To do so, Voronoi tessellation is used to discretize the material into grains, which resemble closely the complex random grain structure of real nanocomposites. We discretize a cubic region, typically several micrometers in each direction, using the Voronoi tessellation (VT) technique, which starts with set of seed points and determines division of that space into distinct and nonoverlapping polyhedra. The VT follows the rules for constructing Wigner–Seitz cells except on the scale of grains rather than lattice cells. Once the VT is complete, it provides us with critical information about the morphology of the nanocomposite, including the size of each individual grain, the grain size distribution, their interconnectivity (who the neighbors of each grain are), as well as the area of the contact region between neighboring grains.Reference Aksamija20
Once grain boundaries are introduced, the solution becomes position-dependent along the direction of propagation of the phonon mode  $\left( {{\rm{b}},\vec q} \right)$ because of two competing processes: one is scattering at the grain boundaries, which partially randomizes the direction of propagation of the incoming phonons, and the other is scattering inside the grain. At the grain boundary, phonons will interact with the atomic-scale roughness, which is formed at the boundary during the growth of the nanocomposite. Some fraction
 $p\left( {\vec q} \right)$ of the incoming phonons will pass through unchanged (coherent or specular part), while the rest
 $\left[ {1 - p\left( {\vec q} \right)} \right]$ will be absorbed by the boundary and re-emitted in a random direction (diffuse part). An effective scattering rate
 $\Gamma _i^{{\rm{GBR}}}$ due to the interactions of phonons with the GBR in the i-th grain can be defined by averaging the pBTE solution over the volume of each grainReference Carruthers23,Reference Wang and Mingo62 to obtain the final expression for the effective GBR scattering rate
 $${1 \over {\tau _{{\rm{b}},i}^{{\rm{GBR}}}\left( {\vec q} \right)}} = {{{\upsilon _{\rm{b}}}\left( {\vec q} \right)} \over {{D_i}}}{{{F_{{\rm{b}},i}}\left( {\vec q} \right)} \over {\left[ {1 - {{\Lambda _{\rm{b}}^{{\rm{int}}}\left( {\vec q} \right)} \over {{D_i}}}{F_{{\rm{b}},i}}\left( {\vec q} \right)} \right]}}\quad ,$$
with D i being the average distance a phonon travels inside the i-th grain. D i can be related to the cubic root of the volume of the grain V i, calculated for each grain from the VT, as  ${D_i} = {f_i}S_i^{{1 \mathord{\left/ {\vphantom {1 3}} \right. \kern-\nulldelimiterspace} 3}}$, where f i is the dimensionless form factor, which captures the peculiarities of the specific geometry of each grain. For grains roughly approximated as disks,
 $f = {8 \mathord{\left/ {\vphantom {8 {3{\pi ^{{3 \mathord{\left/ {\vphantom {3 2}} \right. \kern-\nulldelimiterspace} 2}}}}}} \right. \kern-\nulldelimiterspace} {3{\pi ^{{3 \mathord{\left/ {\vphantom {3 2}} \right. \kern-\nulldelimiterspace} 2}}}}} \approx 0.48$. The parameter
 ${F_{{\rm{b}},i}}\left( {\vec q} \right)$ fully captures the competition between GBR scattering at the boundaries of the grain and internal scattering inside the grain and is completely analogous to the one given previously for thin films, with D i replacing the film thickness L. The GBR scattering rate
 ${1 \mathord{\left/ {\vphantom {1 {\tau _{{\rm{b}},i}^{{\rm{GBR}}}\left( {\vec q} \right)}}} \right. \kern-\nulldelimiterspace} {\tau _{{\rm{b}},i}^{{\rm{GBR}}}\left( {\vec q} \right)}}$ in Eq. (20) can be added to the rates due to intrinsic scattering processes internal to the grain to obtain the total scattering rate of mode
 $\left( {{\rm{b}},\vec q} \right)$ in grain i as
 ${1 \mathord{\left/ {\vphantom {1 {{\tau _{{\rm{b}},i}}\left( {\vec q} \right)}}} \right. \kern-\nulldelimiterspace} {{\tau _{{\rm{b}},i}}\left( {\vec q} \right)}} = {1 \mathord{\left/ {\vphantom {1 {\tau _{\rm{b}}^{{\rm{int}}}\left( {\vec q} \right)}}} \right. \kern-\nulldelimiterspace} {\tau _{\rm{b}}^{{\rm{int}}}\left( {\vec q} \right)}} + {1 \mathord{\left/ {\vphantom {1 {\tau _{{\rm{b}},i}^{{\rm{GBR}}}\left( {\vec q} \right)}}} \right. \kern-\nulldelimiterspace} {\tau _{{\rm{b}},i}^{{\rm{GBR}}}\left( {\vec q} \right)}}$.
In the steady state, the net heat flux through the boundary of each grain must be zero. Therefore, fluxes in and out of its neighbors and any external heating source Q i applied to i-th grain must add to zero. This assertion allows us to calculate the temperature T i inside the i-th grain from
 $$\mathop \sum \limits_{j = n.n.} {G_{ij}}\left( {{T_i} - {T_j}} \right) + {S_i}{Q_i} = 0\quad ,$$
with the summation index j running over all the grains that neighbor grain i. The thermal conductance G ij between neighboring grains i and j is given by the usual expression
 $${G_{ij}} = {{\left[ {{d_i}{\kappa _i}\left( {{T_i}} \right) + {d_j}{\kappa _j}\left( {{T_j}} \right)} \right]{A_{ij}}} \over {d_{ij}^2}}\quad ,$$
with κi being the thermal conductivity of the i-th grain including the corresponding GBR scattering rate. Here, d ij = d i + d j is the distance between the centers of the two grains, i.e., the length of the straight line connecting the two centers, while d i and d j are the lengths of the line's segments inside the i-th and j-th grains, respectively. A ij is the surface area of the grain contact region separating the two grains. This way, we effectively obtain a thermal resistor network, which can be solved iteratively, repeatedly updating the temperature of each grain based on the past values of the temperatures of its neighbors until convergence.Reference Braginsky, Lukzen, Shklover and Hofmann63
We apply a heat sink to the outer grains in the simulation domain so that the boundary condition on temperature outside of radius r 2 is kept constant. We apply a heat source Q to the grains inside a radius r 1 = 1 µm around the center and allow heat to diffuse. Q is determined, upon iteration of the temperature, to ensure the peak temperature in the center to be a few Kelvin (≈1%) above the temperature of the heat sink. Convergence is reached when the total flux entering each grain equals the flux leaving it, and the temperatures of all grains reach a constant value. After the temperature throughout the simulation domain reaches steady state (measured by the relative change in the temperature from one iteration to the next), the effective thermal conductivity is extracted using the below equation
 $${\kappa _{{\rm{eff}}}} = {{Q\log \left( {{{{r_2}} \over {{r_1}}}} \right)} \over {2\pi \left( {{T_1} - {T_2}} \right)}}\quad .$$
Effective thermal conductivity depends on the direction of heat propagation inside the nanocomposite, leading to strong directional anisotropy, which arises from the local morphology of the grains, their sizes, and interconnections.
Reduction of the thermal conductivity from its bulk value is achieved, as shown in Fig. 10 (top). The room temperature value of lattice thermal conductivity decreases with average grain size, analogous to the thickness dependence in thin films and SLs discussed in previous sections. The dependence is gradual and begins at grain sizes of several micrometers, and saturates toward the amorphous limit as grain size approaches the nanometer scale. On the other hand, the shape of the grain size distribution appears to have little effect, at least in alloy nanocomposites, as both uniform and randomly distributed grain sizes lead to the same thermal conductivity for a given average grain size.
Thermal conductivity of a Si1−xGex nanocomposite with germanium composition of x = 0.2 is plotted versus average grain size for both uniform and randomly distributed grains (top). The results were simulated at room temperature for a fixed number of grains. Strong grain size dependence of thermal conductivity is observed below 10 μm and progressively lower values are achieved with reduced average grain size due to increased phonon scattering at the grain boundaries. Room temperature thermal conductivity of a Si/Si0.8Ge0.2 nanocomposite is plotted versus the percentage of Si0.8Ge0.2 grains (bottom).
We expect further reduction in thermal conductivity by making a nanocomposite with grains comprising of different materials/compositions due to increased mass-difference scattering. This trend is observed when a nanocomposite is made of intermixed Si and SiGe grains as shown in Fig. 10 (bottom). Hence we conclude that reducing grain size into the nanometer regime or adding nanoscale grains into the bulk matrix is the most effective way to reduce thermal conductivity in nanocomposites, with the additional benefit of lower cost and simpler fabrication than SLs. At such scales, energy filtering effects are expected to lead to a boost, rather than a reduction, in the electronic power factor.Reference Zebarjadi, Esfarjani, Bian and Shakouri64 In addition, we find that our detailed model based on the Voronoi tessellation and the pBTE solution in each grain captures the grain structure of the nanocomposite and its impact on the thermal conductivity much more directly than empirical approaches, such as the effective medium approximation.Reference Aksamija20
V. CONCLUSIONS
In this paper, we considered the lattice thermal conductivity in nanostructured SiGe alloys, including thin films, SLs, and nanocomposites. By solving phonon Boltzmann equation along with use of the full phonon dispersion and a momentum-dependent model for phonon scattering with boundary roughness, we were able to capture the interplay between intrinsic (internal to the material) and extrinsic (size-dependent) effects. In addition, to treat the complex heterogenous structure of nanocomposites, a Voronoi tessellation model for grain structure was used. Our results show highly reduced thermal transport in SiGe nanostructures far below their bulk alloy counterparts, reaching below the alloy limit to the ultimate amorphous limit of thermal conductivity. We also demonstrate that thermal transport in SiGe nanostructures is highly tunable by sample size (thin films), period thickness (SLs), and grain size (nanocomposites) through boundary scattering. Our results are relevant to guiding the design of nanostructured SiGe alloys for thermoelectric applications.



