I. INTRODUCTION
Hardness is used as an indicator of the resistance to wear due to sliding contact in tribology. For example, the Archard sliding wear equation shows that sliding wear rate is inversely proportional to hardness.Reference Archard1 Hardness is also used to measure the yield stress of elasto-plastic materials by a simple 3-fold relationship between the hardness and the yield stress.Reference Tabor2 Due to these reasons, it is always an interesting research topic to study the hardness of the material, which includes the understanding of the measured hardness and the relationship between hardness and fundamental properties of materials.Reference Cheng and Cheng3,Reference Cheng and Cheng4 With the development of nanoindentation instruments, hardness can be easily and accurately measured at micro- and nanoscales. A well-known research topic on the hardness of ordinary elasto-plastic materials is its depth dependence, also called the size effect. The measured hardness, by using a sharp Berkovich or Vickers indenter, increases with the decrease in the indentation depth when the depth is in a submicrometer regime.Reference Ma and Clarke5,Reference McElhaney, Vlassk and Nix6 This size effect has been successfully explained by the concept of geometrically necessary dislocations in the strain gradient plasticity theory.Reference Nix and Gao7 It was shown that the depth dependence of the hardness follows an inverse square-root power law. However, the measured hardness of elasto-plastic materials by using a spherical indenter, here named as spherical hardness, is not sensitive to the indentation depth.Reference Huang, Zhang, Hwang, Nix, Pharr and Feng8,Reference Swadener, George and Pharr9
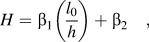
Due to the superelasticity (SE) and shape memory effect (SME), NiTi shape memory alloys (SMAs) have found many important applications from nano- to macroscale such as thermo-mechanical high-density data storage, nano-dampers, microvalves, micropumps, and implant surgery.Reference Shaw, Trethewey, Johnson, Drugan and Crone10–Reference Li, Rao, Rong and Li12 There is a growing interest in probing the mechanical properties of SMAs at micro- and nanoscales by using the nanoindentation techniques. Unlike ordinary elasto-plastic materials, SMAs react to the mechanical load of indentation through phase transformation.Reference Shaw, Stone, Johnson, Ellis and Crone13–Reference Huang, Su, Hong and Yang16 Our recent experimental study on the hardness of SMAs from a sharp Berckovich indenter shows that the hardness increases with the decrease in the depth at small indentation depths.Reference Amini, Yan and Sun17 This depth-dependence of the hardness of SMAs with a sharp indenter is different from that of the ordinary elasto-plastic materials. It was proposed that the size effect in the measured hardness of SMAs with a sharp indenter is attributed to the competition of bulk and interfacial energy terms in the phase transformation process.Reference Amini, Yan and Sun17 Following this hypothesis, the hardness H of SMAs with a sharp indenter as a function of the indentation depth h has been derived as,
 $$H = {{\rm{\beta }}_1}\left( {{{{l_0}} \over h}} \right) + {{\rm{\beta }}_2}\quad ,$$
where β1 and β2 are two material constants and l 0 is the characteristic thickness of the interface between the transformed martensite zone and the untransformed austenite zone. Equation (1) clearly shows that the hardness H decreases with the indentation depth h by following an inverse law if h is comparably as small as the characteristic thickness of the interface l 0. If h is significantly larger than l 0, the hardness will degenerate to a constant. Equation (1) agrees very well with the measured hardness data of NiTi SMAs with a sharp indenter.Reference Amini, Yan and Sun17 Note that indenters with a spherical tip are also commonly used in nanoindentation tests. Therefore, we continued our experimental study on the hardness of NiTi SMAs with spherical indenters. It was found that the spherical hardness is also depth-dependent but in an opposite trend. The detailed experimental study and the possible mechanism behind the observed depth dependence of the spherical hardness with the support of a numerical investigation are presented in this paper.
II. EXPERIMENTAL SETUP
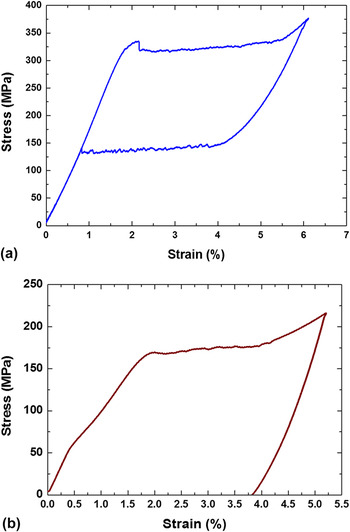
Commercial 500-μm-thick superelastic (SE) and shape memory effect (SME) NiTi polycrystalline sheets were purchased from Memory Applications Inc. (San Jose, CA). The grain size of the polycrystalline samples was in the range of 50–100 nm as measured by transmission electron microscopy. With a differential scanning calorimeter (DSC 92, SETARAM, Caluire, France), the martensite finish (Mf) and start temperature (Ms), the austenite start (As) and finish temperature (Af), were, respectively, measured as Mf = −2 °C, Ms = 18 °C, As = −10 °C, and Af = 19 °C for the SE sample. The transformation temperatures for the SME sample are Mf = −54 °C, Ms = −10 °C, As = 33 °C, and Af = 50 °C, respectively. To understand the basic mechanical properties of these materials, uniaxial tensile tests were carried out at room temperature by using an INSTRON machine at a strain rate of around 2 × 10⁻³/min. Figures 1(a) and 1(b) show the stress–strain curve due to a complete loading–unloading cycle for the SE sample and the SME sample, respectively. For the SE sample, the strain due to phase transformation from austenite phase to martensite phase during loading is completely recovered in the reserve transformation from martensite phase to austenite phase during unloading. As a result, there is no residual strain after complete unloading. On the contrary, for the SME sample, the reverse transformation cannot occur during unloading at room temperature and the transformation strain during the loading from austenite phase to martensite phase resides in the sample. Figure 1(a) also indicates that the SE sample has a maximum phase transformation strain value of εtr = 3.2% and a forward phase transformation stress of σf = 325 MPa. According to Fig. 1(b), εtr = 3.8%, σf = 175 MPa for the SME sample.
Uniaxial stress–strain curves due to a loading–unloading cycle of the NiTi SMA samples used in the spherical indentation tests: (a) SE sample and (b) SME sample.

To prepare the specimens for the spherical indentation test, the NiTi sheets were cut into 5 × 5 mm pieces and polished by a series of silicon carbide and aluminum oxide sand papers (the minimum grain diameter is 0.5 μm) until the average surface roughness is less than 6 nm as checked by Wyko NT3300 Optical Profiler (Veeco Instruments Inc., Plainview, NY). Before the experiments, both the SE and SME materials were heated to 100 °C and then gradually cooled down to room temperature (∼23 °C) so that a 100% austenite phase was retained. Nanoindentation tests were conducted in a quasistatic mode by using TI 900 Triboindenter from Hysitron (Eden Prairie, MN) for the SME sample and NanoTest from Micro Materials Ltd (Wrexham, UK) for the SE sample at room temperature. Simple loading and unloading schemes with low loading/unloading rates were applied to the sample to avoid the loading rate effect on the results.Reference Amini, He and Sun18 Spherical indenters with tip radii of 3.61 and 5 μm were used. The two indenter tips were examined carefully and their radii were measured by scanning electron microscope. No major defects were detected on the tip surface. For the spherical indenter of 3.61-μm tip radius, the maximum indentation loads in the tests were from 1 to 10 mN with a loading rate of 2 mN/s, whereas for the spherical indenter of 5-μm tip radius, the maximum indentation loads were from 1 to 25 mN with a constant rate of 1 mN/s. The load magnitudes were selected to avoid or minimize plastic deformation.
III. EXPERIMENTAL RESULTS
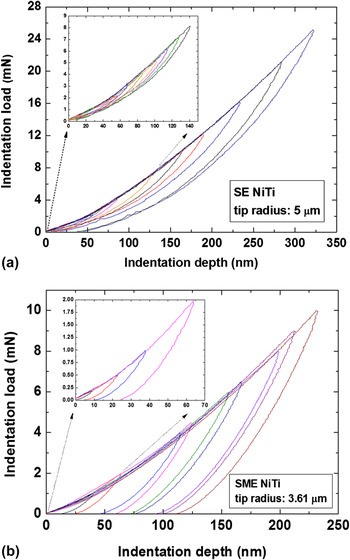
Figure 2(a) shows the room temperature indentation load–depth curves for the SE sample using the spherical indenter of 5-μm tip radius. The indentation loading–unloading loops indicate that phase transformation takes place under all specified indentation loads. When the indentation load is less than 12 mN, all the indentation depth can be recovered completely due to the reverse phase transformation during unloading. There is only a small residual indentation depth at a larger indentation load, which demonstrates that plastic deformation is ignorable in the indentation response of the material. Figure 2(b) shows the room temperature indentation curves for the SME sample from the spherical indenter of 3.61-μm tip radius. In contrast to Fig. 2(a), the reverse phase transformation of the SME sample did not occur during unloading and a major portion of the depth remains after unloading.
(a) Indentation curves for SE sample from the spherical indenter of 5-μm radius. (b) Indentation curves for SME sample from the spherical indenter of 3.61-μm radius.

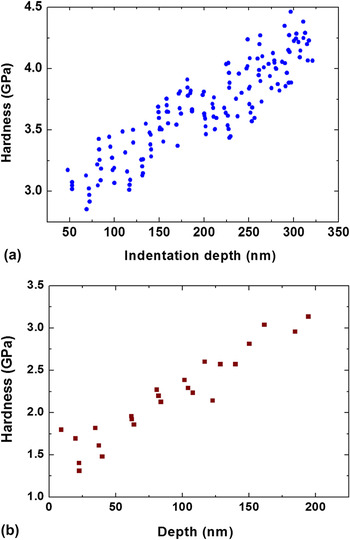
The spherical hardness values of the SE and SME samples were calculated from the measured indentation load–depth curve using the Oliver–Pharr method,Reference Oliver and Pharr19 as shown in Fig. 3(a) for the SE sample and in Fig. 3(b) for the SME sample. It is seen that the spherical hardness increases with the indentation depth. For the SE sample, the average hardness increased from ∼3 GPa at the depth of ∼50 nm to ∼4.5 GPa at the depth of ∼300 nm [see Fig. 3(a)]. For the SME sample, the hardness increased from ∼1.25 GPa at the depth of ∼25 nm to ∼3.25 GPa at ∼200 nm [see Fig. 3(b)]. This depth dependence of the spherical hardness of SMAs is opposite to the recently reported sharp indenter hardness, which decreases with the increase in indentation depth.Reference Amini, Yan and Sun17 In the following, we present an explanation for such an anomalous depth dependency in spherical indentation hardness of SMAs.
Depth-dependent spherical hardness: (a) SE sample from the indenter of 5-μm radius, (b) SME sample from the indenter of 3.61-μm radius.

IV. NUMERICAL INVESTIGATION AND DISCUSSION
A. Contribution of interfacial energy
For a sharp indenter, the energy analysis shows that the contribution of the energy of the interface between transformed martensite and original austenite phases exceeds that of the bulk energy when the indentation depth is less than 500 nm.Reference Amini, Yan and Sun17 This fact leads to the hardness decrease with the increase in indentation depth, as demonstrated by Eq. (1). To understand the opposite depth dependency of the spherical hardness, it is hypothesized that the contribution of the interfacial energy to the hardness in a spherical indentation is not as dominant as in a sharp indentation.
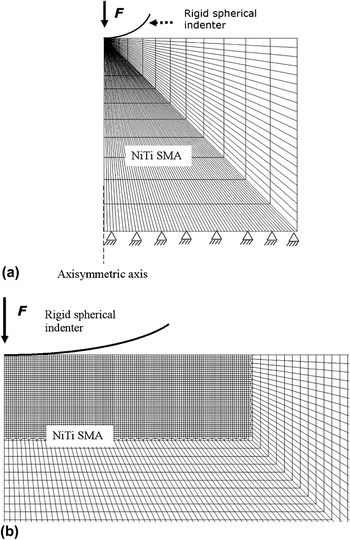
To validate the hypothesis, the finite element (FE) method was applied to simulate spherical indentation tests of SMAs. A spherical indentation test is simulated by using an axisymmetric FE model, which is illustrated in Fig. 4. The indenter tip in the experimental test is made of diamond. Since the Young’s modulus of a diamond is much larger than that of SMAs, the diamond is assumed as a rigid surface in the numerical simulation. Our previous and current numerical study indicates that friction between the indenter and the specimen has negligible effect on the indentation result, which includes hardness.Reference Yan, Sun and Liu20 Therefore, the contact between the indenter and the specimen is treated as frictionless in the FE model. The size of the entire model is much larger than the radius of the indentation tip and the size of the transformation zone. The bottom of the model is therefore constrained in both radial and axial directions. As demonstrated in Fig. 4b, a very fine mesh with the shortest element side of 25 nm is used in the transformation zone beneath the indenter tip to ensure the accuracy of the numerical results. The model contains a total of 8300 four-noded axisymmetric elements. Testing results for elastic contact were verified by comparison with the Hertz contact theory.
Axisymmetric FE model to simulate indentation test with a rigid spherical indenter: (a) entire FE mesh and boundary conditions; (b) fine mesh near the intender tip.

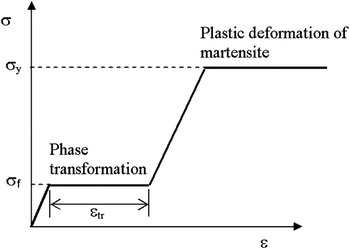
As the purpose of this FE study is to investigate the indentation responses under the maximum indentation load, there is no need to simulate unloading. The deformations due to transformation and due to possible plastic deformation of the transformed martensite were simulated by using “a two-step shaped” stress–strain relationship,Reference Kang and Yan21,Reference Kang and Yan22 as illustrated in Fig. 5. A modest plastic yield stress of 1000 MPa for the martensite phase was applied in the computer simulations based on our experimental test, and the elastic moduli of the SE and SME samples are, respectively, 20 and 10 GPa (see Fig 1). The phase transformation stresses obtained from Fig. 1 are, respectively, 325 MPa for the SE and 175 MPa for the SME sample in our simulations. Our numerical results confirmed that the volume of the plastic zone is no more than 5% of that of the phase transformation zone for the SE sample when the indentation depth is less than 300 nm, whereas the plastic zone does not exist for the SME sample when the depth is less than 250 nm.
A “two-step shaped” stress–strain curve to simulate the deformations due to phase transformation and plasticity of a SMA under indentation loading process.

The total Gibbs free energy (G) of the indentation system either with a spherical indenter or a sharp indenter can be expressed as
 $$G \,= \,\,{U_{{\rm{external}}}} + {U_{{\rm{interface}}}} + {U_{{\rm{bulk}}}} \cr\,= - F{\rm{ \times }}h + {U_{{\rm{interface}}}} + {U_{{\rm{bulk}}}}\quad ,$$
where U external is the potential energy of the external indentation force F, h is the indentation depth, U bulk is the change in bulk energy (misfit strain energy and chemical free energy) of the transformed volume (from the austenite to martensite), U interface is the interfacial energy of the martensite zone. Obviously, U bulk is proportional to the phase transformation volume V m and U interface is proportional to the interfacial area A i, and the interface thickness l 0 is a portion of the proportional coefficient. Therefore, the total Gibbs energy becomes:
 $$G \,= {U_{{\rm{external}}}} + {U_{{\rm{interface}}}} + {U_{{\rm{bulk}}}} \cr\,= - F{\rm{ \times }}h + {{\rm{\alpha }}_1}{A_{\rm{i}}}{l_0} + {{\rm{\alpha }}_2}{V_{\rm{m}}}\quad ,$$
where α1 and α2 are coefficients, which are not related to length scale. For a given indentation force F, the total Gibbs free energy G takes the minimum value at equilibrium state, which means,
 $${{\partial G} \over {\partial h}} = 0\quad .$$
Substituting Eq. (2b) into Eq. (3), we have:
 $$F = {{\rm{\alpha }}_1}{{\partial ({A_{\rm{i}}}{l_0})} \over {\partial h}} + {{\rm{\alpha }}_2}{{\partial {V_{\rm{m}}}} \over {\partial h}}\quad .$$
Denoting A as the projected contact area under indentation force F, the hardness H can be expressed as
 $$H = {F \over A} = {{{{\rm{\alpha }}_1}} \over A}{{\partial ({A_{\rm{i}}}{l_0})} \over {\partial h}} + {{{{\rm{\alpha }}_2}} \over A}{{\partial {V_{\rm{m}}}} \over {\partial h}}\quad .$$
Note that Eq. (1) can be derived from Eq. (5) for a sharp indenter.Reference Amini, Yan and Sun17Eq. (5) indicates that hardness consists of two terms. The first term represents the contribution of the interfacial energy and the second term represents the contribution of the phase transformation zone volume energy. Therefore, for a given SMA, the contribution of the interfacial energy to the indentation hardness comparing to the phase transformation zone volume energy can be evaluated by the ratio of the first term in Eq. (5) to the second term in Eq. (5). Taking away the coefficient of the ratio, we define the contribution of the interfacial energy to the hardness of SMAs as:
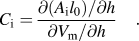 $${C_{\rm{i}}} = {{\partial \left( {{A_{\rm{i}}}{l_0}} \right)/\partial h} \over {\partial {V_{\rm{m}}}/\partial h}}\quad .$$
It is evident that C i depends on the indenter tip radius R and the indentation depth h. Denote  $C_{\rm{i}}^R$ and
 $C_{\rm{i}}^S$ as the ratio defined by Eq. (6) for a spherical indenter and for a sharp indenter, respectively. The relative contribution of the interfacial energy to the hardness in a spherical indentation with respect to that in a sharp indentation can be evaluated by the ratio of
 $C_{\rm{i}}^R$ to
 $C_{\rm{i}}^S$, i.e., the relative contribution
 $c_{\rm{i}}^{\rm{R}}$ can be estimated as:
 $$c_{\rm{i}}^{\rm{R}} = {{C_{\rm{i}}^R} \over {C_{\rm{i}}^S}}\quad .$$
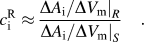
After introducing these concepts, a numerical value of the relative contribution  $c_{\rm{i}}^{\rm{R}}$ can be obtained from the FE simulations without knowing the interfacial thickness l 0. The numerical approximation for the relative contribution can be expressed as
 $$c_{\rm{i}}^{\rm{R}} \approx {{\Delta {{\left. {{A_{\rm{i}}}/\Delta {V_{\rm{m}}}} \right|}_R}} \over {\Delta {{\left. {{A_{\rm{i}}}/\Delta {V_{\rm{m}}}} \right|}_S}}}\quad .$$
The subscripts R and S in Eq. (7b) represent spherical indenter and sharp indenter, respectively. ΔA i and ΔV m are, respectively, the change in interfacial area and the change in phase transformation zone volume during a same small change of the indentation depth. A method to approximately estimate the phase transformation zone, and therefore A i and V m, is proposed and detailed in Appendix.
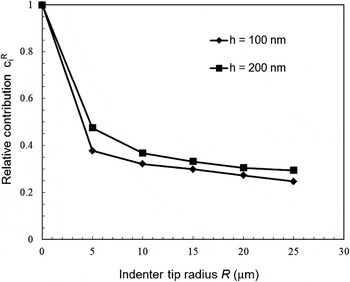
As numerical examples, Fig. 6 shows the influence of the indenter tip radius R on the relative contribution of the interfacial energy  $c_{\rm{i}}^{\rm{R}}$ to the hardness for a typical NiTi SMA at two different indentation depths h = 100 nm and h = 200 nm. In these simulations, the material properties are chosen as E = 50 GPa, σy = 1000 MPa, σf = 100 MPa, and εtr = 4%. R = 0 corresponds to a sharp indenter. In this case, the relative contribution
 $c_{\rm{i}}^{\rm{R}}$ has a value of 1.0. Once the indenter changes to a spherical indenter, i.e., R ≠ 0,
 $c_{\rm{i}}^{\rm{R}}$ drops quickly. For instance,
 $c_{\rm{i}}^{\rm{R}}$ is less than 0.4 with R = 5 μm at the indentation depth of h = 100 nm. Additionally, the two curves in Fig. 6 confirm that the influence of the interfacial energy on the hardness decreases with the increase of the indenter tip radius. At R = 25 μm, its influence is reduced by 75% (
 $c_{\rm{i}}^{\rm{R}} = 25\%$) in the case that the indentation depth is 100 nm.
The influence of the indenter tip radius on the relative contribution of the interfacial energy to the hardness for a typical NiTi SMA at two different indentation depths h = 100 nm and h = 200 nm.

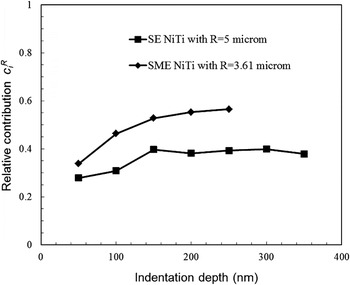
The experimental spherical indentation tests for the two SE and SME NiTi alloys were directly simulated by using the FE model. The numerical results of the relative contribution of the interfacial energy to the spherical hardness are plotted at different indentation depths in Fig. 7. It can be seen that the influence of the interfacial energy on the spherical hardness has been significantly reduced by more than 45% in the examined indentation depth for both the SE and SME samples. Based on these numerical results presented in Figs. 6 and 7, it can be concluded that the influence of the interfacial energy on the spherical hardness is not as significant as on the sharp indentation hardness. It is worth mentioning that interfacial energy is not considered in the FE analysis. An advanced constitutive model including interfacial energy is required to accurately predict the interface area. In addition, the experimental observation of depth dependence of the spherical hardness of SMAs agrees with the previously published numerical results,Reference Yan, Sun and Liu23 where the interfacial energy was not involved. This fact further confirms the hypothesis that the contribution of interfacial energy to the spherical hardness is not as dominant as to the sharp indentation hardness.
Numerical results to show the relative contribution of the interfacial energy to the spherical hardness for the SE sample and SME sample at different depths.

Additionally, the interfacial area A i only depends on indentation depth h and A i is proportional to h 2 under a sharp indenter, which leads to the inverse depth dependency of the hardness.Reference Amini, Yan and Sun17 In contrast, the interfacial area A i depends on two length scales, indentation depth h and tip radius R in a spherical indentation. As a result, the contribution of the interfacial energy on spherical hardness, i.e., the first term in Eq. (5), cannot be guaranteed to increase with the decrease in indentation depth in a spherical indentation test.
B. Contribution of elastic contact and phase transformation deformation
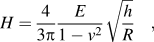
In fact, the anomalous experimental finding of the spherical hardness (i.e., spherical hardness increases with the indentation depth) can be explained based on the elastic hardness with the contribution of phase transformation. According to Hertz theory for a purely elastic contact, the spherical hardness H of a linear elastic material under loading can be expressed asReference Johnson24
 $$H = {4 \over {3{\rm{\pi }}}}{E \over {1 - {v^2}}}\sqrt {{h \over R}}\quad ,}$$
where E is the elastic modulus and ν is the Poisson’s ratio. Equation (8) clearly indicates that the spherical hardness increases with the square root of the indentation depth for a purely linear elastic material. For SMAs, due to the large extra deformation from the phase transformation, as shown in Figs. 1(a) and 1(b), the above square-root law cannot be applied. However, as the elastic deformation still plays a dominant role, the increase in spherical hardness with indentation depth can still be observed.
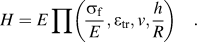
For the purpose of simplicity, assuming that the transformed martensite and parent austenite have the same elastic modulus E and the same Poisson’s ratio v, after neglecting the contribution of the interface to the indentation hardness, dimensional analysis indicates that the spherical hardness can be expressed asReference Yan, Sun and Liu23
 $$H = E\prod \left( {{{{{\rm{\sigma }}_{\rm{f}}}} \over E},{{\rm{\varepsilon }}_{{\rm{tr}}}},v,{h \over R}} \right)\quad .$$
Equation (9) clearly shows that spherical hardness depends on the elastic property (E and v) and the phase transformation property (σf and εtr), in addition on the indentation depth and indenter tip radius (h and R).
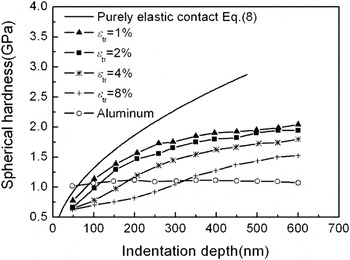
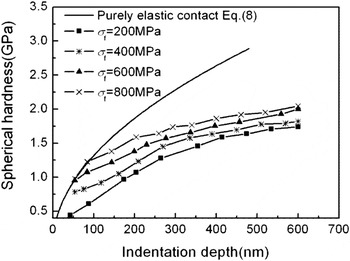
The role of the deformation due to phase transformation in the depth-dependent spherical hardness can be illustrated by the case studies shown in Fig. 8 and Fig. 9. In all the numerical simulations for SMAs in Fig. 8, the elastic modulus is 20 GPa and phase transformation stress is 325 MPa, which are consistent with the figure shown in Fig. 1(a), and the plastic yield strength of the transformed martensite has a value of 1000 MPa based on the tensile experiments.Reference Qian, Xiao, Sun and Yu25 The indenter tip radius is kept as 5 μm. It is worth reiterating that interfacial energy is not included in the numerical simulations. Under the same force, phase transformation makes the material soft and increases the depth. The contact area will be larger, and therefore, the depth dependence of the hardness will be less significant as compared with the purely elastic case. Additionally, a larger phase transformation strain εtr would lead to a lower spherical hardness H under the same indentation depth h, as shown in Fig. 8.
Numerical results of the spherical indentation hardness to illustrate the role of phase transformation with different phase transformation strain εtr, compared with purely elastic hardness and with that of aluminum.

Numerical results of the spherical indentation hardness to illustrate the role of phase transformation with different phase transformation stress σf, compared with purely elastic hardness.

For ordinary elasto-plastic materials, owing to a higher elastic modulus and a lower plastic yield strength, the indentation depth dominated by elastic deformation in a spherical indentation is too small to be captured. In other words, the spherical indentation hardness is mainly controlled by plastic deformation, not elastic deformation for ordinary elasto-plastic materials. As a result, the depth-dependent hardness due to elastic deformation cannot be easily observed in an ordinary elasto-plastic material. As an example, the spherical hardness of aluminum with E = 70 GPa and σy = 400 MPa from the indentation simulations with the same tip radius is presented in Fig. 8. As expected, the spherical hardness of the aluminum is depth independent.
Figure 9 illustrates the role of phase transformation on the spherical indentation hardness through changing the phase transformation stress σf . In all the simulations, E, v, εtr, and R are taken as 20 GPa, 0.3, 4% and 5 μm, respectively. It can be seen again that all the four hardness curves of the SMAs have a smaller slope than that of the purely elastic contact curve, which confirms that phase transformation weakens the dependency of the spherical hardness on the indentation depth. At a given indentation depth, i.e., loading, a smaller phase transformation stress σf leads to a larger phase transformation zone and a more compliant specimen. As a result, the spherical indentation hardness is smaller, which is affirmed by Fig. 9. On the other hand, if the phase transformation stress σf is large enough, at small indentation depths, phase transformation has not occurred. The spherical hardness in such situations will be completely determined by the purely elastic deformation, see the first two points of the curve with σf = 800 MPa.
V. CONCLUSION
Spherical indentation tests for both SE and SME NiTi specimens showed a significant increase in the hardness with the indentation depth. Such trend of depth dependence is not only opposite to the depth-dependent hardness of SMA NiTi in a test with a sharp indenter but also inconsistent with the spherical hardness of ordinary metallic materials. Numerical results indicate that the influence of interfacial energy, which is dominant at small depth in a sharp indentation, is not significant on the spherical indentation hardness of SMAs. The anomalous experimental finding can be explained by the elastic spherical contact theory incorporating the additional deformation effect of phase transformation of SMAs. Phase transformation mainly weakens the effect of a purely elastic spherical hardness, which is proportional to the square root of the depth. This study enriches our knowledge on the hardness for phase transforming materials with different indenters at micro and nanoscales.
ACKNOWLEDGMENTS
This study has been partially supported by the Hong Kong Research Grants Council under CERG Grant No. 620109. The computational simulations were carried out at the NCI National Facility in Canberra, Australia, which is supported by the Australian Commonwealth Government.
APPENDIX: NUMERICAL METHOD TO ESTIMATE THE INTERFACIAL AREA AND THE TRANSFORMATION ZONE VOLUME
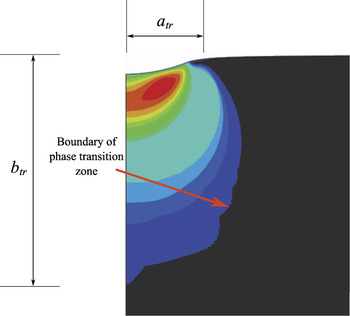
The method to estimate the interfacial area and the transformation zone volume from the FE simulations is detailed in this appendix. Applying the FE model presented in the paper, the spherical indentation test of SMAs can be simulated. Figure A1 shows a typical distribution of the phase transformation strain under indentation, which is used to define the phase transformation zone. The phase transformation zone boundary has the equivalent phase transformation strain value of 0.2%, which is the same as the plastic strain value used to define proof stress in classical elasto-plastic problems.
Phase transformation zone from the FE simulation of a typical spherical indentation test.

To estimate the interfacial area and the phase transformation zone volume, the irregular phase transition zone from the FE simulations is approximated by a cylinder with the radius of a tr and the depth of b tr. Both the parameters are defined in Fig. A1. The interfacial area A i can be estimated as
 $${A_{\rm{i}}} = 2{\rm{\pi }}a_{{\rm{tr}}}^{\rm{2}} + 2{\rm{\pi }}{a_{{\rm{tr}}}}{b_{{\rm{tr}}}}\quad .$$
The volume V m of the phase transformation zone can be estimated as
 $${V_{\rm{m}}} = {\rm{\pi }}a_{{\rm{tr}}}^{\rm{2}} \times {b_{{\rm{tr}}}}\quad .$$
It is worth commenting that the presented method to estimate the interfacial area and the transformation zone volume serves the purpose to qualitatively analyze the indentation problem to get a simple scaling of the problem. It is not an accurate study.