


INTRODUCTION
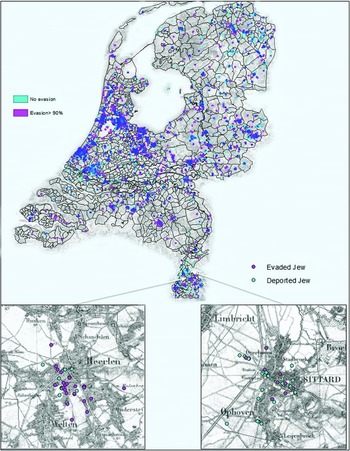
About 200 kilometers from the Dutch capital Amsterdam, near the German border, lie the medium sized cities Sittard and Heerlen. Before the outbreak of World War II, Heerlen and Sittard had a similar socio-cultural outlook. The population in both cities was predominately Catholic, relatively prosperous and labored in the mining industry. Ever since the turn of the nineteenth century the villages were home to sizable Jewish communities. During the German occupation both communities faced similar challenges and underwent identical structural transformations. From 1941 onwards, Jews were no longer allowed to take part in public life. After being segregated socially and spatially, German SS officers, helped by local policemen, started organizing roundups to track down Jewish inhabitants and send them to concentration camps in Eastern-Europe (Presser Reference Presser1965). Despite the sociocultural similarity of the two cities, outcomes of these roundups differed fundamentally as we can see in Figure 1. In Heerlen numerous Jews were able to evade deportation with the help of Christian rescue networks. As a result 53 percent of all Jews survived the war. Help unfortunately was less available in neighboring Sittard where only 20 percent of the entire Jewish community was able to escape the cruelties that awaited them in the extermination camps (van Rens Reference van Rens2013). If we step back and take a look at evasion throughout the whole country in Figure 1, we see that local variation in evasion was not unique to Heerlen and Sittard.
Evasion Jews in Heerlen, Sittard, and the Netherlands

Dominant theories on political violence which focus on territorial control (Kalyvas Reference Kalyvas2006), electoral dynamics (Kopstein and Wittenberg Reference Kopstein and Wittenberg2011), and cross-cutting civic organizations (Varshney Reference Varshney2003) cannot explain this subnational variation in Jewish victimization as Nazi authority was not seriously challenged anywhere in the country, party politics was neutralized during the war, no Jewish political parties existed, and inter-religious associations were extremely rare in the Netherlands (Lijphart Reference Lijphart1968). Instead, I identify an important local condition under which subgroups of civil society become an impediment to political violence. Specifically, I argue that local minority groups are more likely to protect victims of mass persecution. Two reinforcing mechanisms link minority status to protection. First, minorities are better able to set up clandestine networks that are immune to individual betrayal because their members are more committed (Berman and Laitin Reference Berman and Laitin2008; Brewer and Silver Reference Brewer and Silver2000). Second, minorities empathize with victims of mass persecution, imbuing their networks with preferences that lead them to protect pluralism and resist ethnic persecution (Hoffman Reference Hoffman2001).
I substantiate this claim by exploiting evidence drawn from the religious rescue of Jews in the Netherlands during the Holocaust. Religious rescue in the Netherlands provides a unique albeit tragic opportunity to investigate whether minorities are more likely to produce rescue networks for four reasons. First, there is sufficient variation on the independent variable. The Netherlands was at the front line of the reformation, counter-reformation, and Protestant secessions. Missionary activities (of both Protestants and Catholics) and disputed scripture (mostly within the Protestants church) created a dynamic religious landscape and resulted in pockets of religious minority communities in both Catholic and Protestant parts of the country (Rogier Reference Rogier1964). This mixed landscape allows me to assess whether religious deviance affected mobilization for both Protestant and Catholic communities while keeping ideology constant. Second, top down enforcement of mobilization is kept constant as Protestant and Catholic leaders protested anti-Semitic legislation collaboratively at the national level (Snoek Reference Snoek1990), providing all Christians with the same moral message of how German persecutions went against the tenets of their faiths regardless of congregation. Third, there is enormous variation on the dependent variable. Following the national example, local religious leadership played an important role in mobilizing populations to protect Jews on a local level; whether this happened however varied both within and between municipalities (Michman et al. Reference Michman, Flim, Gutman and Bender2004). Fourth, exploiting the extraordinary array of unused historical sources presented by the Holocaust enables me to study violence on an extremely fine-grained level.
After culling postwar case studies, surveys, and testimonies to probe the plausibility of the minority hypothesis, this article deploys a new, geocoded dataset of Jewish evasion in the Netherlands to systematically assess the relationship between geographical proximity to minority churches and evasion. By pairing German registrations of Jews with commemoration books and camp lists, I am able to map where Jews lived and whether they evaded deportation or not. These data are combined with geocoded information on Catholic and Protestant communities throughout the country. Autologistic models of 93 percent of all Dutch Jews show a strong and positive correlation between the presence of minority churches and evasion. Using municipality fixed effects and distance from Delft the working terrain of the first vicar to the Catholic mission in the Protestant Northern Netherlands as an instrument for Catholicism enables me to isolate the effect of minority churches from local levels of tolerance for subsets of cases.
This finding lies at the heart of two intersecting debates about the role of civil society in times of social upheaval. The first debate evolves around the question whether civil society improves the coordination of opposition against repressive authorities or on the contrary begets acquiescence (Gramsci Reference Gramsci1935). The second debate centers around the relationship between civil society and pluralism. Following Tocqueville scholars argue that through associational life the “heart is enlarged” (Tocqueville Reference Tocqueville1840, p. 201) and violent conflict can be contained (Varshney Reference Varshney2003), at least according to some because “joiners become more tolerant [. . .] and more empathetic to the misfortune of others” (Putnam Reference Putnam2000, p. 288). Yet, Tocqueville himself was the first to admit that civil society can be perverted into a “cause of destruction” (p. 220) and it has been shown that it sometime legitimizes participation in violent attacks on pluralism (McDoom Reference McDoom2014). The minority hypothesis put forward in this article qualifies the relationships between civic life, coordinated opposition, and ethic violence as it identifies an important structural condition under which subgroups of civil society produce both the norms and networks to resist attacks on pluralism.
In addition, this article contributes to literatures on mass violence in general and the Holocaust in particular. Existing theories on genocide have difficulty explaining subnational variation in rescue because their focus is either too micro or too macro. On the macro side of the spectrum researchers study how national factors or leaders affect help for persecuted groups (Fein Reference Fein1979). On the micro side, scholarship focuses on how individual attributes such as altruism, religious compassion, and inclusive identities determine who helps and who does not (Monroe Reference Monroe2001). Instead, this article joins a growing body of work that takes a meso-level perspective on genocide by focusing on local community factors (Croes and Tammes Reference Croes and Tammes2004; Finkel and Straus Reference Finkel and Straus2012). This advances the study of genocide in four ways.
First of all, while the micro literature on rescuers has helped us to better understand how compassion and altruism motivates (some) individuals to help (Monroe Reference Monroe2001), the equally important collective capacity to actually rescue someone has received less attention. Even if individuals are willing to save Jews, their environment does not always provide them with the protective shell needed to reduce risk, impeding the impact they would want to have on evasion. This article suggests that whether religious altruists can turn into heroes depends on the local networks in which they are embedded, linking micro motives to community outcomes (Gross Reference Gross1994).
Second, and related, micro studies mainly provide insight into proximate causes of rescue. This article furthers this literature by suggesting that individual level motivations and networks to rescue are not distributed randomly but in part reflect the underlying structure of civic life as members of minority groups are more likely to display empathy and be embedded in subgroups capable of clandestine collective action.
Third, this article highlights that even when national elites consistently protest genocidal policies the actual willingness and capacity of constituents to actively resist mass killing depends on subnational networks and norms. It therefore urges (macro) scholars of genocide to move beyond the study of bishops and other high-level national officials and dig deeper into localized patterns of evasion to understand in what ways national forces of restraint are conditioned at the local level (Straus Reference Straus2006).
Fourth, traditional arguments on religion and genocide have focussed on inherent characteristics of different congregations (Kuper Reference Kuper1990). It has for instance been argued that Catholicism reduced solidarity with Jews because of its reactionary tendencies and the traditional Jewish-Christian Schism. The hierarchical structure of the Catholic church has been claimed to be a detriment to as well as a catalyst for resistance (Croes and Tammes Reference Croes and Tammes2004). Protestants, for their part, it has been argued, were better able to defy German authorities because of their individualistic traditions (Moore Reference Moore2010). The central finding of this article is that it is the local position of church communities—and not something inherent to any religion itself—that produces collective networks of assistance to threatened neighbors (Longman Reference Longman2010).
The remainder of this article will proceed as follows. In the next section, I briefly introduce readers to how the Holocaust unfolded in the Dutch context. Following that, I describe how a minority position creates collective resistance against mass killings. Brief case studies and analysis of postwar testimonies and surveys are presented in the next section. The following section introduces the geocoded dataset and statistical techniques used to model Jewish evasion. The results are presented after that. In the concluding section, I highlight the generalizability of these findings.
THE HOLOCAUST IN THE NETHERLANDS
Following the quick capitulation by the Dutch armed forces, a Nazi civilian government led by Reichs Commissioner Seys-Inquart gradually isolated Jews socially, economically, and administratively. When the major deportations started in May 1942, Jews were no longer allowed to travel without a permit, enter public spaces, or own more than 250 dollars. More importantly, German authorities had been able to exploit local bureaucracies that had remained intact to obtain detailed residential information on all Jews living in the country (Presser Reference Presser1965).
Like elsewhere, the Nazis tried to deport Jews to extermination camps under the guise of work. At first they hoped all Jews would obey orders and show up for deportation themselves after receiving a call. When this did not turn out to be true for large portions of the Jewish population, the German security forces started organizing round-ups in collaboration with local police and new troops of Dutch volunteers (Croes and Tammes Reference Croes and Tammes2004). In the last stage of the deportation, between October 1943 and September 1944, the Germans, helped by newly established police units and bounty hunters, started tracking down Jews who had gone underground. At the end of 1944 the Netherlands was declared “Jew free.” The result of the preceding years was nothing less than a disaster: more than 70 percent of the Jews were killed, by far the highest number in Western Europe (Griffioen and Zeller Reference Griffioen and Zeller2011).
Only 28,000 Jews attempted to evade this frighteningly effective deportation campaign (Croes and Tammes Reference Croes and Tammes2004).Footnote 1 As crossing the Dutch border was extremely difficult, Jews who wanted to escape deportation had to find hiding inside the country which depended heavily on the aid of others, whether through sharing of resources, providing shelter, or facilitating mobility between safe houses (Varese and Yaish Reference Varese and Yaish2000). How did the Gentile population respond? Although many Gentiles were aggrieved about what happened to the Jews, they remained inactive. Feelings of powerlessness and fear dominated because helping Jews entailed the (perceived) risk of getting deported oneself (van der Boom Reference van der Boom2012). Occasionally, isolated altruists were able to assist Jews but sheltering was often too much work for one or two people alone (Flim Reference Flim1997). With the exception of some student networks, most rescue activities remained geographically isolated and disjointed (de Jong Reference de Jong1969–1991). It was not until late 1943, when the labor deployment was extended to include Gentiles as well, that something resembling a national rescue movement emerged. By then it was “too little, too late” (Moore Reference Moore2010, p. 234) as most Jews had already been rounded up and most of those who remained lived in Amsterdam and The Hague, strongholds of German security forces that were difficult to escape (Presser Reference Presser1965).
One group of actors that did openly stand up for the Jews and protested anti-Semitic policies early on were national church leaders. Contrary to almost all other organizations, such as political parties and labor unions, church networks were never dismantled because the Germans were afraid to alienate religious elites. Their denominational differences notwithstanding the three major religious groups—Protestants, Orthodox Protestants and Catholics—all saw anti-Semitism as being in conflict with the inclusive underpinnings of Dutch society (Braun Reference Braun2016).
Motivated by these traditions, national church leaders protested anti-Semitic legislation at least 39 times. In nine cases these protests were accompanied by sermons throughout the whole country (Croes and Tammes Reference Croes and Tammes2004). In addition, the Protestants and Orthodox Protestants organized fundraisers “to support their Jewish brothers” (Delleman Reference Delleman1949) while Archbishop De Jong donated 12,000 dollars to an organization that provided shelter to Jewish children (de Jong Reference de Jong1969–1991) and secretly encouraged local clergy to help Jews. From January 1942 onwards leaders of the three churches combined forces for the first time in Dutch history. In an unprecedented display of inter-religious solidarity, Christian churches agreed to read joint statements from their pulpits during local services nationwide in July 1942 and February 1943, declaring the culpability of anyone who contributed to the deportations of Jews (Snoek Reference Snoek1990).
In line with the moral impetus sent out by their superiors, local clergymen (and woman) and other religious opinion leaders played a key role in instigating the small assistance networks that were so crucial for evasion early on (Michman et al. Reference Michman, Flim, Gutman and Bender2004). However, protests and sermons told congregants what not to do rather than what to do. As a result religious help to Jews was far from universal. At a local level, some religious groups produced rescue networks while others did not.
RESISTANCE TO GENOCIDE
Commitment and Empathy
Helping a persecuted minority involves building a secret organization among like-minded individuals willing and capable to facilitate (a) illegal migration and (b) illegal shelter. In total 97 percent of 2,798 testimonies of Dutch rescuers commemorated by Yad Vashem mention help from outside the family, highlighting the collective nature of rescue operations. Evasion networks had to supply Jews with fake identifications papers, rationing cards, produce, clothes, information about upcoming roundups, safe houses, safe transportation routes and, most importantly, numerous hiding places as few rescuers were able to provide shelter for a long period of time. This demanded the cooperation of reliable host families, couriers, food providers, organizers, and informants in the police system.
Attracting the right people to participate in such illegal activities is far from easy as they entail enormous risks and require the reduction of exposure. It takes only one denunciation—be it motivated by ideological conviction, personal grudges, or induced by monetary rewards or protection—to put an operation at risk and punishing defectors is almost impossible. Clandestine rescue therefore necessitates careful recruitment of helpers and the formation of secretive shells around persecuted groups that are insulated from defection.
The literature on collective action identifies a wide array of mechanisms that can create and sustain collective action while reducing the risk of defection, including, honor, collective identities, norms, and joy in deploying agency to obtain group goals. Their enormous variety notwithstanding, these all depend on how committed members are to their group. Group honor, norms, and leadership do not mean anything when attachment to a community is only superficial. As group commitment is something that is hard to shape and develop in the short term it acts as a structural constraint on mobilization (Wood Reference Wood2003).
So why are members of one community more committed to their group than others? From a social psychological perspective the distinctiveness postulate provides a promising starting point. According to this theorem, people rely on perceptual selectivity to make sense of who they are and what they commit to. Individuals tend to commit most to characteristics that are relatively rare in their social environments because deviant traits provide the most information on who you are. In line with the distinctiveness postulate social psychologists studying collective action have demonstrated that minority groups, groups organized around relatively rare traits, are more cohesive and display strong group identification. The higher levels of identification created by distinctiveness in turn increase compliance with group norms, overall loyalty, and voluntary self-sacrifice among members (Brewer and Silver Reference Brewer and Silver2000).
Economists of insurgency and collective action emphasize the importance of membership screening for the creation of commitment. To build a community in which membership is valued one needs to attract committed individuals and repel potential free-riders. In contexts where social life is segregated by religion and prohibitions to interact with members of another congregation are in place, a religious minority position acts as a natural screening device because it imposes costs on members by inhibiting participation in dominant networks. Costs in turn act as barriers to entry that deter the undedicated but not the dedicated (Berman and Laitin Reference Berman and Laitin2008).
Screening and distinctiveness turn minority groups into self-reinforcing hubs of commitment that simultaneously enable secrecy and collective action. To exploit the potential of these hubs for the creation of rescue operations they also need to be imbued with preferences that lead them to oppose genocidal policies. Minority communities are likely to encapsulate political beliefs that conflict with ethnic cleansing. Being a minority oneself creates attachment to the protection of minority rights in general and persecuted minorities in particular (Hoffman Reference Hoffman2001). These dispositions are likely to increase the resonance of protests against genocide by national church leaders. This would lead us to expect that a religious minority status creates both the willingness and the capacity to set up movements that provide assistance to persecuted groups in the face of mass killing.
Hypothesis 1 Local minority churches were more likely to rescue Jews.
Fault Line between Rome and Reformation
The Netherlands has always been a breeding ground for new religious movements. In the early 16th century different streams of Lutheranism, Anabaptism, and Calvinism developed in Dutch cities, with the latter congregation becoming the most dominant during the reformation. Together with urban patricians and local nobility who were attracted to more fiscal autonomy, these Calvinists organized an insurgency against the Catholic King Phillip who pursued anti-Protestant policies. After the uprising, the country was cut in half in 1579. Whereas large parts of the Southeast were reattached to Phillip’s territory, the northern parts broke away from the Spanish crown, forming the Republic of the United provinces. William of Orange, a key leader of the revolt, was a strong advocate of religious tolerance. This was reflected in the founding document of the Dutch Republic, with Article XIII stating explicitly that no one should be persecuted for religious reasons (Israel Reference Israel1995).
These political processes had an enormous impact on the effectiveness of the counter-reformation. While the Catholic church could uproot newly founded Protestant communities in the Southeast under the reign of the Spanish king, the re-establishment of Catholicism in the North was largely impaired and depended heavily on the passion of individual missionaries (Rogier Reference Rogier1964). The constitutional protection of religious pluralism however also prevented the complete conversion to Calvinism. For the same reason, the Netherlands never became religiously homogeneous after reconquering the Southeast in 1648, despite Calvinist privileges in education and politics.
Being literally at the fault line between Rome and Reformation, the country now became a hotbed of missionary activity as both Protestants and Catholics started to make inroads into each others’ territories. These activities created religious enclaves on both sides of the religious boundary. While the Catholic mission in the North was more successful than its Protestant counterpart in the South, small pockets of Protestantism were able to grow over the years due to economic integration of industrialized regions near the Belgian border (Rogier Reference Rogier1964).
Apart from conflict between Protestantism and Catholicism, conflicts within the Protestant church added to the emergence of minority enclaves throughout the country. In the 19th century, Orthodox Protestants broke away from the dominant Dutch Reformed church out of discontent with enlightened undertones of modern Protestantism. Although these communities were spread out all over the country, they were more concentrated in the Southwest and Center, an area know as the Dutch bible belt (Knippenberg Reference Knippenberg1992).
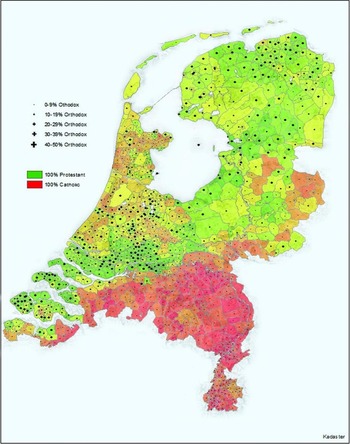
Figure 2 shows the relative strength of Catholicism versus Protestantism and the strength of Orthodox Protestant movements per municipality, a geographic unit roughly comparable with a US county, in 1930. Whereas completely red municipalities were dominated by Catholics, green municipalities were dominated by Protestants. The political geography of three centuries was still visible in the interwar period (CBS 1931). Catholics were dominant in the South, while Protestants dominated the North. In addition to the Orthodox Protestant churches that were spread throughout the country, minority enclaves of Protestants and Catholics also emerged in the East and Northwest as well as near the religious fault line (municipalities represented in yellow and orange in Figure 2).
Protestants, Catholics and Orthodox Protestants in the Netherlands, 1930 (CBS 1931)

How did a small state deal with so much religious fractionalization? This exactly is the puzzle that made both Lijphart and the Netherlands famous among social scientists in the US. According to Lijphart, elites were able to pacify conflict between groups by preventing members of different religious communities to interact with each other on a local level (Lijphart Reference Lijphart1968).
Given this religious landscape, I divide hypothesis 1 into 3 subhypotheses:
Hypothesis 1.1 Catholics were more likely to rescue Jews in Protestant parts of the country.
Hypothesis 1.2 Protestants were more likely to rescue Jews in Catholic parts of the country.
Hypothesis 1.3 Orthodox Protestants were more likely to rescue Jews throughout the country.
CASE STUDIES
Local case studies lend some support to these hypotheses.Footnote 2 Let us for a second return to the puzzle with which I started this article. One of the main forces underlying the rescue activities in Catholic Heerlen was Protestant reverend Gerard Pontier. After encouraging Jews living in his neighborhood to go underground he organized his parish into a tightly knit community that insulated Jews from outside infiltration (van Rens Reference van Rens2013). This process is probably best symbolized by how Jewish children were transported from one safe house to the other within Heerlen. Because some of these children had “Semitic looks,” they could not simply walk out in public. Instead, a group of Protestant children gathered, formed a hedge and played a game of leap-frog, limiting exposure of facial characteristics by forming a human caterpillar (Braun Reference Braun2016). Quite literally, Protestants in Heerlen placed a protective shell around Jews.
Sittard also had a small group of Protestants who sheltered at least three Jews. However, their community was not large enough to have a real impact. With only a few members these groups could not isolate large numbers of Jews (Braun Reference Braun2016). In the whole province of Limburg, Protestants were strongly over-represented among helpers. Moreover the Catholics that did provide shelter started doing so in the last years of the war when most of the damage was already done (van Rens Reference van Rens2013). In addition to Limburg, Protestants also dominated rescue networks in the predominantly Catholic regions of Twente (Hilbrink Reference Hilbrink1989).
That a minority position bolstered Catholics in Protestant parts of the country as well is nicely illustrated by statements of a Protestant Vicar in predominantly Protestant Sneek which, with an evasion rate of 55 percent, was the safest village in the province of Friesland. In her postwar testimony, the vicar could not hide how amazed she was that her Roman Catholic counterpart, church chaplain Janssen, was able to shelter significantly more Jews despite the fact that the Catholic community was so much smaller than hers (Flim Reference Flim1997). Janssen’s network was in no sense unique. Similar Catholic rescue movements were also known to be active in Protestant Enschede, Bussum, Salland, Groningen, Tiel, Woerden, Heiloo, Zeist, and Wassenaar (Braun Reference Braun2016).
In line with hypothesis 1.3, Orthodox Protestant churches were active throughout the whole country. For instance, local historians have identified rescue groups in Hardenberg, Zwartsluis, Badhoevedorp, Nieuw Vennep, the whole province of Friesland, Venlo, Enkhuizen, and Zaandam. A telling story is that of Orthodox Protestants rescuers in Nieuw Vennep. A deputy minister of the Orthodox Protestant church in this region forged linkages between local traders and farmers which were crucial for setting up a sheltering infrastructure as the latter often had the space and resources to keep Jews underground for a prolonged period of time. In the village itself two pockets of protection emerged separated by a series of houses owned by members of the National Socialist Party who, at any cost, had to be prevented from finding out (Braun Reference Braun2016).
A little bit outside the village lived Hannes Bogaard who saved around a hundred Jews and was known as “the bush monkey” because he always hung in there. The whole Orthodox Protestant community seemed to know what the bush monkey was up to. Among the Orthodox Protestants who harbored mixed feelings about his rescue activities his farm was known as “the concentration camp” because it housed so many Jews. The church for him, however, always felt as a safe haven: “I trust all Orthodox people,” he often said. Less romantic testimonies reveal that Orthodox Protestant believers in the village were uncomfortable with what he was doing but could not bring themselves to denounce someone they considered one of their own. While Hannes often turned to fellow church members to collect money or to place Jews when his residency became too crowded, the Orthodox Protestant grocery and bakery provided Bogaard with food for “his guests.” Equally important were the warnings he got from a local police officer when the Germans were actively looking for Jews. Hannes was arrested by the Nazis, only a few days after he mistook members of the Dutch reformed (non-Orthodox) church for coreligionists and told them about his activities (Braun Reference Braun2016).
That empathy played a role among religious minorities is probably best expressed by a Catholic leader in the Protestant north who underlined his outrage over antisemitism by saying, “It starts with the Jews but ends with the Jesuits” (Ramakers Reference Ramakers2001, p. 61).
Overall, postwar testimonies seem to confirm that minority groups were more likely to rescue Jews. Of all the rescuers commemorated by Yad Vashem (Michman et al. Reference Michman, Flim, Gutman and Bender2004) for whom the religion is known (908 in total), 62 percent belonged to a minority church (Braun Reference Braun2016).Footnote 3 A similar picture emerges when one reanalyzes survey data collected among Jewish children who were sheltered during the war (Evers-Emden and Flim Reference Evers-Emden and Flim1996). Of all the 226 rescuers for whom the religion was known, 61 percent adhered to a minority religion (Braun Reference Braun2016).
Of course, postwar surveys, testimonies, and local case studies all suffer from a certain bias as they mostly rely on information provided by survivors and successful helpers after the war. Therefore the next sections will complement these scattered and incomplete data sources with a statistical analysis of geocoded data on Jewish evasion to see whether proximity to minority churches actually increased the probability of evasion.
DATA AND METHODS
Unit of Analysis: Registered Jew
In order to systematically test the hypotheses outlined in the previous sections, I have constructed an individual level dataset of Jews based on German registration lists (Croes and Tammes Reference Croes and Tammes2004). At the end of 1941 the German authorities forced local governments to collect individual level data on all Jews living in their municipalities. These lists recorded religion, address, birth date, and country of birth for all Jews. The Germans created 496 lists, one for each municipality, on which they listed information of 140,000 full Jews.Footnote 4 In July 1942, shortly before the deportations started, the registration lists were updated. This was done to obtain information on 9,000 Jews living in coastal regions, Noord-Holland, and Utrecht that were recently evacuated to Amsterdam as part of German residential concentration efforts (Presser Reference Presser1965). Copies of these lists are available at the Dutch Institute of War Documentation (NIOD), the Jewish History Museum, local archives, the Central Bureau for Genealogy, and Yad Vashem. As less than a 100 Jews refused to register (de Jong Reference de Jong1969–1991), I can be confident that the registration lists provided a complete picture of the Jewish population right before the deportations.
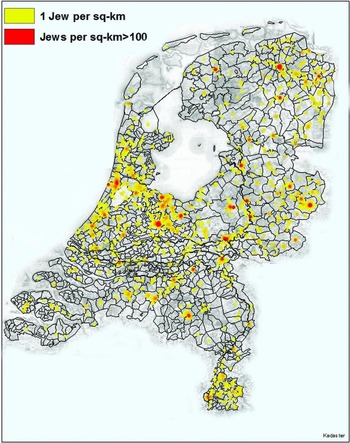
I have been able to digitalize the information of 128,921 Jews living in 464 municipalities. It is important to emphasize that in order to create this database, I have built on the efforts of other scholars. Croes, Tammes (Croes and Tammes Reference Croes and Tammes2004; Tammes Reference Tammes2011), and Van Rens (van Rens Reference van Rens2013) together had already digitalized names and birth dates of 107,000 Jews living in 288 municipalities. Information of around 1,647 Jews from 32 municipalities is missing. Partly due to their long history in the Netherlands, Dutch Jews lived throughout the country (see Figure 3) in regions of different religious composition, creating sufficient variation on the dependent variable.
Jews in the Netherlands, 1942

Since we are interested in how rescue organizations shaped survival chances, two groups of Jews are disregarded in the analysis because they were never at risk for deportation or evaded deportation through legal means. First, I took out 1,647 Jews who died a natural death or committed suicide before July 1942. Data on cause of death is obtained from the Dutch Digital Monument described below. Second, I identified Jews who were able to evade deportation legally by appealing their Jewish identity. This information was obtained from lists compiled by the Referat Innere Verwaltung that included all Jews who were exempted from deportation (de Jong Reference de Jong1969–1991).
A third group was taken out mostly for pragmatic reasons. For most municipalities the most up-to-date 1942 lists were available. For Amsterdam however this was not the case and I had to rely on a 1941 list instead. By taking this list however I automatically excluded information on Jews who were evacuated to Amsterdam from other parts of the country. Disregarding this group however also makes sense substantively. Since this group was technically already inside the bureaucratic system of the Germans the chances that they would be able to make use of rescue networks in a region in which they had just arrived was pretty slim.Footnote 5
The addresses recorded in the registration lists were used to retrieve fine-grained coordinates of residential location for all Jews in the dataset. As a first step, addresses were automatically geocoded using Googles Geocoding API. Addresses for which no precise coordinates were returned were then coded manually. This was done by consulting information compiled by Jewish history museum on address names that were changed after the war. For 3,578 Jews it was not possible to identify exact coordinates because address information was missing or only neighborhood codes were provided. As a result the presented analysis was based on 122,694 Jews who lived in 439 municipalities. In an additional analysis I randomly assigned coordinates within municipalities for these 3,578 cases. Results were almost identical to the ones presented below.
Dependent Variable: Evasion
In order to determine which of the registered Jews were able to evade deportation, I match the digital registration lists against the Dutch Digital Monument (DDD) and lists of Jews returned from camps after the liberation. The DDD is an online portal maintained by the Jewish History Museum that commemorates all Jews who died during the war. It is constructed out of a wide array of sources: commemoration books, the Netherlands Red Cross, registers from transit Camps Vught, Westerbork, and Amersfoort, obituaries from Jewish weeklies, and honor rolls of resistance fighters. The DDD lists name, date of birth, and the place of death. Based on this information I selected all Jews who died inside camps and marked them as deported. In addition, I matched the 122,214 names against lists of 5,400 Jews who were found in camps alive after the liberation. These people survived the war so were not recorded in the DDD but did get deported so needed to be coded as such.
All the files were linked using the following matching procedure. For each case I created three identification strings that taken together uniquely identified all Jews on the lists. The first two strings contained the first and last name while the third string contained the date of birth.Footnote 6 Simply matching all the files based on these strings would be a bad idea. Due to spelling errors, coding mistakes, formatting variation, and missing information this would result in an enormous amount of mismatches. Therefore I made use of a two-stage matching procedure that combined statistical and manual techniques. For the first part I used a statistical matching procedure developed by Blasnik (Reference Blasnik2010). When pairing cases this procedure calculates an overlap percentage for all pairs of observations. This percentage was used to identify potential matches that needed to be inspected manually. To do this, I first had to determine what overlap percentages indicate potential matches and which ones do not. I did this by coding 1500 matches manually regardless of their overlap score and compared the number of manual matches per overlap score.
This procedure suggests that cases with an overlap score below 60 did not include any actual matches. Based on this I decided to manually inspect all pairs that had an overlap score above 60 percent. After matching all cases the overall evasion rate was 28 percent; this is close to the overall estimate of 26 percent for the Netherlands provided by Hirschfeld (Hirschfeld Reference Hirschfeld1991). To make sure our matching procedure did not introduce any regional bias, I compared it with completely manually matched data for the 407 Jews living in the province of Limburg provided by historian van Rens (van Rens Reference van Rens2013). Overall, individual mistakes are rare. Of the 407 Jews, six were incorrectly identified as deported and for two cases the opposite mistake was made. Mismatches were due to incomplete information because civil servants forgot to provide information on dates of birth. The correlation between municipality level evasion rates was high (r = .89), indicating regional bias is limited.
Independent Variable: Minority Churches
I pair these data with a georeferenced database of all Christian churches in 1942, the year the major deportations started. Address information for churches is retrieved from the Dutch inventory for Church buildings compiled by Sonneveld and maintained by the Free Universty in Amsterdam (IKGN 2011). These two georeferenced databases are exploited to assess whether Jews living close to minority churches were better able to evade deportation. The assumption underlying this operationalization is that the extent to which networks of religious groups intersect increases with geographic proximity. Research has pointed out that prewar friendships, acquaintances, and other face-to-face contacts were crucial to bring Jews in contact with rescue networks (Varese and Yaish Reference Varese and Yaish2000). In Heerlen, Reverend Pontier actually approached Jews in his neighborhood himself and encouraged them to go underground (Flim Reference Flim1997). Others suggest Jews often took the first step in contacting nearby rescuers (Varese and Yaish Reference Varese and Yaish2000). Regardless of who took the initiative, the bridges between rescuers and rescued often clustered in space.Footnote 7
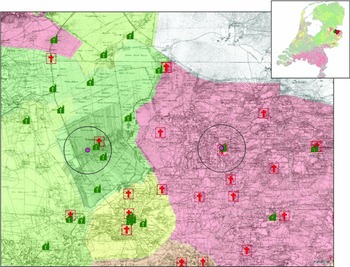
I assume Jews live close to a minority group when a church in their immediate environment belongs to a minority congregation. To capture the spatial clustering of religious groups, I draw a circular buffer area around each Jewish individual. In Figure 4 this is illustrated for Protestant municipality Vriezenveen and Catholic municipality Tubbergen. Within this buffer I count the number of churches for each denomination. Based on these counts I create two religious proximity measures: the proportion of Catholic (i.e., non-Protestant) churches to tap the relative strength of Catholic versus Protestant groups in the immediate environment (Catholic Proximity), and the proportion of church buildings that belong to Orthodox Protestant communities to assess the strength of other minority groups (Orthodox Protestant proximity). The Catholic proximity measure is interacted with the overall proportion of all Christians in the region that belongs to the Roman Catholic church and not to any of the Protestant churches (Catholic strength). Region is defined as the municipality in which a Jew lives and all adjacent counties. This is done to do justice to the fact that churches falling within a buffer are sometimes located in a neighboring municipality.Footnote 8 Since all churches and Christians in the Netherlands are either Protestant or Catholic the Catholic proximity measure is exactly the inverse of the Protestant proximity measure and Catholic strength is exactly the inverse of Protestant strength. Hence, if the minority theory holds one would expect Catholic proximity (non-Protestant proximity) to have a positive effect on evasion in Protestant parts of the country and a negative effect in regions dominated by Catholics. In addition, one would expect a direct and positive correlation between the presence of Orthodox Protestant churches and survival regardless of context since they form minorities everywhere. Data on religious membership are obtained from the 1930 census (CBS 1931). To further explore the separate effects of Catholic and Protestant churches I also present analysis with counts of Protestant and Catholic churches instead of one single proportion. The count measures are logged to deal with skewness.
Example Buffer Vriezenveen and Tubbergen

Since the threshold for what constitutes proximity is not obvious I conduct different analyses in which I vary the radius of the buffer from 10 minutes (1 km) to 20 minutes (2 km) walking distance. This lower threshold is chosen because the number of Jews not living close to a single Christian church increases enormously when we use a 1 km radius (3,064 versus 877 for a 1.25 km threshold.).Footnote 9
Analysis: Autologistic Regression
Conventional statistical methods assume the independence of observations. The data described above are likely to violate this assumption as Jews living in the same municipality, village, street, or street corner are dependent on each other for two reasons. First, they share the same social and political context that might affect their evasion chances. Second, the deportation of one Jew is likely to affect the deportation of a Jew living nearby as Germans often extracted information from their prisoners to trace down families, friends, and acquaintances. Both these forms of spatial dependence create autocorrelation and typically introduce bias in standard errors and coefficients (Ward and Gleditsch Reference Ward and Gleditsch2002). Our observations are similar to point data analyzed in geostatistics. It is common practice in this field to deploy variogram modeling to detect spatial autocorrelation of a variable Y at location xi for all pairs of observations N separated by distance h for a number of distance intervals d. A sample variogram reflects the extent to which nearby observations have similar values (Cressie Reference Cressie1993) and can be estimated by
 $$\begin{eqnarray}
{\gamma (h) = \sum _d \frac{1}{2N_{(h,d)}} \left(\sum _i [Y(x_{i}+h,d)-Y(x_{i},d)]^2\right).}\nonumber\\
\end{eqnarray}$$
The intuition underlying this approach is that autocorrelation will result in lower variation γ(h) between nearby observations while no relationship between distance and variation exist between observation that are far removed. Typically, this will result in a sample variogram with an initial steep increase before a plateau. The distance at which the line flattens out is called “the range” and captures the point at which spatial autocorrelation is no longer present. Estimated variograms indicated that variance increases sharply until we reach the 5 km threshold. This suggests that autocorrelation is present between observations that are 5 km apart.Footnote 10 Following ecologists, I model spatial autocorrelation by including an autocovariate in the analysis tapping the average evasion rate of all other Jews living within a 5 km radius (Ward and Gleditsch Reference Ward and Gleditsch2002). In addition, I allow errors to be correlated across observations within the same municipality by deploying municipality clustered standard errors. Since evasion is a binary outcome I estimate an autologistic regression with the following parameters:
 $$\begin{eqnarray}
&&\log \left(\frac{\pi _{ij}}{1-\pi _{ij}}\right)=\beta _1 autocov_{ij} + \beta _2cathP +\beta _3cathS \nonumber\\
&&\quad+\,\beta _4cathP*cathS+\beta _5orthP+\beta _6jews+\beta _7church, \nonumber\\
\end{eqnarray}$$
where for each observation k,
 $$\begin{equation*}
autocov=\frac{\sum \limits _{l=1}^n\mathbf {W_{kl}}y_{l}}{\sum \limits _{l=1}^n\mathbf {W_{kl}}},
\end{equation*}$$
k ≠ l, yl = 1 if observation l evaded deportation and Wkl is a binary weight matrix that marks observations within 5 km distance of each other. In the absence of spatial autocorrelation β1 = 0 and this model is identical to a standard logistic regression.Footnote 11
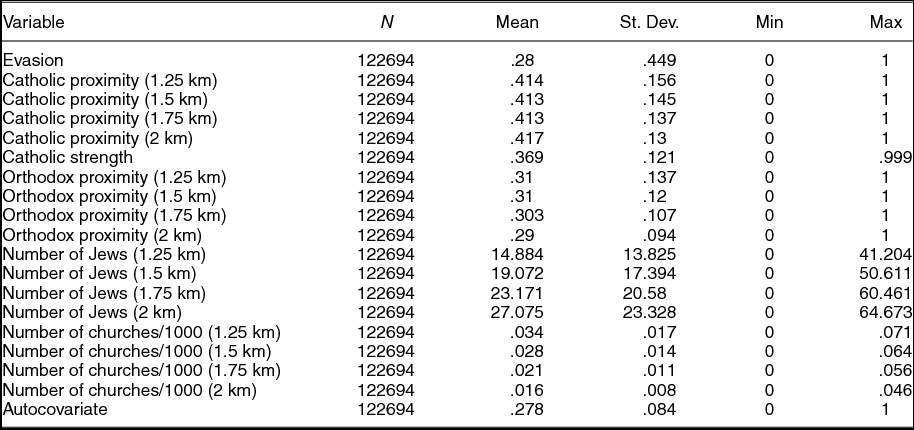
This equation includes six variables in addition to the autocovariate. Naturally the model contains the Catholic (cathP) and Orthodox Protestant proximity (orthP) measures described above. The Catholic proximity measure is interacted with the strength of Catholicism in the region (cathS) to test for heterogeneous effects. As said, we would expect Catholic (or non-Protestant) proximity to have a positive effect on evasion in Protestant regions and a negative effect in Catholic regions. To make sure we are not comparing regions that differ completely in terms of Jewish and gentile population size the model also includes a count of the Number of Jews (jews) and the Number of churches in the direct environment (church).Footnote 12 The last two measures are divided by 1000 to reduce the number of digits. Descriptives are presented in Table 1.
Descriptive Statistics

Autologistic models with binary dependent variables are difficult to estimate because they do not have closed solutions in MLE. Therefore I rely on Maximum pseudolikelihood estimates for the baseline analysis and linear probability models estimated via OLS to allow for the inclusion of municipality-level fixed effects (Besag Reference Besag1974).Footnote 13
Omitted Variable Bias
Investigating the effect of minority churches on evasion requires evaluation of a counterfactual claim: would the possibility to evade have been lower if no minority church was present? In observational settings these types of claims are hard to assess because regions are likely to vary along multiple other dimensions related to both evasion and the clustering of religious minorities. In the results section I will rely on (a) municipality fixed effects, (b) geocoded controls, and (c) an instrumental variable to assess the robustness of the overall results. Scholars have pointed out that municipality characteristics resulted in the geographical clusters of evasion (Croes and Tammes Reference Croes and Tammes2004). To make sure that this is not driving our results, fixed effects for municipalities are included in the analysis. Linear probability models are estimated via OLS to allow for the inclusion of these fixed effects.
In addition, I include two sets of control variables. The first set deals with regional differences in repressive capacity. It is plausible that remote areas in which deviance flourished were harder to reach for the repressive apparatus of the Germans. I deal with this by controlling for the distance to the nearest SS office and city center. The second set of controls tap social integration. Previous research suggests that social integration affected evasion both positively and negatively (Finkel Reference Finkel2012; Moore Reference Moore2010). It is also likely that integration was impacted by the religious environment as you would expect deviant groups to be more inward looking and less interested in outsiders. Four measures of social integration are included in the analysis: whether a Jew (1) lived near a synagogue (using varying circular buffers), (2) converted to Christianity, (3) had Dutch citizenship. and (4) was married to a gentile.
Another major methodological concern stems from migration patterns. As neither Jews nor deviant churches were randomly distributed over municipalities, it is possible that factors determining where they ended up also affected deportation. There may be reason to believe that this is indeed the case. Both Jews and other religious minorities might have decided to move to places that were more pluralistic or tolerant overall (Knippenberg Reference Knippenberg1992). This is a factor that is hard to capture empirically but does potentially influence the willingness of the local population to provide shelter. In order to solve this problem I employ a two-stage procedure using distance to missionary hotbed Delft as an instrument for Catholic church strength in the Protestant Northern Netherlands. The procedures will be described in more detail below.
RESULTS
Baseline Models
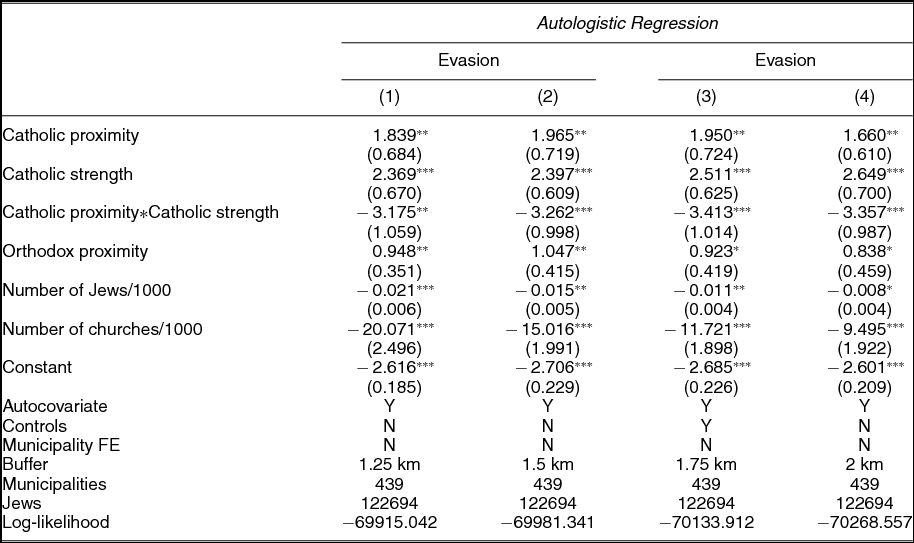
Results of the statistical analysis are presented in Models 1–6 (see Table 2). Model 1 demonstrates that even when we control for repressive reach and levels of Jewish integration the proportion of Catholic churches in a 1.25 km radius improved evasion in regions dominated by Protestants. However, this effect becomes less strong once a region becomes more Catholic and turns negative once Catholics start dominating an area. Because it is somewhat difficult to interpret interaction effects in a logistic regression environment, I plotted the effect of moving the proportion of Catholic churches from its minimum to its maximum value for varying levels of Roman Catholic strength in Figure 5.
Autologistic Regression of Jewish Evasion

Notes: Entries are logistic regression coefficients.
Municipality clustered standard errors in parentheses.
*p < 0.05; **p < 0.01; ***p < 0.001.
The Change in Predicted Probability of Evasion with 90 Percent Confidence Intervals as Catholic Proximity Moves from its Minimum to its Maximum Value Conditional on Catholic Strength in Region Using 1.25 km Buffer

Catholic church proximity increases evasion with more than 30 percent in mostly Protestant counties, has no effect in mixed regions, and reduces evasion with almost 33 percent in Catholic regions. Hence, Catholic networks formed shells of protection around Jews in Protestant parts of the country, while Protestant networks had the same effect in Catholic regions, in line with hypotheses 1.1 and 1.2. An average Jew in a Protestant region had a 17 percent chance to evade deportation. Living close to Catholic churches increased this chance to 47 percent. Inversely, for an average Jew living in a Catholic region living close to Protestant churches would increase evasion from 26 to 59 percent.
Models 2–4 suggest that these interaction effects are not driven by the threshold of the radius used to calculate proportions. Regardless of whether we count churches within a 2, 1.75, 1.5, or 1.25 km radius, Catholic churches protect Jews in Protestant regions while Protestants did the same when they were a minority. Figure 6 shows the interaction plots. Although the shelter effect of Protestant communities in Catholic regions becomes a bit stronger when using larger buffers the results overall are the same.
The Change in Predicted Probability of Evasion with 90 Percent Confidence Intervals as Catholic Proximity Moves from its Minimum to its Maximum Value Conditional on Catholic Strength in Region: (a) 1.5 km Buffer; (b) 1.75 km Buffer; (c) 2 km Buffer; (d) Municipality FE: 1.25 km; (e) Municipality FE: 1.5 km; (f) Municipality FE: 1.75 km; (h) Municipality FE: 2 km

Supporting hypothesis 1.3, Models 1–4 also suggest that the presence of Orthodox Protestant churches increased evasion rates. This suggests that proximity to Orthodox Protestant churches made it easier for Jews to find shelter. Changes in the predicted probabilities of evasion when moving the Orthodox church measure from its minimum to its maximum value are shown in Figure 7. When using a 1.25 km radius to calculate proximity, the presence of Orthodox communities increases evasion by 19 percent. For the average Jew, living close to Orthodox churches would increase the chance of evasion from 29 to 48 percent.
The Change in Predicted Probability of Evasion as Orthodox Protestant Proximity Moves from its Minimum to its Maximum Value. Point Estimates are Represented by Points with 90 Percent Confidence Intervals

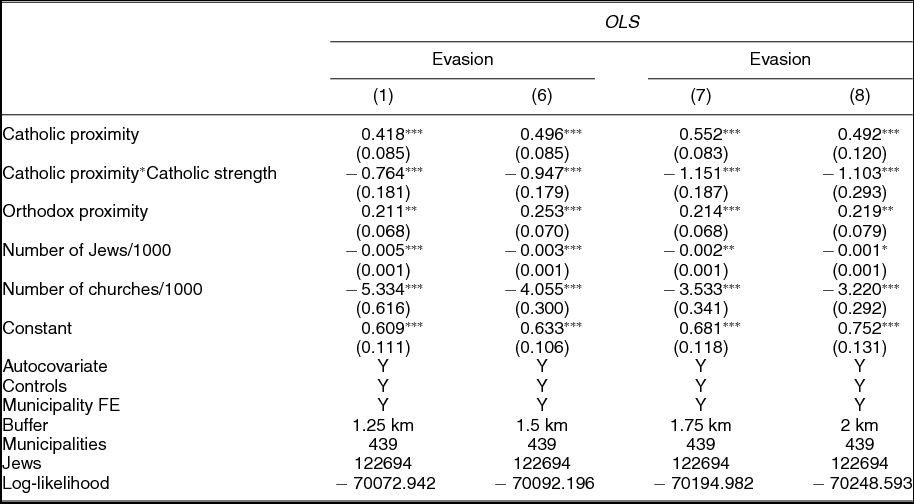
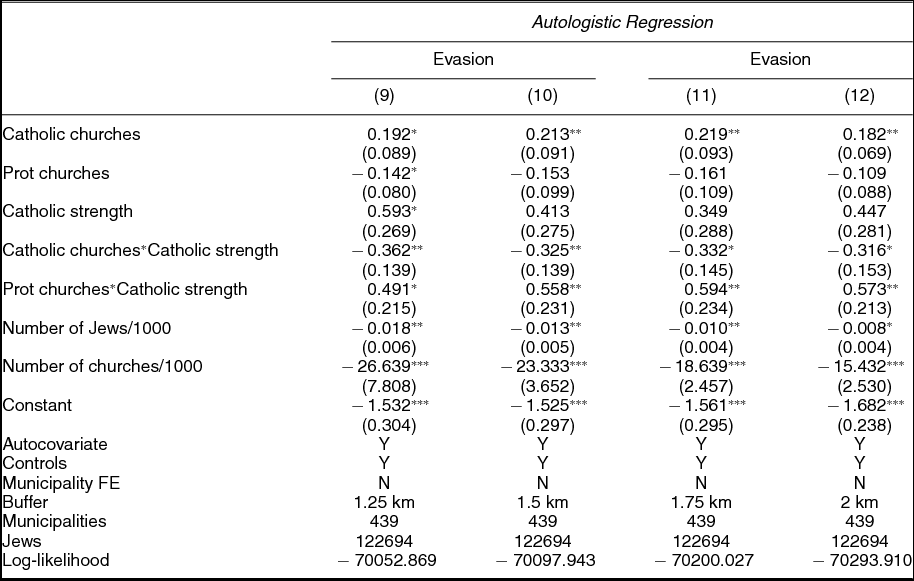
Models 5–8 show that our results are robust to including municipality fixed effects (see Table 3). This indicates that the results are not driven by municipality level omitted variable bias. It also suggests that the theory explains both within and between municipality variation at a fine-grained level. The predicted probabilities are presented at the bottom of Figures 5 and 6. Overall the effects of minority churches become stronger and more precise when municipality fixed effects are included, increasing my confidence in the minority hypothesis even more. According to the fixed effects specification with a 1.25 km buffer, Catholic church proximity increases evasion with almost 40 percent in mostly Protestant counties and has the reverse effect in Catholic regions. When the Orthodox proximity measure is moved from its minimum to maximum value, evasion increases with 21 percent. In Table 4 I use logged counts of protestant and catholic churches instead of church proportions to tap proximity to minority churches with separate measures. Results are plotted in Figure 8. In line with the minority hypothesis the number of Catholic churches has a positive effect on evasion in largely protestant regions but not in Catholic parts of the municipality. With the exception of the 1.25 km buffer the reverse is true for the number of Protestant churches.
Regression of Jewish Evasion: Municipality Fixed Effects

Notes: Entries are unstandardized regression coefficients.
Municipality clustered standard errors in parentheses.
* p < 0.05; **p < 0.01; ***p < 0.001.
Autologistic Regression of Jewish Evasion: Church Counts

Notes: Entries are logistic regression coefficients.
Municipality clustered standard errors in parentheses.
* p < 0.05; **p < 0.01; ***p < 0.001.
Marginal Effect of Number of Catholic and Protestant Churches (Logged) on Probability of Evasion with 90 Percent Confidence Intervals: (a) Catholic (1.25 km); (a) Protestant (1.25 km); (b) Catholic (1.5 km); (c) Protestant (1.5 km); (d) Catholic (1.75 km); (e) Protestant (1.75 km); (f) Catholic (2 km); (h) Protestant (2 km)

Instrumental Variable
To rule out worries about tolerance being a confounder, I use a particular aspect of the diffusion of Catholic minority enclaves that is unlikely to be correlated with local tolerance. As mentioned above, some of the denominational variation in the Netherlands can be traced back to acts of individual missionaries. The existence of Catholic deviance in the Protestant Northern Netherlands is largely due to one man: Sasbout Vosmeer.Footnote 14 In 1602 Vosmeer was appointed the first Vicar to the Catholic mission in Protestant Holland by Pope Clemens VIII. Right after his appointment, he had to move back in with his parents who lived in strictly Protestant Delft because the reformation had destroyed most Catholic resources in the North (Rogier Reference Rogier1964).
Historians of Catholicism refer to the counter-reformation as a wildfire, spreading from Delft outwards to other parts the Northern Netherlands. Whomever was closest to Vosmeers’ fire was most likely to return to the Roman Catholic church. Rogier even goes as far as to say that the religious map of the Northern Netherlands would have looked fundamentally different if Vosmeers’ parents had decided to move to Dordrecht or Utrecht (Rogier Reference Rogier1964). Given the absence of strong Catholic networks in this region, Vosmeer had to travel by night dressed up as a land worker and relying on personal networks to win back the hearts and minds of the Hollanders. Vosmeer initially met with limited success, but over time his efforts began to pay off as he built enclaves of Catholics in the region (Rogier Reference Rogier1964). Due to the arduous nature of 16th century travel his successes undoubtedly declined with distance.
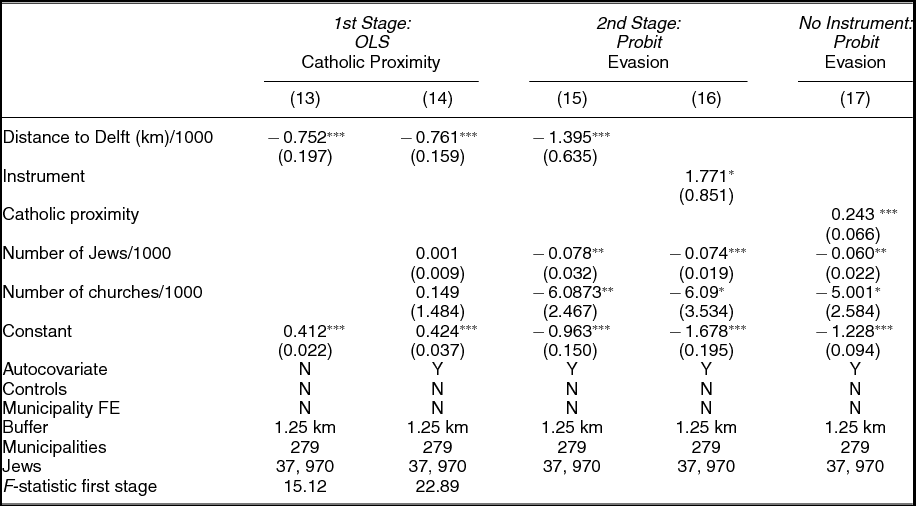
I assume that the concentric spread of Catholicism around Delft has created a lasting imprint on religious deviance in the Northern Netherlands that is unrelated to latent tolerance towards minority groups. In the first stage regression, I deploy an OLS model to predict a Jews proximity to Catholic churches in Northern Netherlands with a variable that measures Distance to Delft in kilometers. The measure is divided by 1000 to reduce the number of digits. Again standard errors are clustered on a municipality level. As is evident from the large F-statistics distance in Models 13 and 14, distance to Delft is a strong instrument for the share of Catholic churches, regardless of whether or not we control for the number of churches, Jews, and spatial autocorrelation (see Table 5). The reduced form analysis, presented in Model 15, shows a negative relationship between evasion and distance to Delft. Model 16 presents the second stage of a two-stage probit model. This second stage uses only the Catholic proximity that is due to distance from Delft (Instrument) to predict individual level evasion. The effect of Catholicism on evasion in the Protestant Northern Netherlands is robust in the IV specification. Increasing the instrument from its minimum to its maximum value increases evasion by 28 percent. If we compare Models 16 and 17 we see that the effect in the IV specification is stronger than if the regular measure is used suggesting that the relationship between the presence of minority churches and evasion is stronger if omitted variable bias is reduced.
The Effect of Religious Minorities on Evasion: Results Based on Distance to Delft

Notes: Model 13 and 14: entries are unstandardized regression coefficients.
Model 15–17: entries are Probit regression coefficients.
Municipality clustered standard errors in parentheses.
* p < 0.05; **p < 0.01; ***p < 0.001.
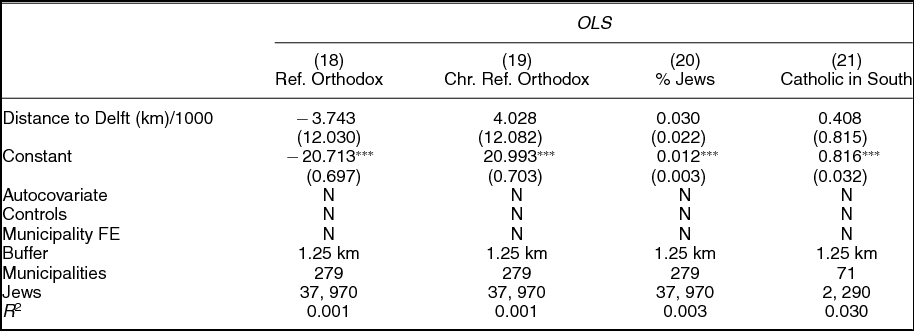
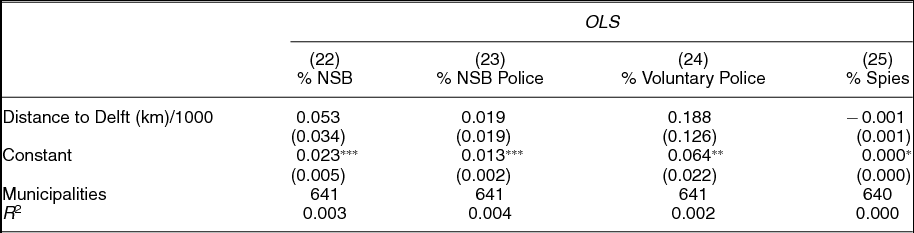
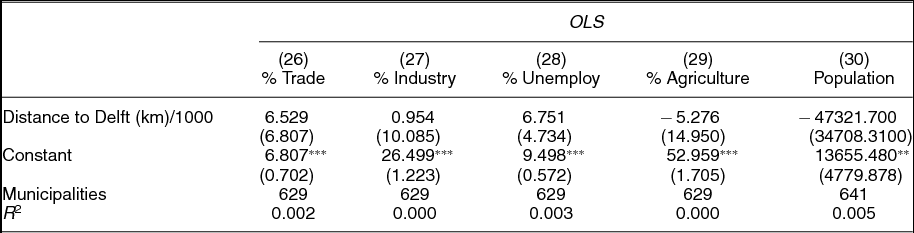
I corroborated the assumption that distance to Delft is unrelated to overall tolerance by regressing it against the presence of other religious minorities (see Table 6). As one can see in Models 18–20, the instrument is not significantly related to the presence of any of the Orthodox Protestant churches or Jews in the region. Models 22–25 regress distance to Delft against data obtained from postwar trials and show that the instrument is not correlated with membership among citizens and police officers of the anti-Semitic NSB movement, the percentage of the population that volunteered to arrest Jews, and the percentage of the population that spied for the Nazis (see Table 7). Taken together these models suggest that distance to Delft indeed affected the diffusion of Catholicism in ways unrelated to tolerance for minority groups. To assess whether distance to Delft might affect other socioeconomic characteristics of regions related to Catholicism, I regress the measure against unemployment levels, population, and the percentage of people working in trade, industry, agriculture in the relevant municipalities. Data were obtained from the 1930 census (CBS 1931). Table 8 shows that no considerable relationships exist. Finally, I also conducted a placebo test, testing whether distance to Delft affected the Catholic church share in the nearby south where missionary effects should not be visible given the overall dominance of the Roman Catholic Church. As model 21 suggests, Distance to Delft did not influence the proximity to Catholic churches for Jews living in this predominantly Catholic region, providing further evidence for the notion that it captures the imprint of missionary activities unrelated to other factors (see Table 6).
Validity of Distance to Delft as an Instrument, 1

Notes: Entries are unstandardized regression coefficients.
Municipality clustered standard errors in parentheses.
* p < 0.05; **p < 0.01; ***p < 0.001.
Validity of Distance to Delft as an Instrument, 2

Notes: Entries are unstandardized regression coefficients.
Robust standard errors in parentheses.
* p < 0.05; **p < 0.01; ***p < 0.001.
Validity of Distance to Delft as an Instrument, 3

Notes: Entries are unstandardized regression coefficients.
Robust standard errors in parentheses.
* p < 0.05; **p < 0.01; ***p < 0.001.
DISCUSSION
This article has sought to establish that religious minorities are more likely to protect victims of mass persecution by studying the collective rescue of Jews in the Netherlands during the Holocaust. Despite its unique religious configuration there is suggestive evidence that the lessons learned from the Dutch case can be applied to other times and places. Further to the South, Protestant groups were strongly over-represented among rescuers of Jews in Catholic stronghold France. Although Protestants made up only two percent of the French population, they provided more than 10 percent of all rescuers with those from Chambon Sur Lignon and the Cévennes region as the most well-known examples (Cabanel Reference Cabanel2008). This pattern is not unique to Western Europe and is confirmed by evidence from Western Ukraine, where a large number of the survivor records collected after the war came from people hidden by minor Protestant groups (Berkhoff Reference Berkhoff2009). There is also evidence indicating that the reverse story holds. One of the strongest rescue networks in Protestant Berlin was build around a circle of Catholics coordinated by social worker Grete Sommer (Phayer Reference Phayer1993) It has also been claimed that German Catholics were in general more tolerant towards Jews due to their minority position, especially compared to their coreligionists in Catholic Austria (Pulzer Reference Pulzer1988).
What about other genocides? The Rwandan case is interesting because religious cleavages did not reinforce ethnic differences in this predominantly Catholic country. Yet again there is evidence that sects such as the Pentecostals and Abarokore actively opposed mass killings. For other Protestant minorities the picture is less clear. Although examples of rescue attempts by Seventh Day Adventists and more mainstream Presbyterians have been documented, we also know that they sometimes actively engaged in killings (Fujii Reference Fujii2011; Longman Reference Longman2010). In line with the minority hypothesis however Muslims staged a coordinated challenge to killers in the northern Rwandan region Mabare, demonstrating that minority rescue was not unique to Christians (Viret Reference Viret2008). Islam on the other hand was a driving force in the Armenian genocide, where the Young Turks used religion to mobilize the majority of the population against a small group of Christians. Consistent with what we saw in our analysis of the Netherlands help for persecuted Armenians mainly came from Kurdish sects, western missionaries and small patches of Syrian Christians (Ternon Reference Ternon2008). Here the religious minority status was thus reinforced by an additional minority status.
This raises the question of whether the mechanisms outlined in this article also apply to nonreligious minorities such as ethnic groups, immigrants, or political factions. In the Dutch case there is indeed some evidence that indicates that radical socialists, communists, and immigrants working in the mining industry were also able to set up early evasion networks. Often these groups functioned as religious sects in that they combined discipline with a solemn commitment to the group (Hilbrink Reference Hilbrink1989; van Rens Reference van Rens2013).
It is important to highlight that the minority hypothesis is not deterministic: minority membership does not insulate everyone from engagement in violence. Kurdish tribes did take part in the Armenian massacres (Ternon Reference Ternon2008), while some important Genocidaires in Rwanda such as Hassan Ngeze were actually Muslim (Straus Reference Straus2006). Future studies should identify why some (members of) minority communities are activated to collectively resist political violence and others are not.
Although further research is required to fully assess whether the minority hypothesis travels to different contexts, it could potentially have important implications for foreign interventions in mass conflicts. When resources are scarce, targeted campaigns to bolster minority groups might be an successful way to impede the spread of mass killings in the short run. In addition, building bridges between different minority groups might produce large scale inter-regional resistance movements against violence in the long run which could enable interveners to stop the violence altogether.
Theoretically, this article builds on but also extends the recently growing number of studies that deploy a community perspective on genocide. While most of this work assumes homogeneous community effects the current analysis suggests that the local level consists of multiple layers that interact with each other. Cleavages at the lowest level work out differently depending on cleavages on a higher level as this research shows that peaceful resistance emerges when local cleavages are in conflict with higher order cleavages.
All in all, this article is not as much a story of hope as of tragedy. The theory reveals how successful, rapid collective mobilization in the face of genocide depends upon relatively strong social ties among well screened community members. The necessity to restrict channels of recruitment to trusted ties however prohibits the expansion of collective rescue efforts beyond a narrow set of like-minded actors. In other words, being a religious minority not only explains mobilization, but also its disjointed nature as segregated networks only have limited carrying capacity to provide assistance. This becomes clear when we look at the Netherlands where less than 30 percent of Jews were able to survive. In facing a powerful and motivated killing force scattered forms of collective mobilization could only have a limited impact. Despite interconfessional collaboration at the top, it was not until relatively late—too late—that we saw the growth of a mass movement linking separate networks that cooperatively could have made a bigger impact early on.






Comments
No Comments have been published for this article.