I. INTRODUCTION
Many grand challenges in energy conversion and storage need discovery of new materials. Reference Yang and Tarascon1 However, there are not too many reported synthesis approaches that could easily be implemented for screening and rational understanding of structure–behavior relationships. Specifically, the challenges include semiconductors for photoelectrochemical water splitting, Reference Lewis and Nocera2 stable electrocatalysts for oxygen evolution and reduction Reference Cheng, Shen, Peng, Pan, Tao and Chen3 and nitrogen reduction, Reference Yandulov and Schrock4 and for many heterogeneous gas–solid reactions including carbon dioxide reduction. Reference Lewis and Nocera2 Many of the above challenges require synthesis of multielement solid solutions with composition over entire range regardless of phases present.
The conventional synthesis method is a solid state route that involves the mechanical milling of oxides, carbonates or nitrates. Reference Armijo5 Solid state route is highly unfavorable because it requires long processing time and elevated temperature and pressure. Reference Stein, Keller and Mallouk6 Consequently, wet chemical methodologies, such as sol–gel, Reference Banger, Yamashita, Mori, Peterson, Leedham, Rickard and Sirringhaus7 co-precipitation Reference Rojas, Vila, García and de Vidales8 solvothermal techniques, Reference Matsushita, Ueda and Ueda9 pyrolysis in air, Reference Seley, Ayers and Parkinson10 have all been proposed to deal with this problem. However, these methods require prolonged heat treatments and therefore are primarily restricted to equilibrium phases. Reference Bau, Li, Marenco, Trudel, Olsen, Luber and Buriak11 Besides, they are also low yield methods and involve multistep and laborious processes, each bearing a risk of introducing impurities to the final product. More so, with these methods, it is quite a challenge to control the size and composition of mixed metal oxide nanoparticles, a key parameter for the properties and performance of these materials.
So, there have been concerted efforts to make mixed metal oxide in a single step from inexpensive materials with high scalability and control over size and final product composition, by using the flame spray pyrolysis (FSP) methods such as vapor-fed FSP, Reference Pratsinis12 liquid-fed FSP Reference Messing, Zhang and Jayanthi13,Reference Lewis14 and liquid-fed flame assisted spray pyrolysis. Reference Marshall, Telford and Wood15 Unfortunately, metal oxides produced through vapor-fed spray pyrolysis are limited to few oxides such as zirconium, aluminum, titanium, and silicon based oxides. Reference Pratsinis12 In addition, the starting materials of this synthesis route are basically volatile chlorides that release by-products such as hydrogen chloride gas which are not benign from the environmental perspective. Vapor-fed FSP has been improved upon by the incorporation of a liquid feed system, Reference Pratsinis12 making the process cleaner and has been shown with many metal oxides. Both liquid-fed flame assisted and FSP use either the enthalpy of combustion of precursors or external high enthalpy value flame for providing temperatures up to 2800 K. Reference Mueller, Jossen, Pratsinis, Watson and Akhtar16 Earlier works on combinatorial synthesis have used pyrolysis in air to convert precursor to mixed metal oxides, but have failed to show strong evidence that solid solutions are really formed. Reference Seley, Ayers and Parkinson10,Reference Katz, Gingrich, Santori and Lewis17 Many of these techniques have only demonstrated to produce certain stable phases of mixed metal oxide solid solutions. However, it is crucial to be able to synthesize mixed metal oxide solid solutions over complete range of compositions for discovering new materials and for addressing grand challenges in energy conversion and storage.
So, here, a concept on the use of plasma oxidation involving mixed solution precursors is investigated. The liquid droplets are sprayed into high energy oxygen plasma where they react to form an oxidized solid powder. Earlier studies using plasma oxidation schemes have shown ultrafast timescales for both molten metals Reference Kumar, Kim, Pendyala, Chernomordik and Sunkara18 and also metal oxides in the presence of alkali salts. Studies involving inductively coupled plasma for droplet-to-particle concept have been successful but only shown with single component. Reference Hasegawa, Kato, Kagawa and Syono19,Reference Suzuki, Kagawa, Syono and Hirai20 Recently, Schaefer and co-workers Reference Schaefer, Kumar, Mohan Sankaran and Schlaf21 studied the gas phase nucleation and in vacuo deposition of iron oxide nanoparticles from ferrocene vapor in a microplasma reactor. The difficulties inherent in vapor phase nucleation are lack of precise compositional control in making multimetal oxides. While there are few studies on synthesis of mixed metal oxides by plasma oxidation of liquid droplets, Reference Marr, Kuhn, Metcalfe, Harris and Kesler22,Reference Chang, Tolava, Erwin, Yang, Li, Lee, Wu and Hsu23 none to the best of our knowledge has demonstrated the compositional tuning capability of this method. Ultrafast timescales expected with plasma oxidation using oxygen radicals can inhibit steady state diffusion associated with equilibrium phase formation and thus leading to metastable phases such as solid solutions with varying composition over the entire range.
Specifically in this paper, the synthesis of mixed transition metal oxide comprising of binary metal oxides (nickel–manganese oxide, nickel–iron oxide) and ternary mixed metal oxides (involving nickel, manganese, and iron) have been demonstrated with exceptional control over composition and phases. To understand the functional behavior of these synthesized materials, we tested the activity of the above nanoparticles as an electrocatalyst for oxygen evolution reaction (OER). The OER, 2H2O → 4H+ + O2 + 4e − (acidic solution) or 4OH − → 2H2O + O2 + 4e − (basic solution), is heavily reliant on efficient electrocatalysts because it is kinetically sluggish and thus constitutes an outlet for efficiency loss and places a significant overpotential requirement in water splitting reactions. Reference Cook, Dogutan, Reece, Surendranath, Teets and Nocera24,Reference Suntivich, May, Gasteiger, Goodenough and Shao-Horn25 Cogent understanding of the structural morphology and composition of catalysts at a molecular level has been instrumental in the rational design of robust electrocatalysts with high activities. The state-of-the-art OER electrocatalysts like RuO x , IrO x , and Pt are quite expensive; hence, it is important to find low-cost and readily available alternatives. High-throughput materials synthesis and screening have recently been used to find these alternatives, and the oxides of first row transition metals like nickel, iron, and cobalt have been reported to be good candidates. Reference Gerken, Chen, Massé, Powell and Stahl26,Reference Xiang, Suram, Haber, Guevarra, Soedarmadji, Jin and Gregoire27
II. EXPERIMENTAL
A. Synthesis and electrode preparation
Experiments on precursor liquid droplet oxidation were performed using a homemade atmospheric microwave plasma flame reactor. There are two different reactor configurations: upstream and downstream [refer to Supplementary information Figs. S1(a) and S1(b)]. In the first design, the plasma flame is oriented vertically in such a way that the tip of the jet is pointing upward, whereas in the second design, the tip of the jet points vertically downward. While the first design is convenient for thin film deposition on substrates, the second design is especially useful where fairly large amounts of ultrafine mixed metal oxide powders are needed. In the downstream plasma configuration, compressed air and precursor liquid are forced through the nozzle of an atomizer creating liquid droplets of the precursor of an average size of ∼5 μm that are transformed in mixed metal oxides as they pass through the plasma flame. Converted nanoparticle powder is directed by the vacuum pump into the air filter, where the powder is collected.
The electrodes were prepared by using the upstream plasma jet configuration. The precursor solutions were prepared using mixtures of nickel, iron, and manganese nitrates in desired proportion. Chemically pure grade of nickel(II) nitrate hexahydrate, manganese(II) nitrate hydrate, and iron(II) nitrate nonhydrate (research grade, Sigma Aldrich, St. Louis, Missouri) were used as starting materials without further purification. Appropriate amount of the precursors was weighed out and dissolved in deionized (DI) water to make up 1 M solution. About ∼0.1 mL of prepared metal precursor solution was sprayed onto 2 cm2 fluorine-doped tin-oxide (FTO) coated glass substrates (Hartford Glass, Hartford, Connecticut) which were exposed to the upstream plasma jet with an input power of 500 W and a volumetric flow of 2 standard liters per minute (slpm) Ar, 11 slpm air, for 30 s. The argon gas is only necessary for plasma ignition, and is turned off after obtaining a stable plasma. The substrate temperature is measured using a pyrometer and is determined to be anywhere between 500 and 550 °C. The catalyst adhered very well to the surface of the substrate forestalling any use of a surfactant. The plasma power was set in such a way that the temperature of the substrate did not exceed 550 °C. The maximum temperature of 550 °C is set by the thermal stability of FTO-coated glass substrates, and the choice of FTO-coated glass substrates is based on its poor electrocatalytic properties. Substrates were cleaned prior to deposition by ultrasonication in an alkaline aqueous solution, deionized water, ethanol, and DI water for 10 min/step.
B. Material characterization
The morphology of the nickel–manganese oxide nanoparticles was characterized using a FEI Nova 600 NanoLab scanning electron microscope (SEM; FEI Company, Eindhoven, The Netherlands). A Bruker D8 powder x-ray diffraction (XRD; Bruker Corporation, Billerica, Massachusetts) system was used for crystal phase analysis. The data were processed to analyze sample NiMn0.2Fe1.8O4 using FullProf.2k (Version 4.30—April, 2008-ILL JRC) in the Rietveld method for structure refinement. Program refinement of the first samples was started with the space group Fd3m, origin at
 $\bar 3m$
, O in 32e−, A site in 8f, and B site in 16c. In the first step, the global parameters, such as 2θ-zero and background, were refined. In the next step, the structural parameters, such as lattice parameter, atomic coordinates, and site occupancy, were refined. High-resolution transmission electron microscopy (HRTEM), selected area electron diffraction (SAED) and nanoprobe-based energy dispersive x-ray spectroscopy (EDX) measurements were conducted using a FEI Tecnai F20 transmission electron microscope (TEM).
C. Electrochemical measurements
All the measurements were done in a three electrode setup equipped with SP-100 (Bio-Logic SAS, Claix, France). A saturated calomel electrode (SCE) was used as reference electrode. All potentials were converted and referred to the reversible hydrogen electrode (RHE) using the Nernst equation:
 $${E_{{\rm{RHE}}}} = {E_{{\rm{SCE}}}} + 0.241 + 0.059{\rm{pH}}\quad .$$
All measurements were performed in 1 M NaOH solution. The uncompensated resistance (R u) of the cell was measured with single point high frequency impedance measurement, and current solution resistance (IR) drop was compensated at 85% through positive feedback using bio-logic EC-lab software. Our typical electrochemical cell had internal resistance, R u around 20–25 Ω in 1 M NaOH.
III. RESULTS AND DISCUSSION
Experiments were conducted using several binary and ternary systems and the results are analyzed with various techniques to confirm that the composition of resulting solid solutions can be tuned over entire ranges. In fact, the data show complete tunability with respect to compositional control using precursor composition in liquid droplets. Specifically, the results with nickel and manganese oxides for binary systems and nickel, manganese and iron oxide solid solutions for ternary systems are illustrated. In addition, the resulting ternary solid solutions are investigated for their performance as electrocatalysts for OER.
A. Nickel–manganese oxide (Ni x Mn1−x O y )
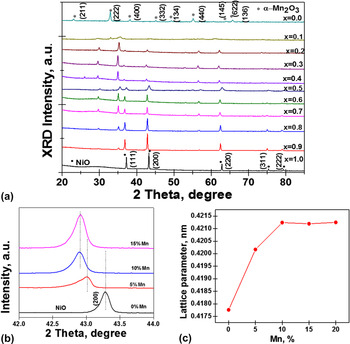
The mixed metal oxide is in general represented by Ni x Mn1−x O y where 0.0 ≤ x ≤ 1.0 and y are dependent on the type of phase present. Throughout the full range of composition, 0.0 ≤ x ≤ 1.0, the phase(s) present depends mainly on the x composition in the sample. Two clear phase regimes can be identified from XRD: (i) solid solution of Ni k Mn1−k O (0.9 < x ≤ 1) (ii) a solid solution of Ni m Mn3−m O4 (0.05 < x ≤ 0.9), where the indices k and m defines the rock-salt and spinel solid solution series, respectively. In the entire range, there is no segregation of NiO and MnO x phases as evidenced by the absence of clear α-Mn2O3 (221) peaks and the shrinking of NiO (222) peak from x = 1.0 until it disappears at x = 0.4.
B. Solid solution of Ni k Mn1−k O
In this compositional range 0.9 < x ≤ 1, a solid solution is formed whose composition can be tuned. The resulting solid solution has the rock-salt phase (space group:
 $Fm\bar 3m$
). The XRD data in Fig. 1(a) show pure phases for NiO and α-Mn2O3 cubic phases and Fig. 1(b) shows the (200) peak of the rock-salt phase (at 43.3°) for Ni
k
Mn1−k
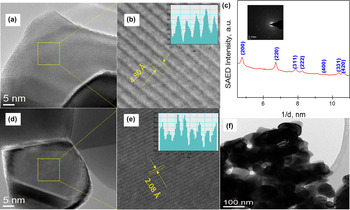
O solid solutions. The 43.3° peak position shifts monotonically to lower angles with the increase of manganese concentration. Figure 1(c) shows the plot of the variation of lattice parameter with Mn mol% doping in Ni lattice. Clearly, the lattice parameter increases nonlinearly until it reaches the solubility limit which is about 10 mol% Mn composition or x = 0.90. It is noteworthy that at compositions above the solubility limit of Mn in Ni lattice, the speciation of the spinel phase is more evident. The crystal structure of sample with x = 0.90 was examined with HRTEM and the SAED, and the result is in agreement with the XRD results (Fig. 2).
(a) XRD of Ni x Mn1−x O y (0.0 ≤ x ≤ 1.0) showing the phases present as x is varied, 2 theta range of 42–44°marked by (200) peak is expanded in (b) for clarity. (b) XRD showing the (200) plane of NiO lattice shifting to a lower angle with Mn doping. (c) Variation of the NiO lattice parameter with Mn doping concentration.

(a) HR-TEM of sample x = 0.9, showing grains with single lattice fringes having d-spacing indexed to (101) of the tetragonal spinel lattice, (b) a close-up view of the lattice fringes showing d 101 to be 4.80 Å, (c) SAED of sample x = 0.9 (inset) showing the diffraction rings. The intensity line profiles measured from these patterns are as shown, assigned to the rocksalt phase with some spinel peaks, which is in agreement with XRD data, (d) HR-TEM of sample x = 0.9, showing grains with single lattice fringes having d-spacing indexed to (200) of the rocksalt lattice, (e) a close-up view of the lattice fringes showing d 200 to be 2.08 Å, and (f) bright field TEM of composition x = 0.9.

C. Solid solution of Ni m Mn3−m O4 spinel
In this compositional range 0.05 < x ≤ 0.9, the XRD data for samples were indexed to spinel solid solutions (Ni m Mn3−m O4). The sample with composition x = 0.30 showed well-resolved diffraction lines corresponding to a tetragonal spinel phase (ICDD PDF-01-070-9039) with space group number I41/amd (141). XRD data for samples with the following x composition and the corresponding m values in bracket: 0.50 (1.50), 0.40 (1.20), 0.30 (0.90), 0.25 (0.75), 0.20 (0.60), show that phase pure Ni m Mn3−m O4 bimetal spinel solid solutions exist in the composition range 0.20 < x ≤ 0.50 (or 0.60 < m ≤ 1.50). The series of oxides with composition 0.05 < x ≤ 0.20 shows peak deviation from nickel manganite peaks, and peaks at (112) and (103) were highlighted in Fig. S2 (Supplementary information) for emphasis. There is a widening of the gap between the centerlines of these two peaks coupled with peak broadening until manganese oxide (Mn3O4 and α-Mn2O3) peaks are evolved at x = 0.05. Peak broadening can be ascribed to the non-uniform strain on the spinel lattice. It is interesting to note that at nickel composition x ≤ 0.05, there is not enough Ni(II) to diffuse into the solid lattice of Mn3O4 to occupy the manganese vacancies or partially replace manganese ions in the tetrahedral or octahedral holes. Reference Burns28 In the compositional range 0.5 < x ≤ 0.9, there is a co-existence of spinel solid solutions and rock-salt (Ni0.9Mn0.1O), however; at x > 0.5, only phase pure Ni m Mn3−m O4 can be seen. Similar bimetallic oxide systems were reproduced for the nickel ferrite, available in the Supplementary information Fig. S3.
The spinel manganites are known to exhibit large tetragonal distortions. Reference Ko, Li, Podraza, Dickey and Trolier-McKinstry29,Reference Noh, Yeo, Kang, Zhang, Cheong, Oh and Johnson30 The tetragonal distortion is a consequence of Jahn–Teller effect of the cubic spinel associated with a high density of Mn3+ cations. Reference Miyahara31 Large amounts of Mn3+ are found in Mn-rich nickel–manganese spinels due to the reduced amount of Ni2+ on the octahedral sites of the spinel lattice. Reference de Györgyfalva and Reaney32 The Mn valence states are strongly dependent on Ni occupancy in the octahedral sublattice, which is a measure of inversion parameter of the spinel lattice. Ni cations moving to the octahedral sublattice are balanced by the Mn going in the opposite way (tetrahedral sites). The tetrahedral Mn has a valence state of +2 since Mn3+ is a less suitable state in a 4-fold coordination. To attain charge neutrality, an equal amount of Mn4+ is formed in the octahedral sites to compensate for the Mn2+ on the tetrahedral sites, resulting into internal disproportionation. Reference Díez, Schmidt, Sagua, Frechero, Matesanz, Leon and Morán33
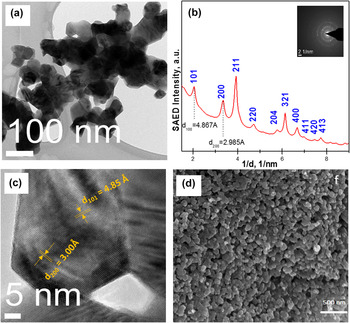
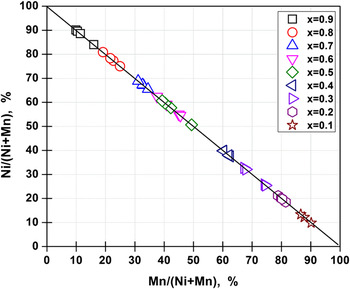
The XRD data are further corroborated with diffraction and EDX analysis using HRTEM. A representative sample x = 0.2 is used as an example to confirm the morphology and crystal structure. Figure 3(a) shows the bright field TEM image for the solid solution with composition x = 0.2 where a rapidly changing strong diffraction contrast can be noticed, an indication of randomly oriented grains and polycrystallinity of sample. The SAED patterns obtained for sample x = 0.2 are shown in the inset of Fig. 3(b). The intensity line profiles measured from these patterns are shown in Fig. 3(b). About ten diffraction rings are visible which correspond to the family of planes of the tetragonal spinel nickel manganite; the other rings were not clearly detectable due to their low intensity. Formation of tetragonal spinel phase is further confirmed from the sample with composition x = 0.2 by the HRTEM analysis. We identified two of lattice fringes, one with the d-spacing of 4.85 Å and the other one with the d-spacing of 3.00 Å, which are consistently observed in HRTEM images of the nanoparticles [Fig. 3(c)]. Knowing that the typical accuracy of HRTEM analysis is usually not better than a few percent, the observed lattice fringes can be assigned to the (101) and (200) planes of tetragonal spinel Ni0.6Mn2.4O4. As expected, the HRTEM data did not show any presence of α-Mn2O3 and NiO phases in this sample composition. SEM image [Fig. 3(d)] of the solid solution with sample composition x = 0.2 has a morphology resembling cubes interconnected by a channel. Figure 4 shows TEM-EDX compositions of four randomly selected grains of samples with precursor compositions x = 0.1 to x = 0.9, showing strong agreement with the precursor composition.
(a) Bright field TEM of composition x = 0.2 with a crystallite size of 50–80 nm, (b) SAED of sample x = 0.2 (inset) showing ten diffraction rings. The intensity line profiles measured from these patterns are as shown, assigned to the tetragonal spinel, which is in agreement with XRD data, (c) HR-TEM showing grains with two lattice fringes having d-spacing indexed to (101) and (200) planes of the tetragonal spinel crystals, and (d) SEM micrograph of samples x = 0.2 showing its morphology.

TEM-EDX composition of the four selected nanoparticle grains with Ni at.% on the vertical axis and Mn at.% on the horizontal axis.

D. Comparison between plasma and thermal oxidation
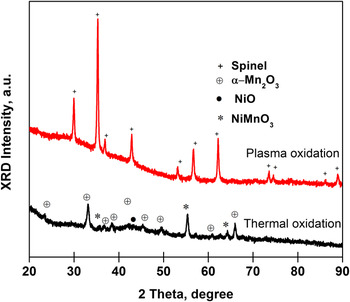
To understand whether one can obtain similar results with thermal oxidation, a sample with composition x = 0.2 is investigated using thermal oxidation route. The phases obtained were the ilmenite (NiMnO3), bixbyite (α-Mn2O3), and the bunsenite (NiO) phases, which are completely different from the result obtained with plasma oxidation (refer to Fig. 5). The difference in the phases can be ascribed to the dissimilar mechanistic steps obtainable in the two oxidation processes, given that the reaction temperature and pressure are same. As can be seen from the results, plasma oxidation better reflects the reaction off-stoichiometry, producing solid solution of nickel manganite spinel. However, the thermally oxidized sample are segregated into thermodynamically stable monometal oxide (bunsenite and bixbyite) and mixed metal oxide (ilmenite) phases in agreement with Xiao-Xia and co-workers. Reference Xiao-Xia, Manthiram and Goodenough34
X-ray diffraction of the sample with nominal composition of x=0.2 prepared via plasma and thermal oxidation.

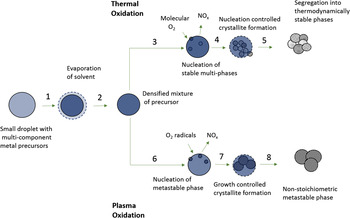
To explain the differences between thermal and plasma oxidation, a proposed mechanism as elucidated by the schematic presented in Fig. 6 is used to illustrate various stages of oxidation process. The following are the stages of oxidation: first of all, upon either plasma exposure or thermal heating, the liquid droplet will lose solvent by evaporation until a densified amorphous phase is formed. In the case of thermal oxidation, heating and cooling rates are slow and so atoms have enough time to diffuse, inducing a phase transformation toward thermodynamically stable phases. So, irrespective of precursor composition inside liquid droplets, the resulting materials would consist of thermodynamically stable phases. The oxidation proceeds with diffusion of molecular oxygen into the amorphous mass containing nitrates and the thermal decomposition of the amorphous mass to release NO x . After an induction period, nuclei are formed. In the case of plasma oxidation, several processes take place in a very short period of time of a few seconds and they include the following: oxygen radicals can diffuse into the core of the densified amorphous mass of precursor; faster reaction kinetics with oxidation of nitrates with oxygen radicals; and fast heating and cooling rates of the core for nucleation and transport limited ordering of atoms make for the speciation of metastable phase nuclei. As the growth proceeds with transport limited region, the composition of resulting solid solutions depends directly on the composition of elements in the surrounding environment. The composition of the surrounding nutrients is as homogenous and similar to the supersaturation; thus, the growing crystals reflect this compositional homogeneity and on rapid cooling, the diffusion of atoms is suppressed, which leads to a non-equilibrium solid solution phase growth. Average size of crystallites obtained in plasma oxidation is about twice that of thermal oxidation indicating fast growth kinetics compared to thermal oxidation.
Proposed mechanism for the formation of nanoparticles of thermally oxidized and plasma oxidized precursor solutions.

E. Ternary solid solutions of NiMn z Fe2−z O4 (0 ≤ z ≤ 1)
Ternary spinel oxides comprising manganese substituted nickel ferrite, with nominal series formula NiMn
z
Fe2−z
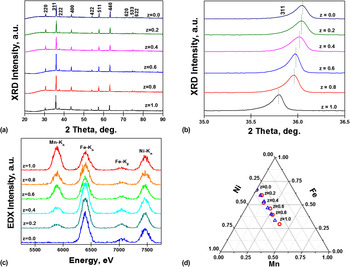
O4 (where z = 0.0, 0.20, 0.40, 0.60, 0.80, and 1.0) have been successfully synthesized by the plasma spray method. The XRD reflections [Fig. 7(a)] show highly crystalline nanoparticles with exceptional phase purity. Figure 7(b) shows an expanded view of (311) peak position. As can be seen, there is a monotonic shift of the 311 peak position to the left with increasing manganese doping, an indication of the formation of a spinel solid solution. The same family of peaks indexed to cubic spinel phase (space group:
 $Fm\bar 3m$
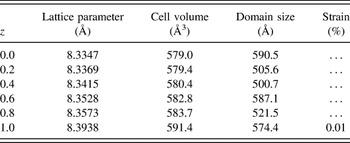
) appears in all six samples and no foreign peak was observed, an indication that no other phase co-existed with sample phase. The domain size of microstrain was estimated from Williamson–Hill (W–H) plots (Supplementary information S4) and tabulated as shown in Table I. After a linear fit to the W–H plot, the microstrain and domain size were extracted from the slope and vertical axis intercept, respectively. Results reveal that the strain portion of the W–H plot has no contribution to the line broadening (Supplementary Fig. S4) except for the sample z = 1.0 with negligible microstrain (0.01%) as shown by Table I. The lattice parameter and unit cell volume expand isotropically as the density of the manganese dopant increases, and the crystal size is in the range 500–590 Å. For uniform strain, the unit cell dimensions change in an isotropic manner which leads to changes of the lattice parameters and a shift of the peaks with no accompanying broadening of the XRD reflections. The shape of peaks are unchanged from z = 0.0 to z = 1.0 which confirms the absence of anisotropic microstrain.
(a) XRD reflections of ternary spinel oxides comprising manganese substituted nickel ferrite NiMn z Fe2−z O4 (0 ≤ z ≤ 1) showing a single cubic spinel phase. (b) Zoom-in of (311) peak position showing a monotonic shift to a lower angle with increasing Mn doping concentration. (c) TEM-EDX spectra obtained at 0–20 kV, along with peak assignments for Mn, Ni, and Fe elements for various compositions (0 ≤ z ≤ 1). (d) Ternary plot of NiMn z Fe2−z O4 (0 ≤ z ≤ 1) showing an excellent match between the nominal precursor composition (∆) and the TEM-EDX measured alloy composition (○), in normalized atomic percent.

Structural parameters of NiMn z Fe2−z O4 (0.0 ≤ z ≤ 1.0) showing how lattice parameter, unit cell volume and anisotropic strain vary υ composition.

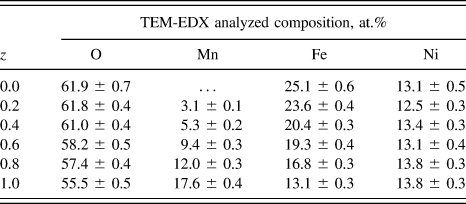
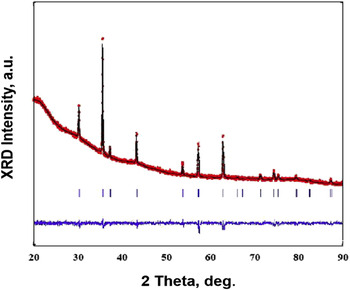
Figure 7(c) shows the typical EDX spectra obtained at 0–20 kV, along with peak assignments for Mn, Ni, and Fe elements for various compositions (0 ≤ z ≤ 1). The peak areas fairly match the precursor compositions, confirming the formation of ternary solid solutions [Fig. 7(d)]. After integrating the peak areas of Mn–Kα, Ni–Kα, Fe–Kα, and Fe–Kβ, we converted the x-ray counts into the elemental weight percentages using quantification software. The elemental analysis of the nanoparticles confirms that the proportion of the elements is consistent with the precursor composition (Table II). Figure 8 shows the XRD patterns and corresponding Rietveld analysis of as-prepared sample NiMn0.2Fe1.8O4, confirming the formation of spinel phases. Rietveld refinement and Bertaut method Reference Weil, Bertaut and Bochirol35 are used to determine the cation distribution (Supplementary information, Table S1). Combining the refined results and TEM elemental analysis, the structural formula of NiMn0.2Fe1.8O4 was determined to be (Ni0.1Mn0.15Fe0.75)8a [Ni0.9Mn0.05Fe1.05]16d O4, revealing a high degree of inversion in agreement with other results for ferrite spinel, Reference Birajdar, Shirsath, Kadam, Patange, Mane and Shitre36 where the parenthesis refers to the tetragonal sites while octahedral sites are represented by square brackets. For an AB2O4 type spinel, the extent to which sublattices are disordered is determined by the inversion parameter i which is the fraction of B3+ occupying the tetragonal sites, as such i can vary from 0, which corresponds to normal spinel and 1, which refers to a structure where all the tetragonal sites are occupied by B3+.
TEM-EDX analyzed composition of NiMn z Fe2−z O4 (0.0 ≤ z ≤ 1.0).

Structural analysis of the synthesized nanocrystalline spinels NiMn0.2Fe1.8O4 showing Rietveld refined XRD patterns with experimental data (black line), calculated profiles (red dots), allowed Bragg diffraction positions (vertical bars) and difference curve (blue line).

F. OER kinetics
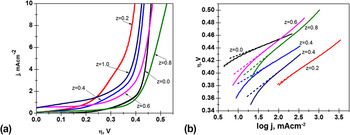
A series of NiMn z Fe2−z O4 (z = 0, 0.20, 0.40, 0.60, 0.80 and 1.0) mixed metal oxide films were tested for OER catalysis by studying the cyclic voltammetry at 20 mV/s scan rate. Two parameters were selected to understand the catalyst performance: (i) overpotential (ƞ) required to reach a current density of 10 mA/cm2; (ii) steady state Tafel slope (mV/decade).
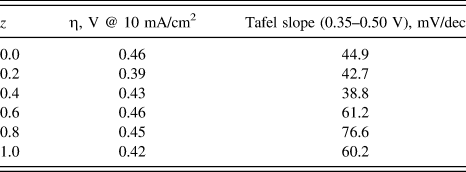
The data in Fig. 9(a) show a decrease in ƞ for OER catalysts with increase in Mn content in the binary metal oxide nickel ferrite. Pure nickel ferrite shows higher overpotential of 0.46 V compared to the ternary metal oxides. Among all the six compositions, z = 0.20 demonstrates the lowest ƞ at 0.39 V. There still remains the challenge of impartially comparing the efficiencies of electrocatalysts, largely due to complications arising from both inadequate standardizations and deviations in average particle size and/or surface areas. It is also notable that the manganese doped ternary metal oxides are more active catalysts than stand-alone NiO x , FeO x , or MnO x catalysts. The NiO x -type catalyst has been previously reported to give 10 mA/cm2 at an overpotential value of ∼0.42 V, Reference Chekin, Tahermansouri and Besharat37,Reference Yeager, Su, Marinković and Teng38 and the reported overpotential value at a current density of 1.0 mA/cm2 for FeO x and MnO x based catalyst are 0.41 and 0.51 V, respectively, Reference Trotochaud, Ranney, Williams and Boettcher39 which are expected to be at a higher overpotential value when adjusted to the benchmarking current density of 10 mA/cm2. Substitution of cations into complex metal oxide crystal lattice has been known to induce oxygen vacancies, and according to Bao et al., Reference Bao, Zhang, Fan, Zhang, Zhou, Yang, Hu, Wang, Pan and Xie40 there is a positive correlation between oxygen vacancy and electrocatalytic activity in OER of nickel-cobalt oxide based catalysts, of which they adduced low H2O adsorption energy at the defect site to this outcome.
(a) Cyclic voltammetry of the conditioned NiMnzFe2-zO4 (0≤z≤1) films collected in 1 M NaOH solution at a scan rate of 20 mV s-1; (b) Steady state Tafel plot for the linear region from 0.35 – 0.50 V.

The linear part of the Tafel plots is shown in Fig. 9(b) obtained for all the six compositions in the overpotential window of ƞ = 0.35–0.50 V. The electrodes with lower z value shows smaller Tafel slopes less than 45 mV/decade compared to the electrodes with higher content of Mn doping indicating an improvement in the electrocatalytic activity of the catalyst. The data presented in Table III show the variation of the overpotential and linear portion of the Tafel slope with composition. The values of the Tafel slope found on the manganese substituted nickel ferrite solid solutions are comparable to those found elsewhere: MnFe2−x Cr x O4 (∼40 mV/decade) Reference Singh, Singh, Nguyen Cong and Chartier41 and NiFe2−x Cr x O4 (∼40 mV/decade). Reference Singh, Singh, Lal, Thomas and Bera42 Strasser and co-workers Reference Strasser, Koh, Anniyev, Greeley, More, Yu, Liu, Kaya, Nordlund, Ogasawara, Toney and Nilsson43 found through experimental and first principle studies that compressive strain in Pt–Cu solid solution have a strong correlation with its electroactivity in oxygen reduction reaction. Also, the improved activity of the alloy may have been due to the favorable adjustment of the electronic properties of the alloy as a direct effect of the combination of the completely filled d orbitals (Ni) with semifilled orbitals (Mn and Fe) according to the Brewer–Engel theory. Reference Jakšić44
Electrode kinetic parameters for the OER of NiMn z Fe2−z O4 (0.0 ≤ z ≤ 1.0) in 1 M NaOH at 298 K.

Besides high catalytic activity, an optimal catalyst material should be stable for their implementation in any operating system. The stability of these catalysts under catalytic conditions was determined using controlled-current electrolysis. The catalyst material was held at a constant current density of 10 mA/cm2 per geometric area for 2 h, while the operating potential was measured as a function of time. Figure S5 from the Supplementary information shows the results of the controlled current electrolysis measurements of these catalysts. Clearly, ƞ (t = 0) and ƞ (t = 2 h) are similar, an indication that the catalyst is stable under the operating conditions for at least a 2 h period.
The concept of plasma oxidation of precursor solution mentioned here offers excellent metastable phase formation possibilities due to its fast reaction kinetics and cooling rates. In general, short reaction times allow for the formation of either transient phases in the case of monometal oxides or solid solutions in the case of mixed metal oxides. Reference Brinley, Babu and Seal45 The process is highly adaptable to any precursor chemical (inorganic, organic, etc.) and any solvent (aqueous, polar, nonpolar, organic, etc.) which can be easily incorporated into the spray feedstock. Precursor solution mixtures can be used to produce multicomponent systems such as bimetallic and ternary oxides and their solid solutions. Since each droplet contains precursor chemicals in the same stoichiometric composition as desired in the produced particle, the synthesized particles will have exceptional compositional uniformity.
IV. CONCLUSIONS
We have successfully demonstrated a synthesis technique based on plasma oxidation of liquid droplets for producing mixed metal oxide solid solutions with controllable composition over entire range. Specific experiments were presented with binary and ternary metal oxides involving nickel, manganese and iron as elements. The selective formation of rocksalt and spinel solid solution is a direct consequence of the precise compositional control shown in this method and will be very useful in tuning catalytic properties in many process applications. As an example, we have demonstrated rapid screening of several mixed metal oxide solid solution systems by testing a series of manganese substituted nickel ferrite materials for their activity with OER reaction in alkaline media. The results showed that the presence of a small amount of manganese (z = 0.20) caused a significant drop in the overpotential with excellent Tafel kinetics.
Supplementary Material
To view supplementary material for this article, please visit http://dx.doi.org/10.1557/jmr.2016.92.
ACKNOWLEDGMENTS
The authors acknowledge primary funding support from NSF Solar Project (DMS 1125909) and access to facilities at the Conn Center for Renewable Energy Research. This material is partially based upon work supported by the National Science Foundation under Cooperative Agreement No. 1355438. The first and third authors thank the University of Louisville for funding through the Ph.D. fellowship award. We thank Dr. S.E. Shirsath for his assistance with Rietveld refinement analysis.