


Introduction
Surge-type glaciers switch between long periods of slow flow and short periods of accelerated flow, 10–1000 times faster. This type of glacier is relatively unusual and constitutes only around 1% of all glaciers on Earth (Reference Jiskoot, Boyle and MurrayJiskoot and others, 1998). However, surge-type glaciers have been intensively studied because different basal processes are thought to govern the two distinct modes of flow between which these glaciers are able to switch. Such switching is not limited to surge-type glaciers: ice streams, which regulate the volume of the major ice sheets, can also switch their flow mode (Reference ClarkeClarke, 1987), and thus surge-type glaciers may provide a useful analogue for ice-stream behaviour.
Surge-type glaciers are not uniformly distributed within the Earth’s glaciated regions, being completely absent from some regions but clustered in other regions. There are striking differences in surge behaviour between cluster regions; in Svalbard, for instance, glaciers have both a long quiescent and a long active phase compared to other clusters (Reference Dowdeswell, Hamilton and HagenDowdeswell and others, 1991). Central East Greenland is a cluster region in which 26 glaciers exhibit morphological evidence of surging (Reference WeidickWeidick, 1988). In this cluster, observations are sparse and exist for only four active-phase glaciers (Reference RutishauserRutishauser, 1971; Reference Colvill and MillerColvill, 1984; Reference WeidickWeidick, 1988). These observations suggest a surge duration of 5–10 years and a quiescent-phase duration of 70–150 years. In this paper we use intensity tracking, interferometry and visual interpretation of satellite synthetic aperture radar (SAR) imagery to document the distribution and temporal evolution of ice dynamics of Sortebræ, central East Greenland, during its 1990s surge.
Location And Characteristics Of Sortebræ
Sortebræ (68°45’ N, 27°05’ W) is a 65 km long tidewater-terminating glacier in central East Greenland (Fig. 1). The glacier is fed from a number of tributaries and by ice flowing from an ice cap on the Geikie Plateau. A major tributary, Sortebræ West, joins Sortebræ close to the ice terminus. Sortebræ West has an independent flow regime and is probably a continuously fast-flowing glacier, with ice velocities of 1.0–2.7md–1 measured in both the 1930s and 1990s (Reference Jiskoot, Pedersen and MurrayJiskoot and others, in press). Sortebræ surged around 1950 and again between 1992 and 1995, giving a quiescent phase of 39–49 years. Based on interpretation of aerial photographs, Reference Jiskoot, Pedersen and MurrayJiskoot and others (in press) estimate the quiescent-phase velocity at the junction between Sortebræ and Lower Loop Basin to be 0.5 ±0.1 md–1 over the period 1933–43 and 0.02 ±0.007 md–1 during 1981–87. During the 1990s surge, Sortebræ advanced 5 km in <1year, and ice-flow rates increased dramatically. Large turbid lakes appeared in the shear margins, suggesting very high basal water pressures, in excess of flotation pressures, and an inefficient water- evacuation system. Iceberg calving increased greatly at the terminus, with ~12 km3 of ice being calved, and an area of approximately 335 km2 of the glacier surface became intensely crevassed (Reference Jiskoot, Pedersen and MurrayJiskoot and others, in press).
Location of Sortebræ, based on 1:100 000 topographic maps compiled by the Geological Survey of Denmark and Greenland from 1981 aerial photography and ground-control points supplied by the Danish National Survey and Cadastre. All names other than Sortebræ are unofficial (Reference Jiskoot, Pedersen and MurrayJiskoot and others, in press). The location of the profiles used in Figure 5 is shown. Contour interval is 100 m.
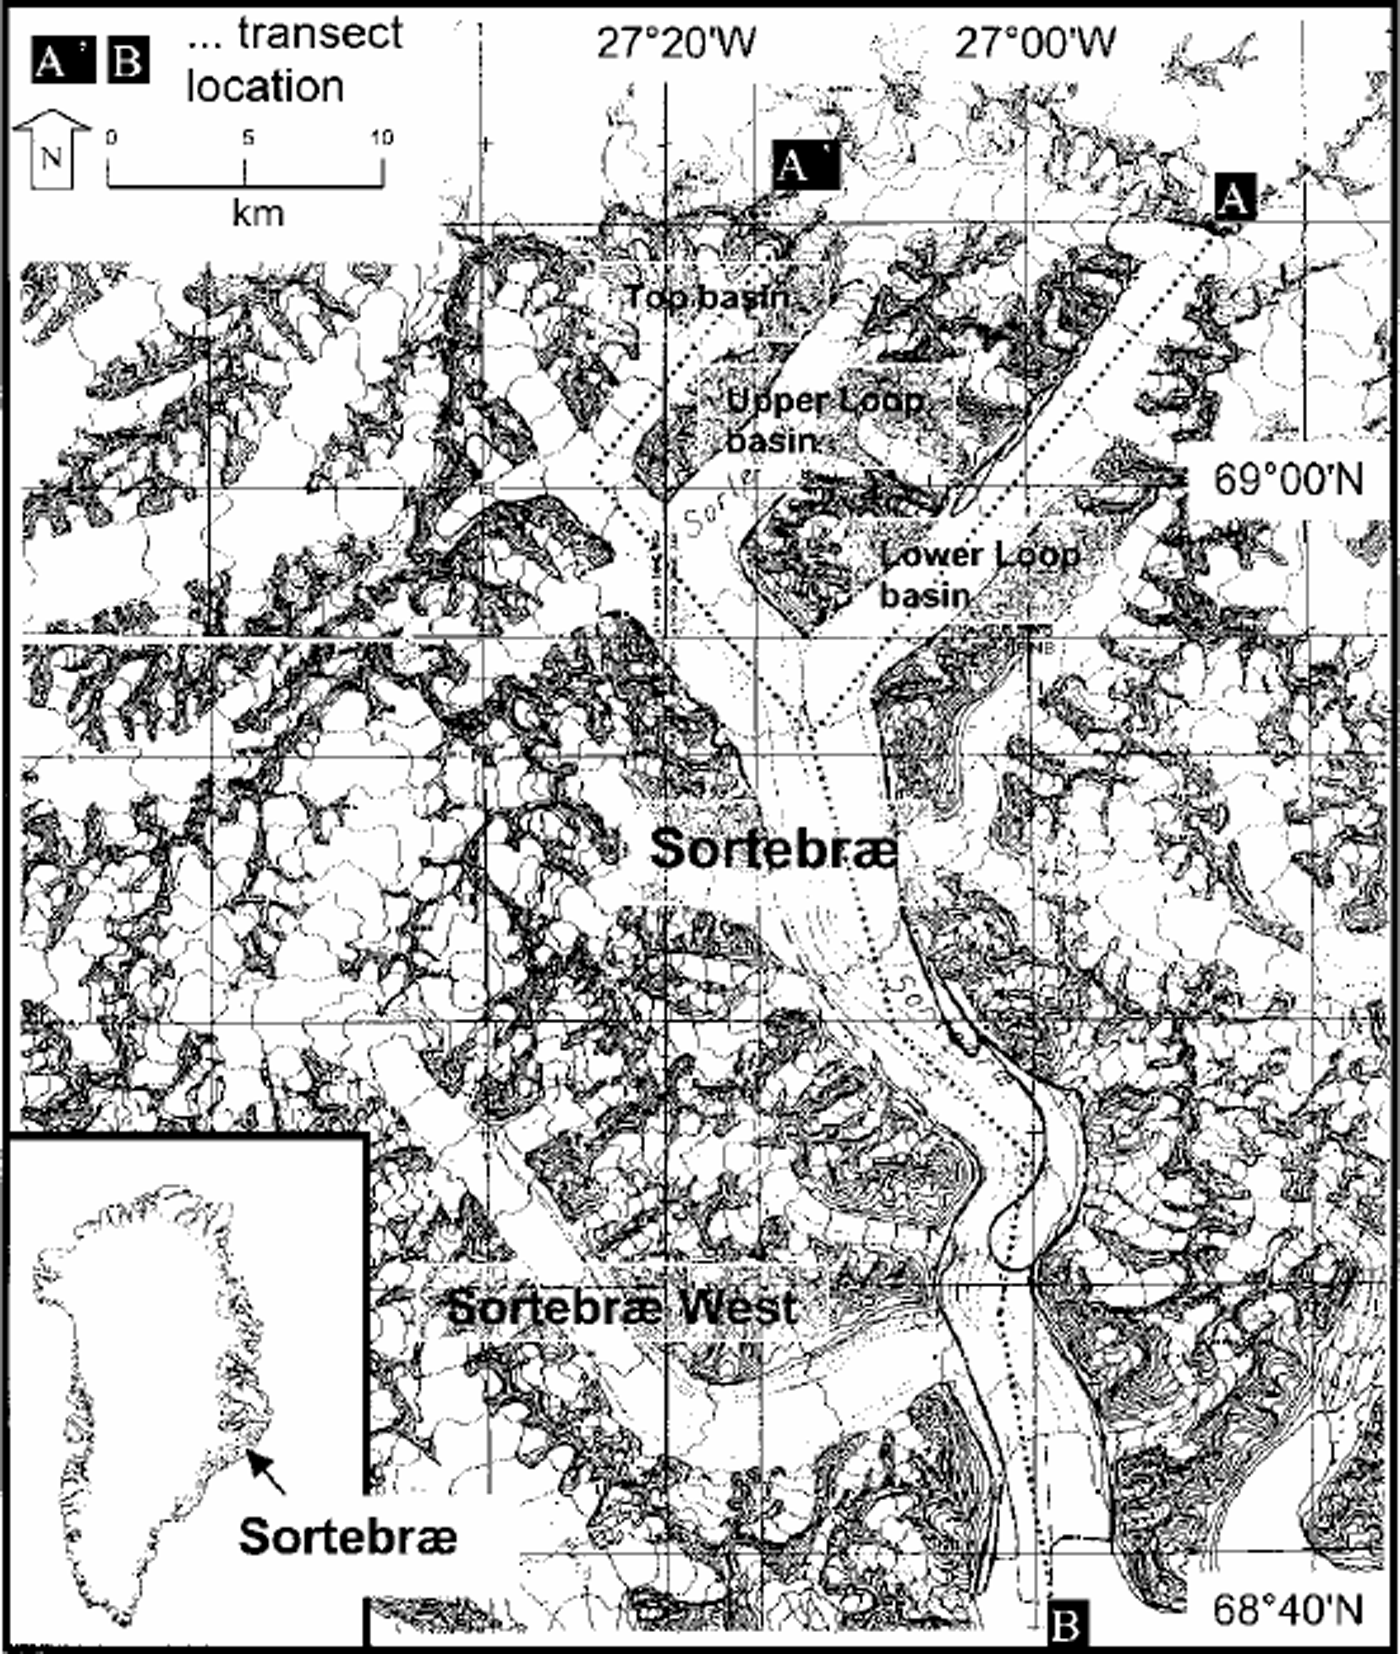
Sortebræ overlies Tertiary basalts that are colomnary jointed and have a friable and porous vesicular zone (Reference Pedersen, Watt, Watt and LarsenPedersen and others, 1997). These rocks are readily eroded and the glacier surface is heavily mantled by moraine debris. During the 1990s surge, copious amounts of sediment appeared in marginal shear zones and turbid lakes. Furthermore, Sortebræ terminates in a fjord, which suggests the presence of marine clays underlying its lower reaches. Thus it is probable that the glacier overlies a soft sedimentary bed. The thermal regime of the glacier is unknown; the closest glaciers with known thermal regime are in the Stauninger Alps and are polythermal (Reference KirchnerKirchner, 1963; Reference Davis, Halliday and MillerDavis and others, 1973).
Topographic changes during Sortebræ’s 1990s surge have been measured using multi-model photogrammetry (Reference Jiskoot, Pedersen and MurrayJiskoot and others, in press). Ice thinning in the reservoir zone varied spatially between 11 and 219 m, and the thickening of the receiving zone varied between 24 and 74 m.
Methods
European Remote-sensing Satellite (ERS) SAR data covering Sortebræ suitable for interferometry and intensity tracking are only available after 21 April 1995 during the ERS-1/-2 tandem phase, since neither of the 3 day repeat phases of ERS-1 imaged this area. For this reason, annual non-paired SAR images were chosen at dates in late summer over the period 1992–97 to allow visual tracking of major features. Images for interferometry and intensity tracking were chosen from the tandem archive in conjunction with meteorological data from Danish Meteorological Institute stations at Aputiteeq and Scoresby Sund to ensure that only data with minimal loss of coherence due to melt, precipitation or drifting snow were chosen. Suitable image pairs were obtained from dates in May 1995, September 1995 andJanuary 1996.
Interferograms were derived in the normal way (e.g. Reference Goldstein, Engelhardt, Kamb and FrolichGoldstein and others, 1993) and the flat-Earth phase trend was removed using a combination of orbital information and Fourier-transform analysis of fringes. For the purposes of this paper neither differential processing nor unwrapping was performed, and the interferograms displayed contain both topographic and displacement information. Before display, interferograms were geocorrected to the ellipsoid but not for topography.
The extreme velocities during many surges mean that SAR interferometry is unsuitable for mapping ice dynamics. For example, Reference Fatland and LingleFatland and Lingle (1998) used interferometry to study the effects of Bering Glacier, Alaska, U.S.A., on the Bagley icefield that feeds it, but ice velocities were so high on the glacier itself that coherence was lost. Similarly, studies on Storstrømmen, North Greenland, used interferometry only in the quiescent phase of its surge (Reference Mohr, Reeh and MadsenMohr and others, 1998). However, tracking nearly identical intensity features at the scale of groups of pixels between two SAR images allows assessment of surface displacements where relatively large displacements have occurred (Reference Rott, Stuefer, Siegel, Skvarca and EckstallerRott and others, 1998; Reference Michel and RignotMichel and Rignot, 1999; Reference WernerWerner and others, 2001). This method thus provides the possibility for mapping rapid ice displacement during the active phase of surging.
Automatic cross-correlation of image patches of detected real-valued SAR intensity images was performed in slant-range and azimuth directions (Reference WernerWerner and others, 2001). Image patches were 64664 single look complex (SLC) pixels, i.e. around 500 m in the slant-range direction and 250 m in the azimuth direction, which limits the resolution of the technique. It should be noted that because of the differing pixel size the technique is less sensitive in the slant-range than in the azimuth direction. The confidence level of each offset was estimated to remove unreliable data. The detected pixel shifts were corrected for orbit offsets to derive an absolute, unambiguous motion of the glacier. Offsets were corrected to horizontal for the look-angle of the satellite, and images were geocoded to the ellipsoid before display. Assuming range- and azimuth-offset estimation errors of 0.05 pixel (Reference WernerWerner and others, 2001), the displacement estimation errors for ERS SAR offset-tracking are ~0.4m in slant-range (or ~1.0m in ground-range) and ~0.2m in azimuth directions. The accuracy depends on the direction of motion, but generally the technique is only suitable for measuring fast displacements of >1m between image acquisitions.
Results
Interpretation of SAR images
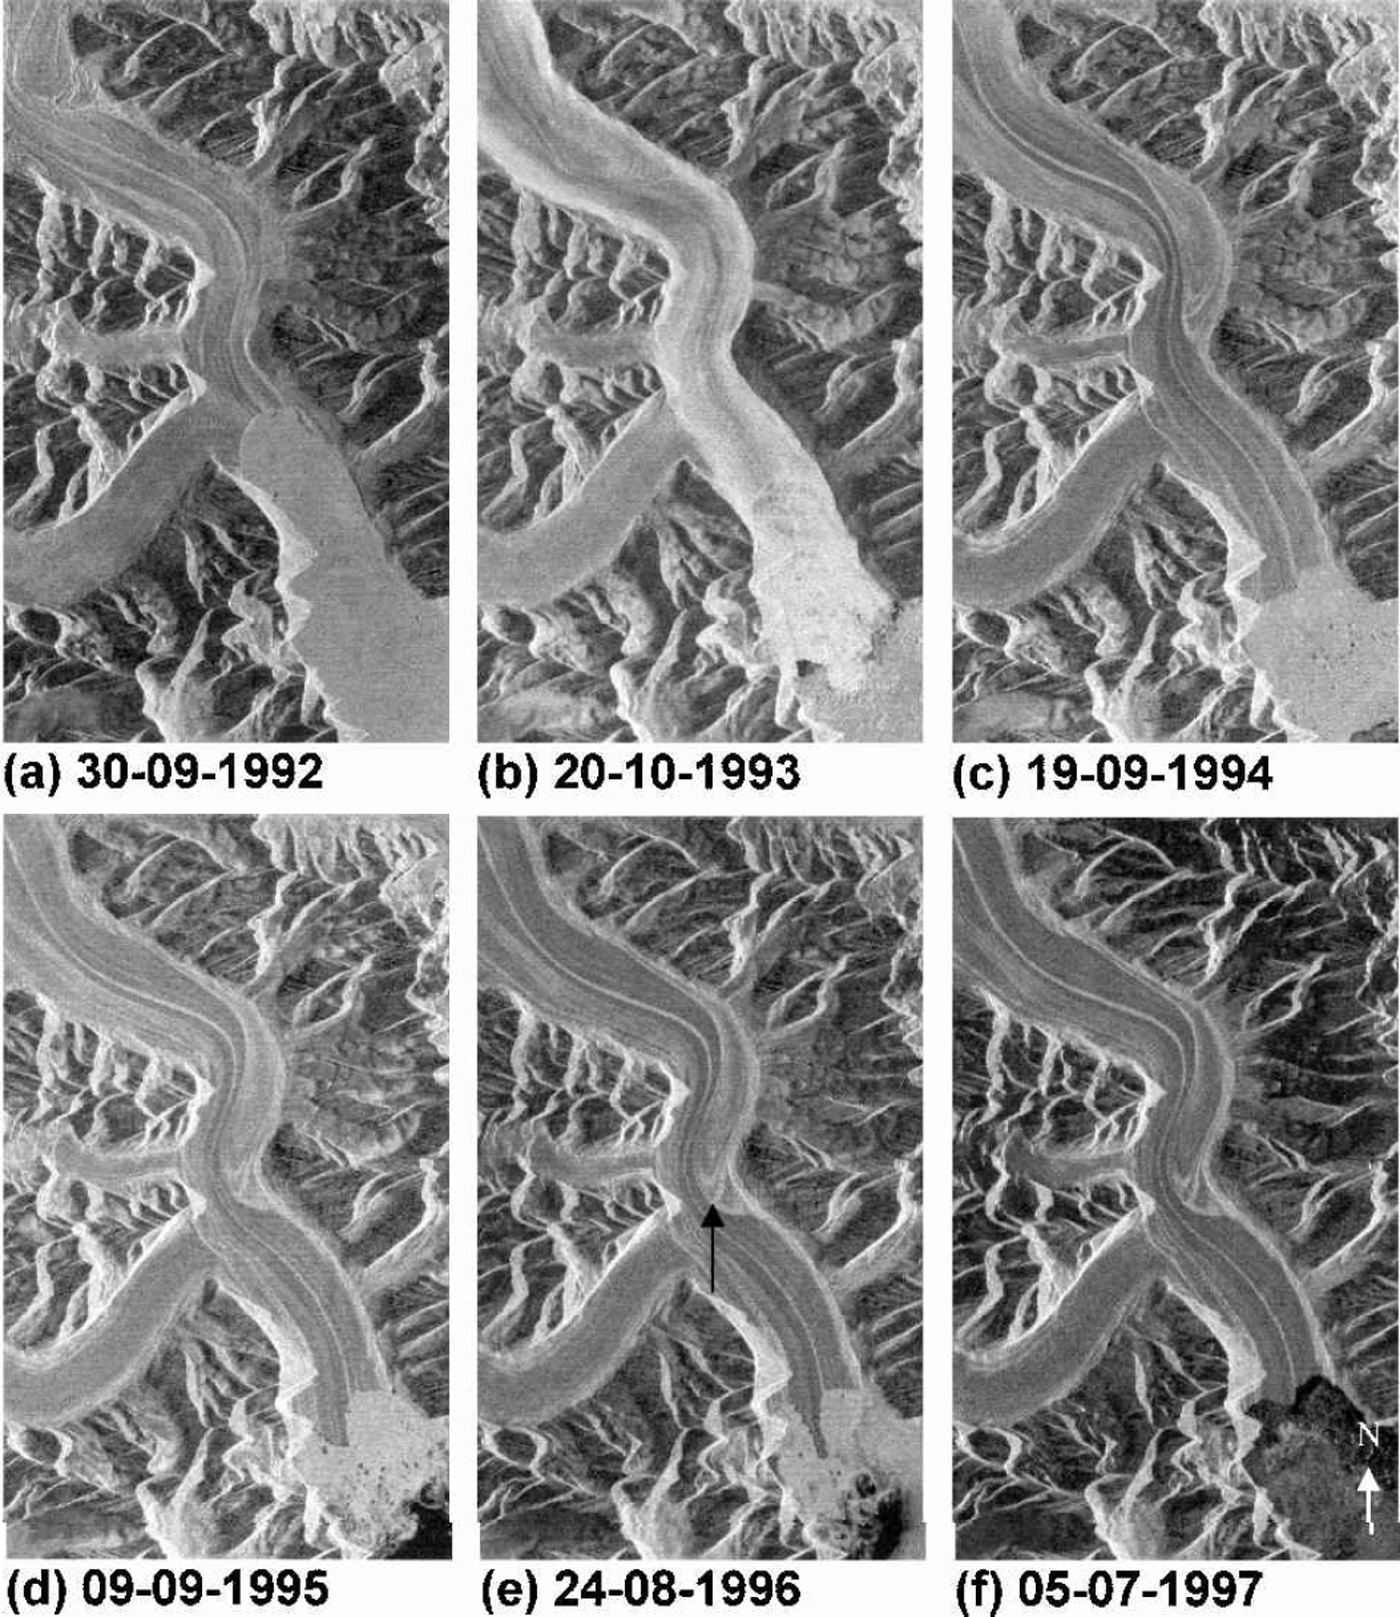
Figure 2 shows the lower 25 km of Sortebræ taken from annual SAR images which allow tracking of major moraine features and measurement of the frontal advance and retreat (Table 1). The images were chosen from the archive to represent as closely as possible the same seasonal conditions in each year, and were calibrated to be directly inter-comparable in brightness. Any residual overall brightness differences will result from differing local conditions between the acquisitions chosen (e.g. changes in snow water content or surface roughness). These images show that Sortebræ’s surge started after 30 September 1992 and before 20 October 1993. In 1992, Sortebræ West dominated the calving front, and the surface of Sortebræ was pitted and depleted, with many moraines standing proud of the ice surface (Fig. 2a). There was no evidence of a surge front, but by October 1993 (Fig. 2b) the entire lower 53 km of glacier surface was very bright in contrast to neighbouring glaciers, making moraines and other features indistinct, probably due to the formation of many crevasses that produced strong radar backscatter. The glacier terminus was not easily distinguishable due to extensive calf and brash ice in the fjord. The surging trunk of Sortebræ appeared to shear off Sortebræ West and most small tributaries, but the Lower Loop, Upper Loop and Top basins (Fig. 1) were all affected by the surge. Between 1992 and 1993, the centre of the glacier terminus advanced about 3.5 kmat a rate of at least 9.1 md–1, and displacement of the moraine loop suggests ice-displacement rates of at least 15.3md–1 during the same period. Both frontal advance and ice-displacement rates could be much higher if in fact the surge started closer to the 1993 rather than the 1992 image. (A SAR image from 10 July 1993 obtained after this paper was written shows only minor displacement of the moraine loop and terminus between September 1992 andJuly 1993 and thus suggests that the surge started shortly before July 1993.)
Sequence of SAR images of the marginal region of the glacier at approximately 1year intervals through the surge cycle. Note the increase in the surface brightness of the glacier during 1993, presumably caused by intense crevassing. The marginal advance and retreat, and the displacement of the moraine loop (from the top to the centre of these images) can also be seen. Images are 18 km×30 km. Look direction is from the right (east-southeast).
Ice displacements during the surge based on displacement of a prominent moraine loop and the midpoint of the glacier margin (Fig. 2)
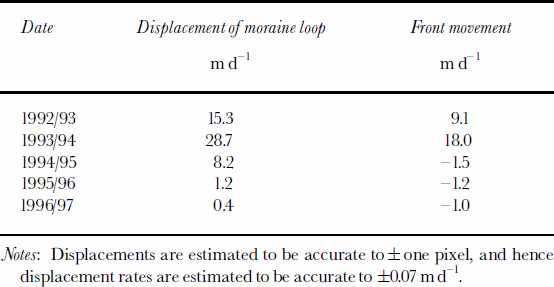
Maximum annual frontal advance occurred between 1993 and 1994, when the terminus advanced ~6.0 km at a rate of ~18md–1 (Table 1). Over this period the moraine loop in the centre of the image was displaced at rates of ~29md–1. After this time the glacier started to retreat slowly as ice velocities fell, presumably becoming too low to replenish the ice being lost to calving. The total advance of the glacier front was 7–10 km over 2–3 years, after which the glacier front retreated irregularly (Fig. 2c–f). From these images it appears that the surge terminated before 9 September 1995.
Moraine displacements and surface expression near the confluence of the Lower Loop basin suggest that the surge started in this tributary and propagated both up- and down-glacier in the main trunk. This observation is in accordance with a preliminary study of crevasse patterns on the glacier and the pattern of glacier thinning and thickening, which both suggest an initiation about halfway up the Lower Loop basin (Reference Jiskoot, Pedersen and MurrayJiskoot and others, in press).
Interferometry
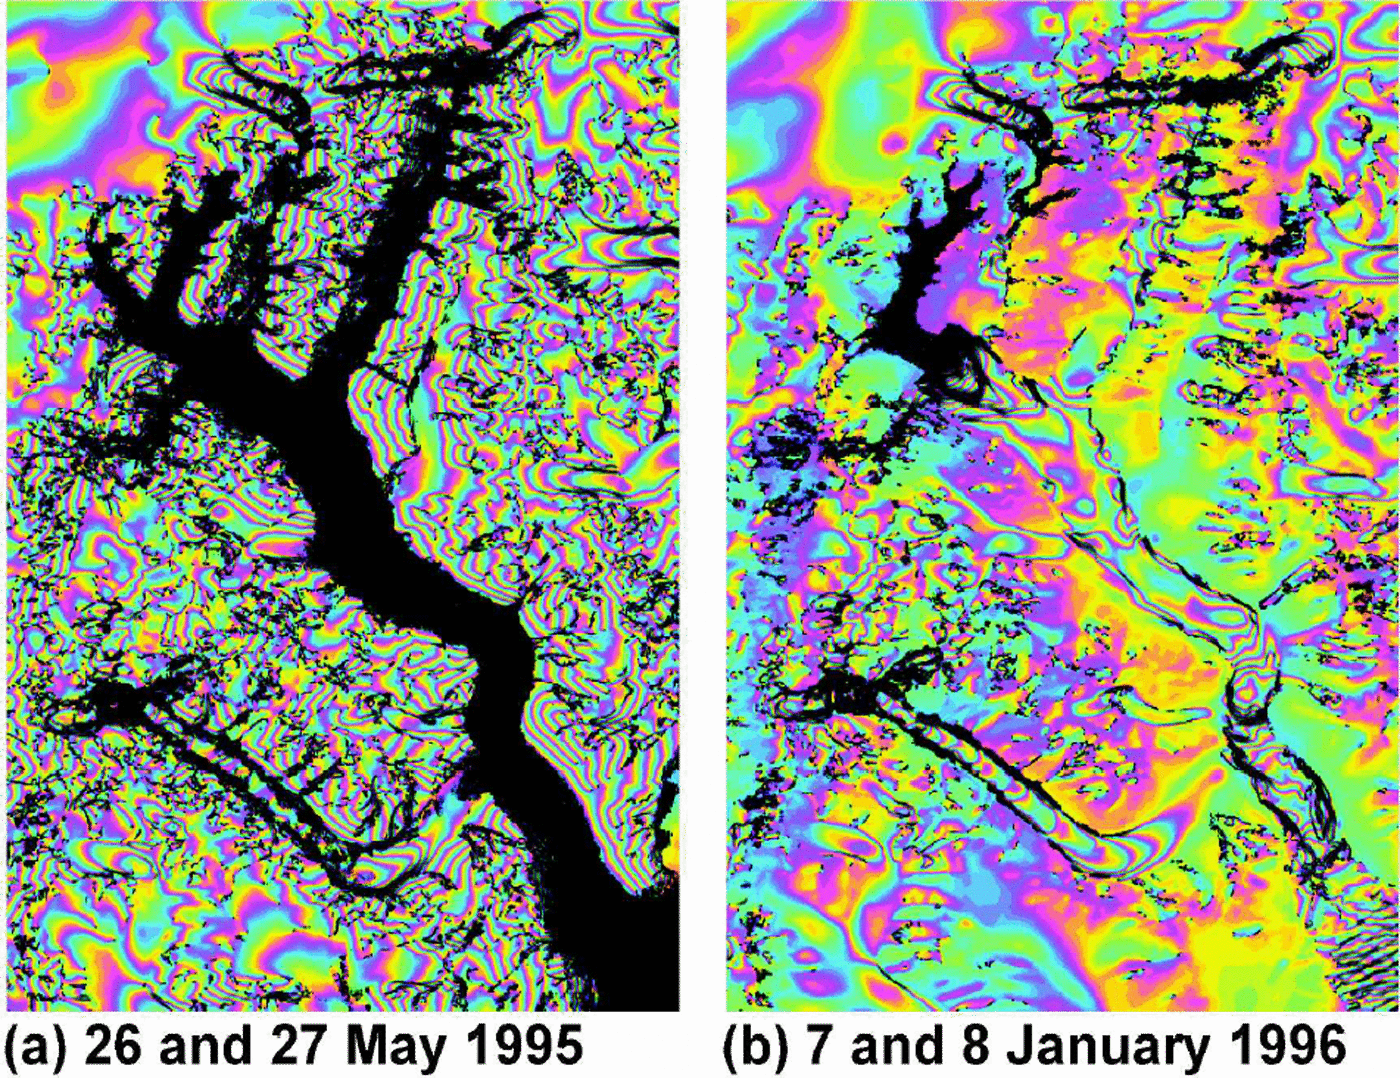
An interferogram formed from images from 26 and 27 May 1995 showed no coherence over Sortebræ, despite good coherence on neighbouring glaciers including most of Sortebræ West (Fig. 3a). This result implies decorrelation over Sortebræ due to rapid flow. However, the September 1995 interferogram showed some coherence over part of Sortebræ, and by January 1996 (Fig. 3b) most of Sortebræ was coherent, suggesting that the ice-flow rate had fallen dramatically and that the surge had terminated. Ice in the Top basin remained fast-flowing through September 1995 and January 1996, and the margin of fast-moving ice migrated slowly up-glacier.
Flattened interferograms of Sortebræ for (a) May 1995 and (b) January 1996. The images show both topography and displacement effects on the phase and are combined with the backscatter intensity and the coherence. The entire main trunk is incoherent in (a) due to very high ice-displacement rates, whereas most of the main trunk is coherent in (b). Image is 40 km× 60 km. Perpendicular component of the baseline for (a) is –47m and for (b) is –11m. Look direction is from the right (east-southeast).
Intensity tracking
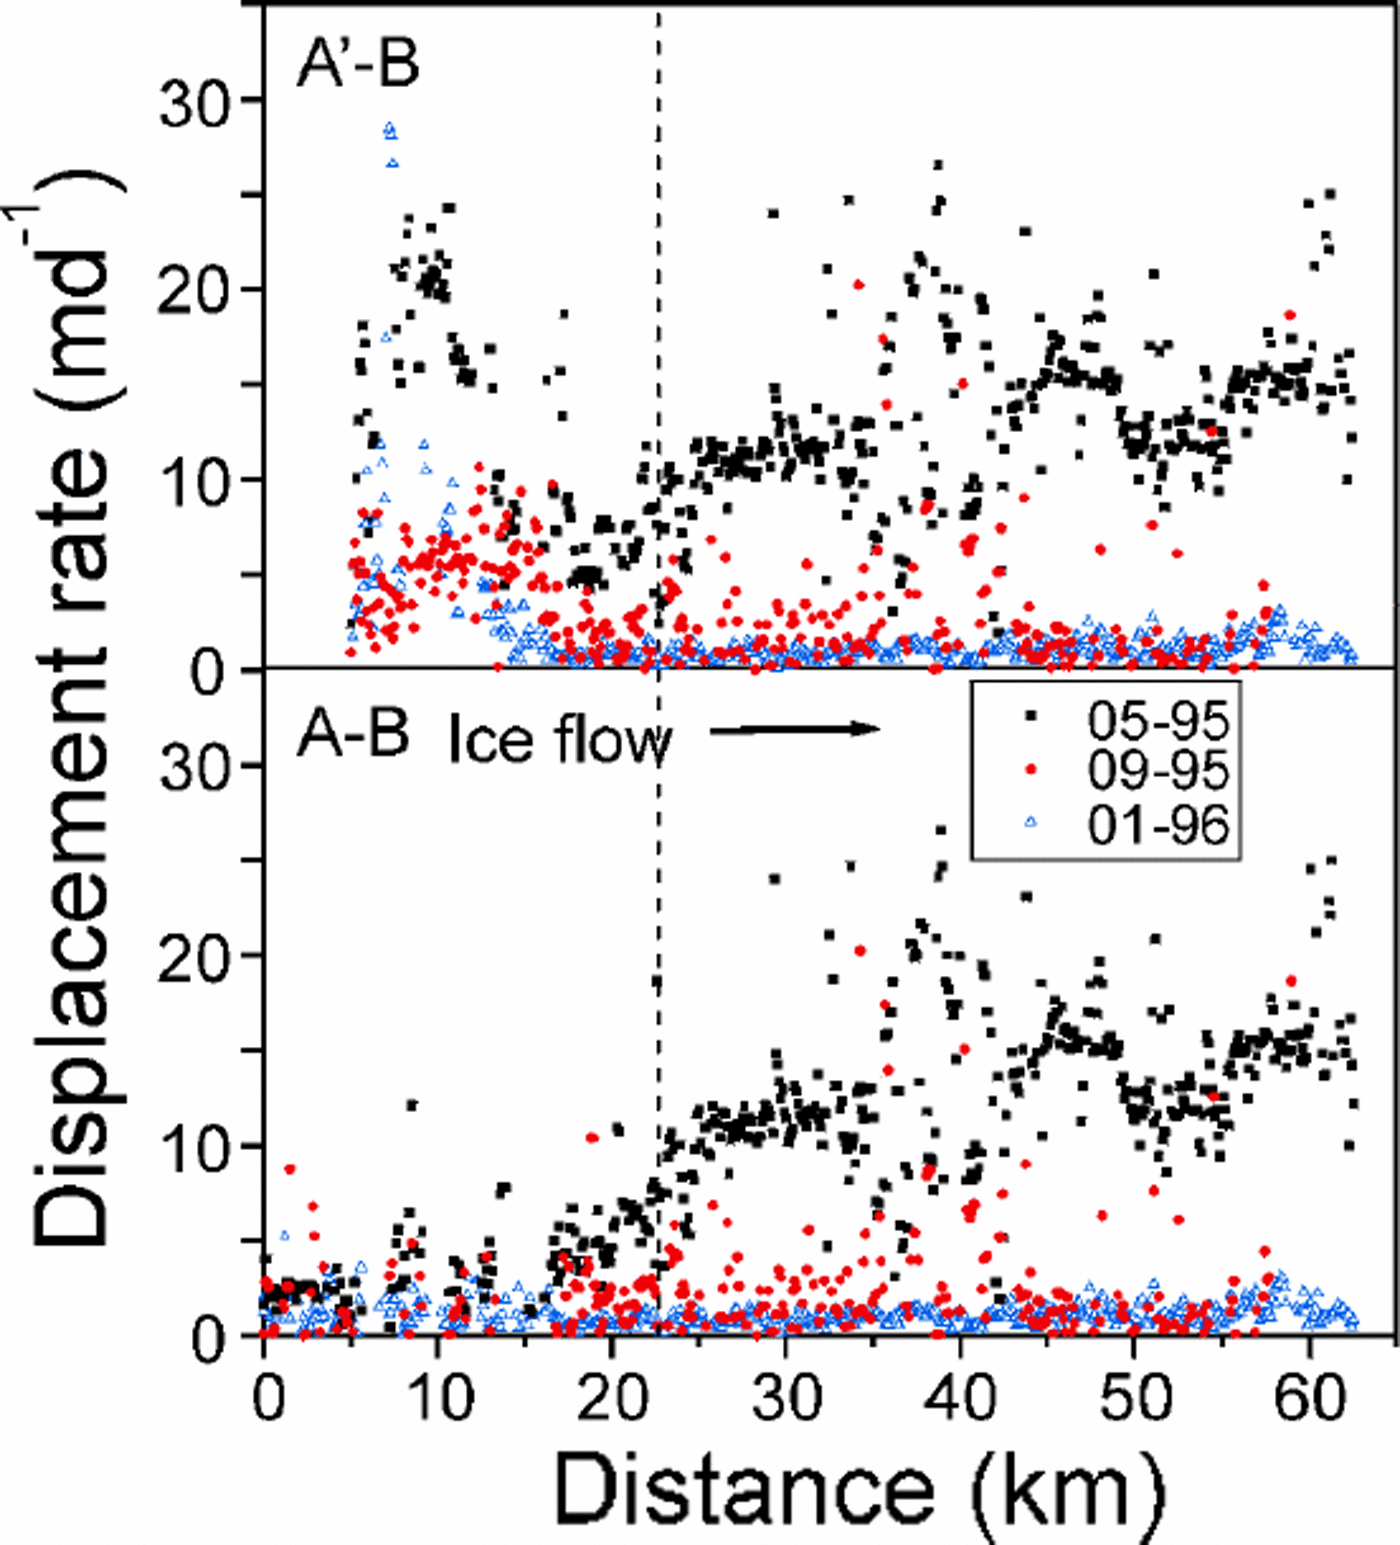
Intensity tracking successfully allowed determination of ice velocity over most of the glacier (Fig. 4). Profiles along flow-lines are displayed in Figure 5. Tracking shows clearly the dramatic drop in velocity between May and September 1995 over most of the glacier. In May, the velocity in the main trunk was ~13 md–1 and generally increased down-glacier showing overall extensional flow. There were large-scale variations in velocity related to the glacier’s flow around bends (Fig. 1). In May 1995, the velocity was lowest in the Lower Loop basin (Fig. 5), which is the site inferred to be the surge nucleus region (Reference Jiskoot, Pedersen and MurrayJiskoot and others, in press). By September, the velocity in the main trunk had dropped to 1–3md–1 and in January 1996 it was ~1md–1. In the Top basin, intensity tracking showed velocities of 15–25md–1 during May 1995 (Fig. 5), and by September 1995 the velocity in this region had dropped to ~5md–1. In January 1996, the velocity appears to have increased again in some parts of the Top basin, although typical velocities were still ~5md–1. Maximum velocities in January 1996 in the Top basin were 25–30md–1, and the region of fastest flow in this region had moved up-glacier compared to the full surge conditions of May 1995.
Horizontal displacement from intensity tracking. Green: >20md–1; blue: 15–20md–1; red 10–15 md–1; yellow: 5–10md–1; backscattering intensity image <5md–1; black: no data. (a) May 1995; (b) September 1995; (c) January 1996. Image is 40 km× 60 km.

Horizontal displacement from intensity tracking from images 26 and 27 May 1995, 8 and 9 September 1995, and 7 and 8 January 1996. Accuracy of intensity tracking is ± 1.2 m d–Location of profiles is shown in Figure 1; profiles are identical after 23 km (to the right of dashed line). Measured small-scale velocity variability appears to be at or greater than the expected error in the tracking technique, possibly because of true small-scale changes in surface flow, for example related to crevassing.
Discussion
Based on the interpretation of SAR images (Fig. 2) and interferograms (Fig. 3), Sortebræ’s surge initiated after September 1992 and before October 1993, and ended after May and before September 1995.The surge was therefore 19–35 months in duration. The glacier front began advancing very soon after the surge initiated (Table 1), and the whole glacier was rapidly activated. Based on the evidence presented in this paper we cannot determine the season of surge initiation, which is unfortunate, given the prediction that the closure of the conduit system required for the production of linked cavities will occur in winter (Reference RaymondRaymond, 1987). Surge termination occurred during summer. There is no visual evidence of a surge front on any of the images (Fig.2), so if a surge front propagated down-glacier it did so within at most the first 13 months of the surge.
Observations of glacier surging reveal two distinct classes of glacier surges. The first class is typified by the well-documented Variegated Glacier, Alaska (e.g. Reference KambKamb and others, 1985; Reference KambKamb, 1987). This surge was characterized by rapid onset and cessation of fast flow and very high ice-flow velocities and has been explained as resulting from a hydrological instability (Reference KambKamb, 1987). During quiescence, the glacier basal water system is thought to be channelized, allowing efficient and rapid water evacuation. During the surge phase, the water becomes throttled in linked cavities, which allow storage of a large volume of water at high water pressures, thus facilitating fast flow. This is essentially a hard-bed surge mechanism, although Reference Jiskoot, Pedersen and MurrayKamb (1987) states that the linked-cavity model is applicable in a general way to surging when soft bed deformation contributes to the high speeds of ice motion, and observations at Skeiðarárjökull, Iceland, support this (Bjørnsson, 1998). The second class is typified by Svalbard glaciers (e.g. Reference Dowdeswell, Hamilton and HagenDowdeswell and others, 1991). In Svalbard, surges are of longer duration (>5 years), and are typified by low ice velocities, low basal shear stresses and slow and indistinct initiations (personal communication from A.-M. Nuttall, 1999) and terminations (Reference Murray, Dowdeswell, Drewry and FrearsonMurray and others, 1998). These surges have been shown to be related to soft beds and polythermal regimes (Reference Jiskoot, Murray and BoyleJiskoot and others, 2000; Reference MurrayMurray and others, 2000). Reports of surges in East Greenland would suggest that glaciers in this cluster resemble Svalbard rather than Alaskan glaciers (e.g. Reference WeidickWeidick, 1988).
At Sortebræ the rapid surge initiation and termination (Fig. 6) is in contrast to observations in the Svalbard archipelago (e.g. Reference Dowdeswell, Hamilton and HagenDowdeswell and others, 1991; Reference Murray, Dowdeswell, Drewry and FrearsonMurray and others, 1998) but is similar to glaciers in Alaska and other regions (Reference KambKamb and others, 1985; Reference HarrisonHarrison and others, 1994). Ice velocities at Sortebræ are much higher than those reported in Svalbard, which are typically 6md–1 or less (e.g. Reference Rolstad, Amlien, Hagen and LundénRolstad and others, 1997; Reference Dowdeswell, Unwin, Nuttall and WinghamDowdeswell and others, 1998; Reference Murray, Dowdeswell, Drewry and FrearsonMurray and others, 1998). However, velocities at Sortebræ are somewhat lower than those of Alaskan glaciers (Harrison, 1964; Reference KambKamb and others, 1985; Reference Echelmeyer, Butterfield and CuillardEchelmeyer and others, 1987; Reference Harrison, Echelmeyer, Chacho, Raymond and BenedictHarrison and others, 1994) or Medvezhy glacier in the Pamirs (Reference Dolgoushin and OsipovaDolgoushin and Osipova, 1975), where maximum surge velocities are 50–100md–1 or more. Despite the apparently intermediate velocities we have measured, the combination of field observations of very high basal water pressures, which trapped sufficient volume of water to fill marginal lakes with turbid water, and the rapid onset and termination, imply surge propagation by a mechanism similar to that of Variegated Glacier, i.e. a hydrological switching mechanism. However, it is highly likely that Sortebræ overlies a soft and potentially deformable bed, which may prove to be a cause of the intermediate surge velocities.
Ice displacement at Sortebræ from a combination of visual tracking of moraine features (bars) and intensity tracking (points) at location of moraine loop (Fig. 1). Visual tracking provides annual averages, whereas intensity tracking provides instantaneous point values. The rapid surge termination can clearly be seen.

Surge termination occurred rapidly over most of the glacier (Fig. 3, 4 and 6), but the Top basin of Sortebræ remained fast-flowing at velocities of 5–25md–1 or more (Fig. 4 and 5), and the boundary of this fast flow propagated slowly up-glacier. Flow in this region is inevitably strongly compressive in the region of decreasing velocity (Fig. 5). Water must be trapped beneath this region of the glacier and prevented from escaping. The stability of linked cavities is promoted by low slope, high basal shear stress (i.e. thick ice) and high sliding velocity (Reference KambKamb, 1987). Since this region of the glacier had little obvious surface expression either before or after the surge, it is unlikely that ice surface slope played a major role in maintaining a stable high-water-pressure system. Basal topography, i.e. the presence of an overdeepening, increasing ice depth and hence basal shear stress, may have played an important role in retaining water in this region of the glacier.
Summary And Conclusions
Sortebræ has a surge phase of 19–35months and a quiescent phase of 39–49years. Ice flow during the surge increased by up to 60–1500 times over quiescent-phase velocities and was sustained at rates of up to 30md–1 over a year.
Glacier surge initiation was rapid, and after a period of at most 13 months the lower 53 km of the glacier was affected, showing widespread crevassing and greatly increased calving.
Intensity tracking successfully allowed velocity determination over most of the glacier. This tracking showed that surge termination was rapid, with velocities dropping over most of the glacier from approximately 10–20md–1 to approximately 1–2md–1 over 3 months.
The season of surge initiation is unknown, but surge termination occurred during summer 1995.
Ice velocities in the Top basin remained high (5–30md–1) well after the surge terminated in the remainder of the glacier.
Surge glacier dynamics at Sortebræ appear similar to those at Variegated Glacier, Alaska. At Sortebræ, the basal water system appears to have been characterized by very high water pressures and storage of large volumes of water during the surge. Surge propagation is thought to result from a hydrological instability. However, it is highly likely that Sortebræ overlies a soft and deformable substrate.
Acknowledgements
This study was funded through grants from the Royal Society and the U.K. Natural Environment Research Council (NERC). T.S. and H.J. are supported by the NERC grant GST/02/2192, and H.P. is funded through NERC Ph.D. Studentship GT4/99/120.



