
I. INTRODUCTION
Since the pioneering work of Wöhler Reference Wöhler1 in the 19th century, the fatigue behavior of metallic materials has been studied extensively. However, many details of the basic fatigue mechanisms leading to failure of the material under cyclic loading have remained unclear. Ewing and Humphrey were the first to describe the occurrence of slip bands on the surface of fatigued steel specimens, which gradually developed into cracks. Reference Ewing and Humphrey2 In 1953, Forsyth introduced for the first time the term “extrusion” describing the observed exudations of a fatigued aluminum 4% copper alloy at the surface along slip bands. In the same paper, these extrusions were also denoted as “crystal debris at the surface”. Reference Forsyth3 Manson Reference Manson4 and Coffin Reference Coffin5 showed independently in the same year that the microplastic part of the cyclic deformation plays a dominant role in the onset of fatigue damage. In subsequent years, many pioneering studies were performed to shed some light into the fatigue phenomenon. For example, Thompson et al. Reference Thompson, Wadsworthand and Louat6 stated in 1956: “Firstly, we must ask by what process an alternating stress can give rise to a singularity in the medium which can be called a crack; secondly, we must investigate the laws governing the growth of such a crack.” It became more and more clear that fatigue is a multistage process spanning from transient and microplastic deformation processes that lead to strain localization, to crack initiation, and finally to fatigue failure. Mughrabi Reference Mughrabi7 summarized these multiple stages of the fatigue process schematically and distinguished between basic dislocations and fatigue failure mechanisms. In the latter case, much work has been published on fatigue crack growth as, for example, in the pioneering work of Paris and Erdogan Reference Paris and Erdogan8 and in many other studies in the field, see Refs. Reference Erdogan and Sih9–Reference Pippan, Zelger, Gach, Bichler and Weinhandl13. The basic dislocation mechanisms which become dominant during cyclic loading have also been well investigated in detail and understood especially in the case of monocrystalline face-centered cubic (fcc) materials, see Refs. Reference Lukáš, Klesnil and Krejčí14–Reference Essmann, Gösele and Mughrabi17 but also in the case of polycrystalline specimens, see Refs. Reference Feltner and Laird18–Reference Wang, Mughrabi, McGovern and Rapp20. In view of the fact that the localization of plastic deformation in so-called persistent slip bands (PSBs) that form during cycling loading are dominant in the high cycle fatigue- and low cycle fatigue-regimes for many materials and testing conditions Reference Lukáš and Klesnil15,Reference Lukas and Kunz21 these PSBs have also been investigated intensively and their main features have been summarized in the past. Reference Mughrabi, Ackermann, Herz and Fong22–Reference Laird, Charsely and Mughrabi25
In brief, PSBs in which the plastic straining which localizes subsequently forms early in the fatigue life. PSBs exhibit a ladder-like structure of walls of dislocation dipoles and multipoles of low energy. The surrounding matrix shows a less regular structure of dislocation veins which is much less strained.
The pioneering work by Essmann, Goesele, and Mughrabi, Reference Essmann, Gösele and Mughrabi17 well known as the EGM-model, was the first that provided semi-quantitative predictions on the development of extrusions, on the temperature dependence of extrusion growth, and on the differences between mono- and polycrystalline materials, see also. Reference Mughrabi, Bayerlein, Wang, Brandon, Chaim and Rosen27 According to the EGM-model, extrusions form at the surface at emerging PSBs during the quasi-steady-state cyclic deformation in the approach to cyclic saturation, characterized by the dynamic production and annihilation of dislocations and point defects. It is concluded in Ref. Reference Essmann, Gösele and Mughrabi17 that “the randomness of the glide processes leads to a statistical roughening of the surface at sites of emerging PSBs” and that “the annihilation of narrow edge dislocation dipoles in the walls of the PSBs is associated with the formation of point defects about whose nature little is known”. Thus, roughly speaking, extrusions emerging at the surface are the consequence of a combined process of an increase of the vacancy concentration, related to a volume increase in the PSB and the glide of so-called PSB-matrix interface dislocations to the surface driven by the applied stress. Accordingly, the additional volume of the extrusion that has formed on the surface exactly equals the additional volume due to the increase of the vacancy concentration in the PSB. In cyclic saturation, the density of edge dislocations in the dipolar walls of the ladder structure and the corresponding volume fraction saturate, and thus the vacancy concentration also saturates, which results in a stop of the extrusion growth. However, this statement holds only if the testing temperature is low and vacancy diffusion into the matrix is negligible, Reference Mughrabi7,Reference Basinski and Basinski24–Reference Mughrabi28 i.e., for copper up to ≈250 K. At higher temperatures, the diffusive flux of vacancies into the matrix will become more prominent and consequently new interface dislocations have to be produced leading to a further increase of the extrusion height due to the process as described above, see Refs. Reference Mughrabi, Bayerlein, Wang, Brandon, Chaim and Rosen27, Reference Mughrabi29, and Reference Man, Petrenec, Obrtlík and Polak30. Hence, one has to distinguish between static extrusions at rather low temperatures, which saturate in height and continuously growing extrusions which only appear at elevated temperatures and which do not show a saturation in height. Some authors have referred to the surface topography, viz. surface profiles with sharp reliefs and with local depressions that develop at the extruded PSB regions, as discussed here, as persistent slip markings (PSMs), see, for example. Reference Man, Petrenec, Obrtlík and Polak30
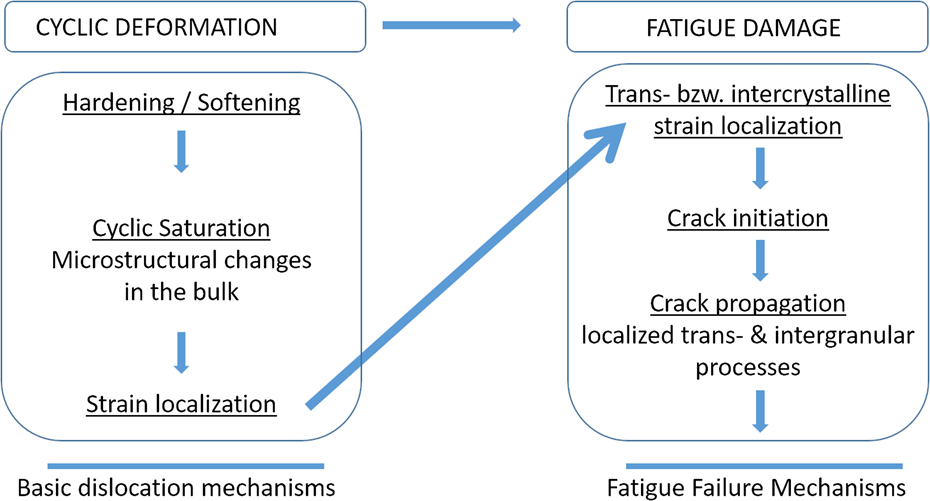
According to the multistage nature of the fatigue phenomenon, compare Fig. 1, the localization of the plastic slip in the PSBs leads to an accumulation of damage within the slip band. Further fatigue loading leads to the formation of micro-cracks, which eventually grow to macro-cracks. Reference Wang and Mughrabi31 While the formation mechanisms and the obtained structures of PSBs Reference Essmann, Gösele and Mughrabi17 on the one hand and the consecutive steps of the growth of a micro-crack toward a macro-crack Reference Paris and Erdogan8,Reference Neumann32 on the other hand are well understood, the transition from strain localization in the PSBs to crack nuclei is still not clear in detail and are discussed controversially. Essentially, three models aim to link the localized slip in a PSB to the crack formation in line with relevant experimental observations Reference Wang, Mughrabi, Hansen and Riso19,Reference Dörr and Blochwitz33–Reference Man, Vystavěl, Weidner, Kuběna, Petrenec, Kruml and Polák35 : (i) The model proposed by Mura et al., Reference Tanaka and Mura36,Reference Mura and Nakasone37 (ii) the EGM-model, Reference Essmann, Gösele and Mughrabi17 see also Differt et al., Reference Differt, Esmann and Mughrabi38 and (iii) the model by Polák et al. Reference Polák39,Reference Polák and Man40
-
(i) Tanaka and Mura Reference Tanaka and Mura36,Reference Mura and Nakasone37 explain the crack initiation as a quantitative, energy-based mechanism. The dislocation glide in push and pull direction is localized on adjacent planes, allowing slip only in one direction. Continuous glide leads to a dislocation pile-up at the grain boundaries causing a stress raise until the elastic energy exceeds the surface energy to form a crack of the length 2a.
Multiple stages in the cyclic deformation and fatigue damage regimes leading to fatigue failure. After Reference Mughrabi7 from Ref. Reference Bach, Möller, Göken, Bitzek and Höppel26.

In contrast to the Tanaka and Mura model, which is based on a micromechanical dislocation model, the EGM-model Reference Essmann, Gösele and Mughrabi17 and the model proposed by Polák Reference Polák39 refer to the microstructural processes during fatigue loading. Originally, both models have been developed based on studies on monocrystalline fcc copper and have been later extended to polycrystalline fcc materials, compare. Reference Mughrabi, Bayerlein, Wang, Brandon, Chaim and Rosen27,Reference Polák and Man40
-
(ii) As described above, in the EGM-model, Reference Essmann, Gösele and Mughrabi17 the to-and-fro glide of dislocations in the PSB leads to formation of dislocation dipoles. Depending on the sign of the dislocations, a point-defect character can be assigned to those dipoles. These are either of vacancy or of interstitial type, and vacancy-like dipoles are considered as dominant. The higher vacancy concentration within the PSB leads to a flux toward the matrix and to a material flow from the matrix into the PSB, respectively. The crack initiation is described in different ways by the EGM-model and Polák’s model with regard to the diffusive behavior of the generated vacancies: In the EGM-model, Reference Essmann, Gösele and Mughrabi17 only extrusions form at the surface. In the regime of intermediate temperatures, it is suggested that vacancy clusters accumulate along the PSB-matrix interface. Micro-cracks are then formed by coalescence of the vacancy voids at the PSB-matrix interface. While the EGM-model predicts only the formation of extrusions and not of intrusions, surface depressions, which could be denoted as “intrusions”, are either the result of statistical roughening or are actually micro-cracks, which form at sites of stress concentrations in the vicinity of the extrusion.
-
(iii) Basically, the Polák model represents a modification of the EGM-model. In the Polák model, Reference Polák and Man40 the vacancies are expected to distribute homogeneously along the PSB-matrix interface without any agglomeration. Different from the EGM-model, the escape of vacancies from the PSB to the adjacent matrix is considered, leading to the prediction that parallel intrusions form at both PSB-matrix interfaces of the extrusion emerging at the surface.
In the present work, the formation and development of extrusions at PSBs are investigated by using an interrupted monitoring technique. The main focus is on the interaction of PSBs with grain boundaries and the influence of grain orientation regarding the role for crack initiation. The results are then discussed and compared with the models described above.
II. EXPERIMENTAL PROCEDURE
Polycrystalline Cu (purity 99.9%) with an average grain size of 40 µm determined by means of line intercept method was investigated. The sample had a rectangular cross-section with sides of 10 mm and 2 mm, respectively, and with rounded edges. This particular design has been proven in the past to be optimal for in situ tests with combined EBSD measurements over a large area of the planar surface. Subsequently, the surface layer of 0.1 mm depth was removed by chemical etching with a solution of conc. HNO3, conc. HCl, and H2O to remove the deformation layer which formed during mechanical milling. The surface roughness was then reduced by electro-polishing using Struers D2 electrolyte (Struers GmbH, Willich, Germany). To obtain a slight grain boundary etching, the samples were etched with a 20% solution of ammonium persulfate.
The total strain amplitudes during the symmetric fatigue tests were
 $\varepsilon _{{\rm{a,tot}}}^{\rm{A}} = 0.1\%$
(sample A) and
 $\varepsilon _{{\rm{a,tot}}}^{\rm{B}} = 0.2\%$
(sample B), respectively. In saturation, the plastic strain amplitudes εa,pl were
 $\varepsilon _{{\rm{a,pl}}}^{\rm{A}} = 1.25 \times {10^{ - 5}}$
and
 $\varepsilon _{{\rm{a,pl}}}^{\rm{B}} = 5 \times {10^{ - 4}}$
, respectively. The fatigue tests were performed in the Large Chamber-Scanning Electron Microscope (LC-SEM) at the “Joint Institute for New Materials and Processes (ZMP)” in Fürth. The LC-SEM is a worldwide unique combination of a SEM with a large sample chamber for large specimens with a mass of up to 300 kg and the servo-hydraulic testing machine MTS 810 (MTS Systems Corporation, Eden Prairie, Minnesota), capable of loads up to 100 kN. This combination allows uniaxial in situ push–pull fatigue tests on macroscopic samples. In order for the SEM to operate, the tests were performed in a high vacuum at p < 2 × 10⁻⁶ mbar.
The samples were repeatedly dismounted after specific cycles for ex situ investigations, depending on the in situ observed surface evolution. The ex situ investigations by EBSD and focused ion beam (FIB) milling were carried out at the Zeiss Crossbeam EsB 1540 (Carl Zeiss AG, Oberkochen, Germany) at the “Institute I: General Material Properties” in Erlangen. The first FIB-cuts in sample A were milled after 2 × 10⁵ cycles and in sample B after 2 × 10³ cycles, respectively. Prior to that, EBSD measurements were performed to characterize the grain orientation defined by Euler angles. From the Euler angles, the Schmid factors of the primary slip system were calculated.
FIB tomography was performed on a surface relief (SR) in sample B after fatigue failure to obtain the micro-crack network formed along the PSB-matrix interface. A total of 484 FIB slices were cut with a step size of 37.5 nm over a distance of 3.17 µm. Image acquisition was performed after each FIB-milled slice. The 3D crack model was then reconstructed from 85 tomography slices using FEI’s Amira software. Reference Stalling, Westerhoff, Hege, Hansen and Johnson41
III. RESULTS
A. Lower strain amplitude
During cyclic loading at the lower total strain amplitude of
 $\varepsilon _{{\rm{a,tot}}}^{\rm{A}} = 0.1\%$
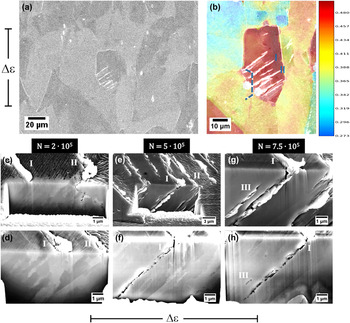
(sample A), a first SR appeared after 5 × 10⁴ cycles [Fig. 2(a)]. The Schmid factor map [Fig. 2(b)] shows that in the grain of early SR formation, the Schmid factor is nearly 0.5, indicating that a maximum resolved shear stress acts in the primary slip system.
Reference Schmid and Boas42
The neighboring grains with a lower Schmid factor show little to no SR formation. The location of the first FIB cut in sample A after 2 × 10⁵ fatigue cycles is indicated in Fig. 2(b) by the dashed line. The FIB cut along the grain boundary [Fig. 2(c)] shows an alignment of the microstructure parallel to the primary glide plane in the electron channeling contrast (ECC). In addition, a crack embryo forms along the grain boundary. This can be linked to the glide activity in the slip band associated with the SR of PSB II. A second FIB cut [Fig. 2(d)] reaching deeper into the volume of the grain shows the microstructural alignment beneath the extrusions. PSBs are clearly visible. Because of unfavorable imaging conditions, as explained later, distinct ladder-like structures could not be observed beneath the SR of PSB I at this stage. Furthermore, no crack nuclei can be detected. The sudden change in contrast at the grain boundary [Fig. 2(d)] shows that those slip bands do not penetrate the grain boundary.
SEM, EBSD, and FIB analysis of sample A during fatigue (a) analyzed grain with extrusions after N = 2 × 10⁵ cycles. (b) Schmid factor map of analyzed grain and neighborhood, the dashed line marks the location of the FIB-milled face. (c) FIB cut of grain after N = 2 × 10⁵ cycles revealing microstructure, grain boundary and initial crack along grain boundary. (d) 2nd FIB cut after 2 × 10⁵ cycles. (e) State of surface after 5 × 10⁵ cycles. (f) Microstructure and crack embryos at PSB I after N = 5 × 10⁵ cycles. (g) State of surface after 7.5 × 10⁵ cycles. (h) Microstructure and crack embryos at PSB I after 7.5 × 10⁵ cycles. (c–h): loading axis horizontal.

After further cyclic loading to 5 × 10⁵ cycles the extrusions I and II have grown slightly on the sample surface [Fig. 2(e)]. Due to the free surface generated by the FIB cut, extrusions have also formed here along the associated PSBs. By careful FIB milling (polishing) with a low current, those extrusions were removed to better reveal the microstructure in the ECC mode and to detect crack embryos [Fig. 2(f)]. The crack embryos at PSB I are all located along only one interface of the PSB-matrix boundary. Along PSB II, no visible crack embryos have formed. The crack embryos along PSB I are not strictly queued up along a straight line but are rather distributed in the vicinity of the interface. The distance between and size of the crack embryos varies while most crack embryos are very small (<250 nm). The microstructure does not show any change compared to the structure obtained at 2 × 10⁵ cycles and the grain boundary is still observable, showing no penetration of slip bands. It has to be pointed out that intrusions were neither detected for PSB I nor for PSB II.
After additional cyclic loading to 7.5 × 10⁵ cycles, the extrusions I and II at the sample surface have not developed any further, in contrast to the extrusions of the free surface created by FIB milling [Fig. 2(g)]. Parallel to the early formed extrusion along the associated PSB, a new slip band III has formed leading to visible extrusions only at the FIB-milled surface. After removing the extrusions, the cracks are revealed [Fig. 2(h)]. According to the stage after 5 × 10⁵ cycles, the crack embryos are aligned again only along the PSB-matrix interface of PSB I but are more pronounced and start to link forming a crack. Additionally a crack embryo is visible at the newly formed PSB III.
B. Higher strain amplitude
At the higher total strain amplitude of
 $\varepsilon _{{\rm{a,tot}}}^{\rm{B}} = 0.2\%$
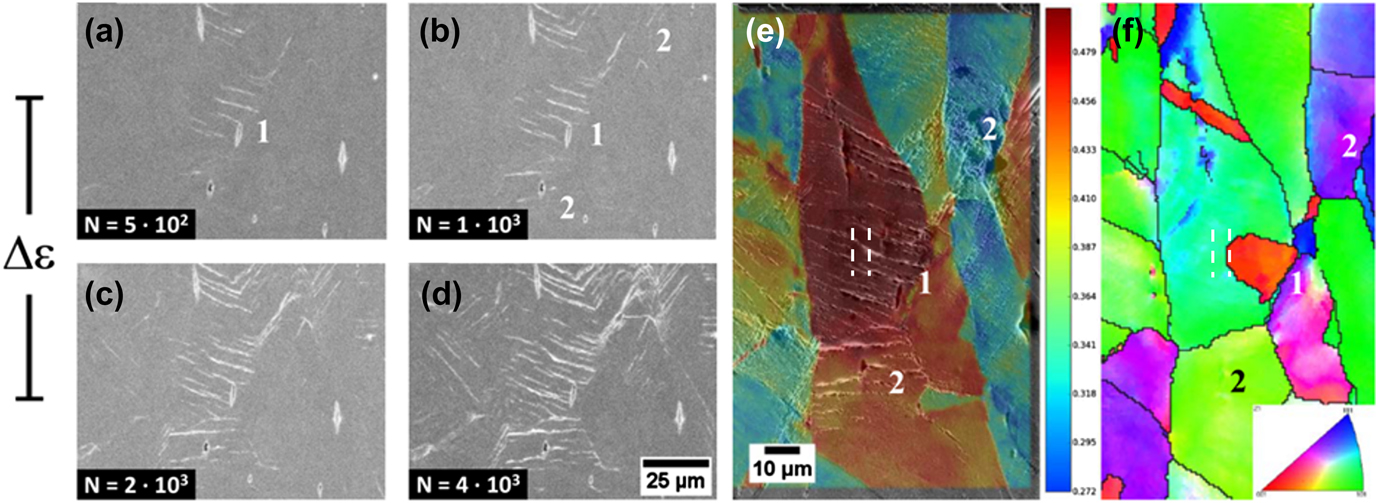
(sample B), the first surface reliefs that indicate that PSBs have formed appear after 500 cycles [Fig. 3(a), area 1] and are extend up to 4 × 10³ cycles [Figs. 3(b)–3(d)]. Schmid factor analysis after 4 × 10³ cycles confirms [Fig. 3(e)] that early extrusion formation takes place in favorably oriented grains. Different to sample A [Fig. 2(b)], inferiorly oriented neighboring grains in sample B also show PSB formation [Figs. 3(b)–3(d), area 2]. Due to the higher plastic strain amplitude, the local elastic anisotropy and thus the plastic incompatibility lead to a dislocation glide in grains with a nominally low resolved shear stress on the primary slip system and hence to extrusion formation.
In situ LC-SEM and EBSD analysis of sample B SR evolution after (a) 500 cycles, (b) 1 × 10³ cycles, (c) 2 × 10³ cycles and (d) 4 × 10³ cycles. (e) Schmid factor map of analyzed grain (1) and neighborhood (2), (f) IPF map of orientation perpendicular to the loading axis, revealing a second grain within area (1), the dashed lines mark the location of the FIB-milled face (e, f).

By analysis of the inverted pole figure (IPF) map of sample B [Fig. 3(f)] a grain boundary can be identified within the high Schmid factor area (red colored grain, area 1). Thus, a small grain is embedded in another bigger grain, both with a high Schmid factor of about 0.5. Compared with the extrusion evolution during the first 4 × 10³ cycles, it can be seen that the first PSB developed in the small grain [red colored in area 1, Fig. 3(f)], which then expanded over the grain boundary into the neighboring grain. This leads to the assumption that both grains have a high plastic compatibility.
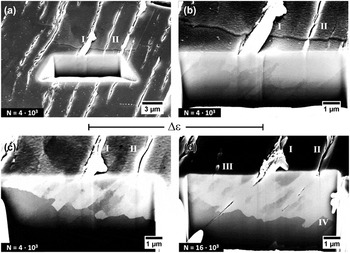
Extended analysis after 4 × 10³ cycles using FIB milling shows the formation of an extrusion over the grain boundary [I and II in Figs. 4(a) and 4(b)] and the near parallel alignment of the extrusion line and ledge in both grains, indicating that the primary glide planes show little or no misorientation. Calculations from the Euler angles prove that both the glide plane and the Burgers vector of the primary slip systems in both grains have a misorientation smaller than 5°. PSBs I and especially II show a change in appearance. In the big grain, they show extrusion ledges emerging from the surface, whereas in the small grain, the ledges disappear and the PSBs have rather a micro-crack character. This character progressively changes in PSB I, in PSB II, however, the character changes discretely at the grain boundary [Fig. 4(b)].
FIB analysis of sample B in area (1). (a) Location of FIB cut after 4 × 10³ cycles in large grain. (b) Detailed view of region (a), SR across grain boundary after 4 × 10³ cycles. (c) 2nd FIB cut across grain boundary after 4 × 10³ cycles. (d) FIB-milled face after 16 × 103 cycles revealing microstructural changes at PSB and grain boundary.

Similar to sample A, the microstructure shows an alignment along the glide plane associated with PSB I and PSB II.
Further FIB milling reveals the microstructure in the vicinity of the grain boundary [Fig. 4(c)]. The microstructure is aligned in the same way as in the neighboring grain due to the small misorientation of the slip systems. In addition to the alignment, the PSBs underneath the surface reliefs are clearly observable in the ECC, as well as the grain boundary. PSBs I and II both form a step at the grain boundary, showing that part of the grain is extruded into the neighboring grain. This deformation is possible as both grains show a high plastic compatibility. It has to be mentioned that neither the FIB cuts nor the observed very small micro-cracks affected the obtained cyclic response, although the local stress- and strain-states in the FIB-cut grains have surely changed. As the PSB related dislocation structure has been formed prior to FIB cutting, it is assumed that the slight change in the local stress-/strain-states does not significantly affect the cyclic deformation behavior.
After 16 × 103 cycles, the morphology of the SR has not changed significantly [Fig. 4(d)]. The extrusions formed on the FIB-milled surface have been removed so that the micro-cracks that formed along PSB I and II become visible. These micro-cracks are located only along one side of the PSB-matrix interface. Grain boundary migration is observable at the PSB and the regions in between in such a manner, that the extrusion steps at PSB I and II are not as pronounced as after 4 × 10³ cycles. While PSB I and II have grown only slightly during the last 12 × 103 cycles, additional PSBs III and IV have formed. They show a similar behavior at the grain boundary as PSBs I and II at an earlier stage, resulting in extrusions at the surface and at the grain boundary. Again, it is emphasized that no (parallel pairs of) intrusions, as predicted by the Polák model, are visible in Fig. 4.
IV. DISCUSSION
A. PSB formation
Results from the fatigue experiments and EBSD measurements of both samples have shown that early PSBs form in grains exhibiting a high Schmid factor of close to 0.5. This also applies for later fatigue cycles in sample A. PSBs only form within a grain when the grain is preferentially oriented. Some PSBs form at grain boundaries due to grain morphology, elastic anisotropy, and plastic incompatibility, leading to locally higher stresses at the grain boundary. Consequently, the critical resolved shear stress on a slip system can be exceeded, which induces slip activity. Reference Schmid and Boas42 This effect is even more pronounced at the higher strain amplitude (sample B), as incompatibility stresses scale with the increasing overall strain amplitude. This leads to higher stresses at grain boundaries and in the bulk of grains with an increased probability to exceed the critical resolved shear stress on slip systems.
A remarkable effect during this experiment is the different growth behavior of the extrusion correlated to the same PSB in the FIB-milled face compared to the sample surface. While at the sample surface, the growth of the extrusion stops, and the height reaches a maximum; extrusions, voids, and micro-cracks form along the same PSB at the FIB-milled surface after early formed extrusions are removed. These findings are different from investigations of early SR formation, Reference Polák, Man, Vystavěl and Petrenec43 where the extrusion growth is nearly the same at the surface and in the FIB-milled face. However, in the investigation of Polák et al., Reference Polák, Man, Vystavěl and Petrenec43 the PSM on the FIB-milled face were not removed as it was done in the present investigation to reveal the microstructure by ECC. A possible explanation for this growth behavior might be hardening in the surface layer of the extrusions impeding further deformation and subsequent growth of the extrusions. Accordingly, extrusion growth continues on the FIB-milled face, where the presumably hardened surface layer has been removed.
At the higher total strain amplitude (sample B), formation of new PSB III and IV can be observed at a late stage of fatigue, whereas the PSBs I and II reach a final shape such as the corresponding SR I and SR II. This suggests that in these PSBs, no further plastic slip occurs. According to similar findings in the investigation of half-cycle slip activity in PSB, Reference Weidner, Beyer, Blochwitz, Holste, Schwab and Tirschler44,Reference Weidner and Skrotzki45 this behavior is attributed to hardening of the affected PSB, which might be caused by micro-cracks Reference Mughrabi, Wang, Lukáš and Polák46 and a secondary slip. Reference Man, Klapetek, Man, Weidner, Obrtlík and Polák47 Therefore, hardening within the early formed PSB would be a suitable explanation for the later formation of new PSBs and extrusions, carrying the grain’s deformation. However, the observed initial global fatigue softening of the sample and later saturation stands in contrast to the conclusion, that in early formed PSBs underlie a hardening process. Nevertheless, local hardening is a possible explanation for these results.
Typical ladder-like structures within the PSB could be observed in principle by the ECC technique. Reference Weidner and Skrotzki45,Reference Zauter, Petry, Bayerlein, Sommer, Christ and Mughrabi48–Reference Weidner, Blochwitz, Skrotzki and Tirschler51 In the present work, however, the ladder-like structures could not be resolved because geometrical limitations due to the experimental setup in the LC-SEM lead to a lower resolution of the ECC images. The large dimensions of the sample for the in situ tests lead to a rather small range of maneuverability in the FIB vacuum chamber so that the FIB-milled surface could not be aligned perfectly to the electron beam and detector.
B. PSB—grain boundary interaction
The investigations of sample A and B were performed on extrusions and their corresponding PSBs and their interactions with grain boundaries. The investigation of sample A shows no indication of penetration or other interactions of a PSB into the adjacent grain. However, in sample B after 4 × 10³ cycles, PSB I grew locally in a nearly rectangular shape by the grain boundary displacement into the adjacent grain [Fig. 4(c)]. Obviously, both grains have a high plastic compatibility and thus the extrusion ledge can easily grow into the neighboring grain. Similar observations were made for nickel, where also grain boundary displacements were observed. Reference Weidner and Skrotzki45,Reference Mecke and Blochwitz52 The boundary displacements in the present investigation differ regarding the magnitude and shape of the ledges. Here, rectangular shaped ledges [see PSB I in Fig. 4(c), PSB III and IV in Fig. 4(d)] reach far into the adjacent grain, following the ladder structure of a PSB, whereas in Refs. Reference Weidner and Skrotzki45 and Reference Mecke and Blochwitz52, the displacements are small and round. This is due to the special character of the high angle grain boundary in sample B, ensuring a high plastic compatibility.
Regarding PSB I, in sample B with extrusions both at the sample surface as well as at the grain boundary, a volume increase in the PSB can be presumed. This volume increase is linked to the processes governing the development and straining of the PSB, as described in Sec. I. These findings also strongly indicate that PSB formation and straining are controlled by point defects. Mobile vacancies are produced when vacancy-like dislocation dipoles are formed in the PSB. Reference Essmann, Gösele and Mughrabi17,Reference Polák39,Reference Polák and Man40 Their diffusion toward the PSB-matrix interface with a lower vacancy density resembles a material flux into the PSB, leading to a volume increase. These results suggest that the volume increase is responsible for the forming of extrusions at the surface. At grain boundaries, either ledges are formed in the case of a plastic compatibility or a stress raise occurs, until a crack can form along the grain boundary.
In sample B another effect could be observed. From 4 × 10³ to 16 × 103 cycles, the grain boundary migrated, resulting in the growth of the small grain containing the PSBs. The extrusions resemble the curvature of the grain boundary, raising the grain boundary energy. The grain boundary then migrates toward the center of curvature, thus reducing the overall grain boundary area and curvature, hence decreasing its energy. The observed grain growth in the direction of slip bands is a feasible explanation for the grain growth mechanism of ultra-fine grained (UFG) materials under cyclic loading. Reference Höppel, Zhou, Mughrabi and Valiev53
C. Crack initiation
Crack initiation under fatigue loading is a long discussed topic. Many different models have been developed which are based on different mechanisms, related to vacancies or dislocations; to describe the crack initiation mechanism in detail, compare Sec. I and see Refs. Reference Brown, Ogin, Willis, Bilby and Miller54–Reference Polák56. The common aim is to try to explain the crack formation just along PSBs or by interaction with a grain boundary, see Ref. Reference Essmann, Gösele and Mughrabi17.
In sample A and sample B, cracks form along the PSB-matrix interface. Also, the grain boundary in sample A shows some crack embryos. Notably, the cracks did not form in the direct boundary to a PSB. The shape of the cracks formed in sample A [Figs. 2(f) and 2(h)] are rather elliptical and small. The cracks at PSB I and II in sample B [Fig. 4(d)] are much more deformed and elongated due to the higher plastic strain amplitude.
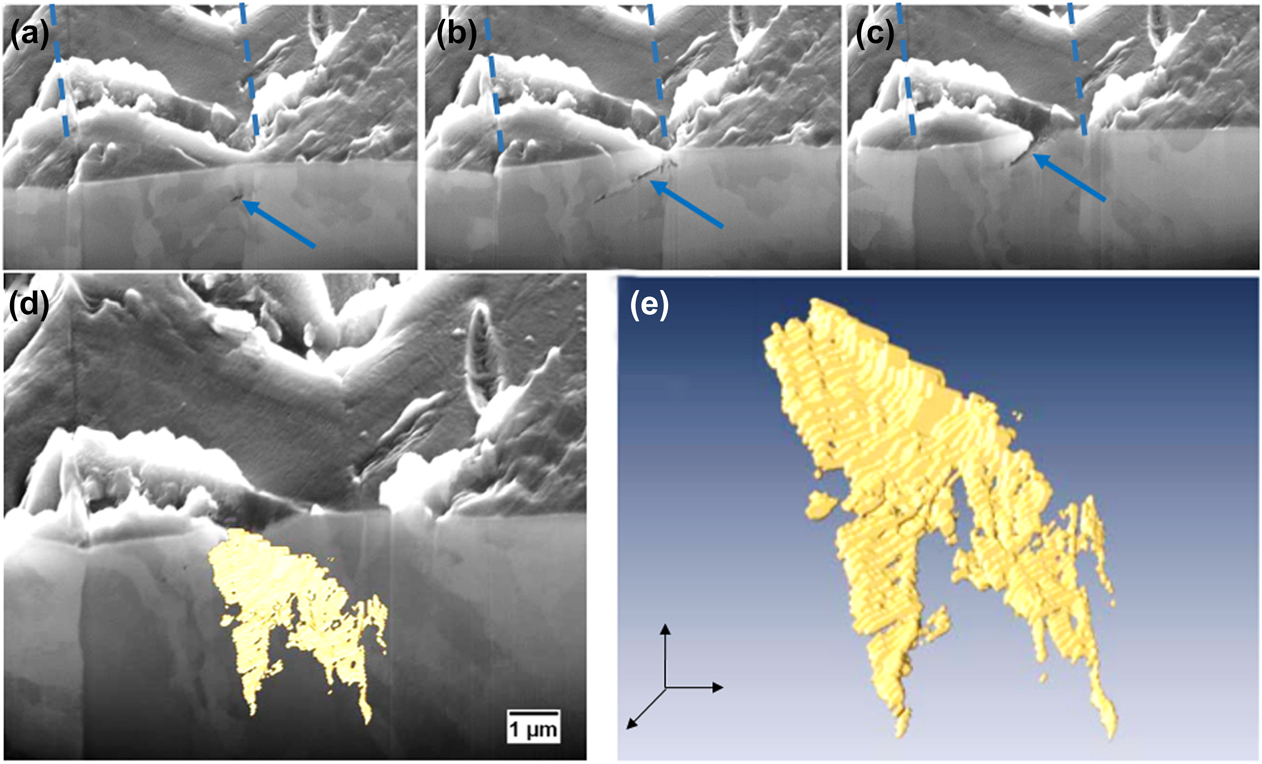
The images in Fig. 5 show the results of FIB tomography on a micro-crack network formed in a narrow twin. The micro-crack is of random shape and differs strongly from a semielliptical shape. It exhibits two significant features: on the right side, its propagation is limited by the twin grain boundary [Figs. 5(a)–5(d)], and in the middle it splits into two branches [Figs. 5(b), 5(d), and 5(e)]. The twin boundary raises the stress on the glide plane of one of the grains due to compatibility stresses. This leads to a higher slip activity, thus creating a crack on only one side of the twin boundary. Reference Neumann, Tönnessen, Kettunen, Lepistö and Lehtonen34,Reference Heinz and Neumann57 The splitting of the crack into two branches is affected by the microstructure of the corresponding PSB during cyclic deformation. In Fig. 5(b), the two branches can be seen as two individual cracks. Using ECC, a separating domain in the microstructure can be determined between both cracks. This means that the PSB is not homogeneously growing into the bulk of the grain.
FIB tomography of a micro-crack formed along a PSB at a twin boundary (marked with dotted lines). The loading axis lies vertically to the image. (a–c) 3 different slices of crack FIB tomography. (d) 3D reconstructed micro-crack network. (e) Solely displayed 3D model of reconstructed crack embryo from (d). The crack embryos in (a–c) are marked by arrows.

According to the EGM-model, Reference Essmann, Gösele and Mughrabi17 the formation of extrusions is related to the deformation-induced vacancy content. Essentially, it is proposed that a crack embryo can form as a consequence of clustering of vacancies. In every case, cracks formed in the FIB-milled faces in sample A and B (Figs. 2 and 4) have to be considered as cracks originating at a free surface, as they appeared only after FIB milling. The nonhomogeneous distribution along the PSB-matrix interface suggests that vacancies diffuse toward the free surface which functions as a sink, forming surface-near voids and dents as proposed by Ref. Reference Essmann, Gösele and Mughrabi17. The development of the micro-crack network then occurred by the coalescence of the void clusters. This is indicated by the narrowing growth into the bulk of the grain. Early formed parts of the crack exist longer. Hence, a larger number of vacancies were formed in those parts, resulting in a wider crack opening. The splitting can be explained by a locally different microstructure, hence, the PSB did not grow into that specific area, and no vacancies were generated by dislocation dipole annihilation. In consequence, the crack split into two branches. However, further detailed investigations need to be performed to elucidate whether this is a general process during fatigue and how twin spacing and orientation affect this splitting up of the crack. Twin boundaries are already well known to act as preferred crack initiation sites during fatigue, compare, for example, Neumann and Heinz. Reference Heinz and Neumann57 More recently, the work from Li et al. on copper bicrystals Reference Li, Zhang, Zhang, Zhou, Qu, Yang and Zhang58 showed that micro-crack nucleation is triggered by twin boundaries compared to the formation of primary slip band cracks in monocrystalline copper. In this context, the reader is also referred to the work of Zhang et al., Reference Zhang, Zhang, Li and Zhang59 which addresses the role of twin boundary orientation on fatigue cracking. The authors introduced the “difference of Schmid factors” which seem to play, besides the stacking fault energy, a decisive role for twin boundary cracking. Further investigations should be performed to understand the reasons for twin boundary crack splitting in more detail.
Besides the observed twin boundary crack splitting, a formation of voids in the bulk along the PSB-matrix interface was not observed. Still, the vacancy cluster could have formed which was not resolvable by means of SEM. To reveal the possible cluster and void formation, nondestructive analysis by, for example, small angle neutron scattering (SANS) or positron annihilation spectroscopy (PAS) are suggested methods, which avoid the formation of an artificial sink such as a free surface. However, small voids are formed along the grain boundary in sample A [Fig. 2(c)]. This grain boundary lies in the further vicinity of PSB II. The grain boundary might have served as a sink for vacancies, therefore clusters were formed. Intrusions, described as depressions on the surface next to extrusions, which are formed at the PSB-matrix interface, as described by the Polák model, Reference Polák39,Reference Polák and Man40 could not be observed.
V. CONCLUSION
The results and discussion given in the present paper provide a deeper insight into the behavior of PSBs and their interaction with grain boundaries in polycrystalline copper as well as their role for crack initiation. Though limitations of the experimental setup affected the observed results, e.g., the free surface generated by FIB milling, the results reported allow the following conclusions to be drawn:
PSB formation and the evolution of a related SR or extrusion is strongly orientation dependent. Early PSBs form in favorably oriented grains where the resolved shear stress on the primary slip system reaches a maximum.
With increasing the strain amplitude, the compatibility stresses between less favorably oriented grains caused by elastic anisotropy increase. Thus, the resolved shear stress on the primary slip system can exceed the theoretical stress, based on the calculation of the Schmid factors, and can thus lead to the formation of PSBs in less favorably oriented grains.
Localized straining in PSB leads to the generation of point defects, predominantly vacancies, as proposed by Essmann et al. Reference Essmann, Gösele and Mughrabi17 and modified by Polák et al. Reference Polák39,Reference Polák and Man40 Crack initiation at PSB-matrix interfaces can be linked to the vacancy-formation, as described by the Essmann–Gösele–Mughrabi model. Reference Essmann, Gösele and Mughrabi17 No evidence of intrusions along the PSB-matrix boundaries has been obtained. Crack embryos are formed at the free surface. During fatigue they coalesce and grow into the material. Crack initiation at grain boundaries is governed by similar vacancy processes. Material flow into a PSB leads to compressive stresses, where the PSB hits a grain boundary. It was shown that in the case of plastic compatibility, an extrusion penetrates the grain boundary and a ledge forms by the grain boundary displacement. In contrast, when the plastic compatibility of neighboring grains is limited, the local stress raises at the grain boundary and thus the grain boundary becomes rather attractive for vacancies as they will decrease the elastic strain energy. Consequently, a grain boundary crack nucleus can form. In this context another question then comes into play: Which microcracking type evolves more possibly into the fatal macrocrack and how is this influenced by the applied amplitude?
ACKNOWLEDGMENTS
The authors like to greatly acknowledge the funding by the German Research Council (DFG) within the scope of project Go741/23-2. The authors also gratefully acknowledge the funding of the DFG which, within the framework of its “Excellence Initiative”, supports the Cluster of Excellence “Engineering of Advanced Materials” at the University of Erlangen-Nürnberg.