1 Introduction
Recent media coverage of public pension developments is alarming. Some stories focus on the generosity of public pension benefits to specific individuals suggesting that public pensions are too generous (Walsh and Schoenfeld, Reference Walsh and Schoenfeld2010). Others focus on costs or liabilities suggesting that the financial obligations are widely threatening public fiscal operations (Von Drehle, Reference Von Drehle2010). Yet, other articles focus on the historical governance of plan financing suggesting that sponsors have deluded themselves with false estimates of long-term costs and obligations and distorted valuations of plan assets (Biggs, Reference Biggs2010). Finally, some articles suggest that decision makers face almost impossible challenges in restructuring plans because participants are often shielded from plan modifications (Laing, Reference Laing2010).
A review of public pension practices indicates that the nature and scope of the problems delineated varies considerably across the country. The following discussion provides a brief overview of the pensions offered by state governments. It evaluates the generosity of state-sponsored retirement benefits in the context of total compensation and compares the aggregate results of state and local employers with private sector practices. It describes the contemporary fiscal challenges states are facing with their pensions and attempts to explain how the current situation arose in some cases. A brief summary of the controversy over differing views on valuing pension obligations is presented and a suggestion is made that each view might be of practical use for particular purposes. An empirical section evaluates factors associated with variations in the generosity of public pension offerings followed by a concluding section that provides a perspective on addressing some of the issues raised in the discussion.
2 Operating environment for state retirement plans
U.S. Census Bureau (2008) reports that at the end of fiscal 2008, there were 218 retirement systems in operation organized at the state level and 2,332 at the local level. There were 19.1 million participants in the systems; 14.7 million were currently accruing benefits, 4.4 million were inactive and 7.7 million were receiving benefits. Among active participants, 89% were in plans organized at the state level and 85% of the beneficiaries were in state-level plans.
During fiscal 2008, total contributions to state and local plans were $79.6 billion; 31.1% came from employees, 30.5% from states and 38.4% from local governments. Employee contributions comprise a much larger share of DB financing in the public sector than the private. Although most participants are in state-sponsored plans, local governments account for the largest share of contributions because most local government employees, including teachers, participate in state plans. The states organize and administer the plans, but the local governments contribute based on service credits accrued by their employees. Public plans paid out $175.4 billion in benefits or an average of $22,650 per beneficiary in fiscal 2008 (U.S. Census, 2008). State and local government retirement plan assets dropped from $3.2 trillion at the end of 2007 to $2.3 trillion a year later, a decline of 27.6% (GAO, 2010).
The regulatory environment under which the state and local retirement system operates is much different than that imposed on the private sector system. When the Employee Retirement Income Security Act (ERISA) was adopted, lawmakers exempted public plans from most of its requirements. ERISA rules that govern participation and vesting standards, funding requirements, prohibited investment transactions, joint and survivor annuities, reporting and disclosure requirements and Pension Benefit Guaranty Corporation (PBGC) insurance for private plans do not apply for those sponsored by public entities. Some Internal Revenue Service (IRS) rules apply to public plans, but nothing nearly as complex and restrictive as private plan regulations. Under the more lenient regulatory environment, the public retirement system operates differently in several respects than the private sector. As the National Association of State Retirement Administrators (http://www.nasra.org/resources/pension%20protections.pdf; NASRA, 2005) puts it, ‘In lieu of ERISA, public pension plan sponsors (state and local governments) establish their own governing standards and rules. One beneficial outcome of this arrangement has been a wide range of policies and benefit structures, each suited to the unique needs of their plan sponsors’.
In 1975, the first year of plan disclosures under ERISA, there were 27.2 million private sector workers actively participating in private defined benefit (DB) plans and 11.2 million in defined contribution (DC) plans, 45 and 18%, respectively, of the total private sector workforce. By 2004, the disclosure data indicated that active participants in private DB plans had dropped to 20.6 million, whereas those in DC plans had climbed to 52.2 million, 19 and 48% of the private sector workforce that year. Since then, the trends toward freezing or terminating private plans have continued.
Public retirement plans are still predominantly traditional DB pensions. In the beginning of 2011, only three states offer something other than a traditional DB plan to new employees. In 1964, Nebraska established a money purchase DC plan, then closed it in 2003 and started a cash balance plan for new hires and anyone who wanted to switch from the old plan. In 1997, Michigan shifted from a traditional DB plan to a mandatory DC plan for all new hires and allowed existing employees to switch into the new system. Since 1 July 2006, all newly hired state and local workers in Alaska are covered under a DC plan. On 1 July 2011, Utah is offering newly hired workers an option of participating in a DC plan or a new DB plan to be fully funded by participant contributions. The employee contribution rate is set at 10% of pay. If that amount exceeds the DB plan costs, the excess goes into a 401(k) account. A number of other states including Colorado, Florida, Montana, North Dakota, Ohio and South Carolina already have optional DC plans available for employees not wishing to join the traditional DB plans. A number of states now sponsor combination DB and DC plans.
3 Information on plan characteristics
In preparing this paper, I constructed a dataset of state pension and retiree health benefit plan disclosure information. The plans provide coverage for state-level workers in most cases and often those from local jurisdictions. In some cases, there are one or two plans that cover virtually all public workers. In others, there are separate plans for general public employees, teachers, state police, police and firefighters, judges, legislators, etc. A handful of states offer a token benefit of $100 a month or so to National Guard members and several have separate plans for volunteer firefighters who also tend to offer token benefits. As noted, several states offer a DC plan for new hires now and some have allowed existing workers to shift into the DC plan. None of the DC arrangements were included.
The data were compiled from the states’ Comprehensive Annual Financial Reports (CAFR) or separate pension plan CAFR reports, actuarial valuation reports and pension audit reports. Much of the information is as of 30 June or 31 December 2009. In a few cases, the fiscal year ends on 30 September and the filing information is as of that date. In some cases, mostly smaller plans, the last reported information is based on an actuarial report that is older. In a handful of cases, disclosure information could not be located on a plan. In virtually every case, the evidence available suggested that these plans were so small that they were immaterial in the context of the analysis and were ignored.
There were 11.6 million workers covered under the pension plans that comprise the database used in the analysis compared to the estimated 13.1 million employed under state-level plans derived from the Census data mentioned earlier. Public pension coverage is often not a one-to-one mapping of public participation. Some plans have a service requirement before participation commences. Many plans do not cover all part-time workers, especially those working few hours per pay period or seasonally.
For the pension plans that are included, estimated accrued liabilities were $2.89 trillion and the estimated value of assets was $2.31 trillion leaving an unfunded liability of $561 million, about 20.8% of estimated obligations. The plan funding levels are generally consistent with the levels published by the Pew Center on States (2010) because the data sources are consistent; although the data here are often more current and accrued liabilities, asset levels and underfunding will vary slightly from their results.
4 Retirement benefits in a compensation framework
Employers, including governments, offer pensions for economic reasons (Clark et al. Reference Clark, Craig and Sabelhaus2010). There is a growing concern, however, that many public plans' benefits have become unjustifiable. News articles such as a recent front-page story in the New York Times that trumpets former New York cops drawing retirement pay in excess of their former salaries (Walsh and Schoenfeld, Reference Walsh and Schoenfeld2010) contribute to this perception. The impropriety of the benefits in this case comes in the explanation for how they arose. For some unexplained reason, outside time and compensation are being included in the pension determination when certain officers retire despite regulations that specifically exclude the inclusion of such time. In other cases, inequities arise because pensions are based on service under the plan, but include abnormal hours of overtime in the period before retirement.
Some public plans, especially police and fire plans, still determine retirement benefits on the basis of participants' pay earned in their final year of employment and ‘pay’ often includes overtime wages. Pension administrators have known for decades that final-year-pay plans that include overtime pay lead to abusive practices. When officers are approaching retirement eligibility, they have generally worked with their current commanding officers for many years and have relationships that naturally result in personal consideration for each other's welfare. If there is a need for someone to work overtime, why not give it to the long-serving fellow who has earned a little special consideration? But the occasional few hours can become a systematic process with unintended results; the practice has become so systematic that it has come to be known as ‘spiking’ of earnings in the pension world. In some cases, final pay balloons beyond anything representing normal earnings and boosts pensions well beyond levels intended by plan designers or policymakers adopting them.
If New York's police pension problem was an isolated case of retirees receiving significantly larger pension benefits than their annual pay while working, it could be considered an outlier. The evidence suggests that the practice may be widespread. In California, former fire chiefs have been singled out because they were allowed to add unused vacation time in calculating their pay for determination of a lifetime pension based on their final-year pay (Mendel, Reference Mendel2009). In Illinois, the former President of the State Senate was reported receiving a pension that is 30% higher than his salary while in office (Chicago Sun Times, 2009). The stories abound. The motivation for these benefits is hard to justify in the context of human resource management and rewards policy. It is likely political.
There is often an implication that public pension practices lead to unacceptably large benefits. For example, the New York Times has listed some 3,700 people on its public web site who are receiving annual pensions in excess of $100,000 per year from one or more New York public pension systems (NY Times, 2010). Similar lists of public plan retirees can be found at other news outlets for other systems around the country. These lists are often linked to a number of interesting and virtually all negative comments from the general public. They are not particularly enlightening regarding the appropriateness of the pensions being paid.
The complaints about $100,000 public pensions may be more about workers’ salaries than the extravagance of public pensions. In a world where average pay is around $40,000 per year, many people may not understand why a state comptroller is paid $200,000 per year. If that is what the market requires in order to hire a competent comptroller, the only alternative to paying a competitive wage is to hire an incompetent one. Then the costs to the public purse may be more than the marginal difference in pay between a competent and incompetent comptroller. This suggests that the long-term cost of paying a pension of more than $100,000 per year to some public retirees may be in the public's best interest. It also suggests that pay and total compensation during the working life should be reasonable in the context of the services provided by public workers and the labor markets in which the services are provided.
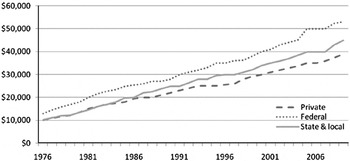
For years, widely held conventional wisdom has been that public employees have more generous retirement benefits than private sector workers because public employees are paid less. Private employers have shifted away from DB plans in recent years and have also altered retiree health benefits offerings. Most private sector employers offering retiree health benefits either eliminated them or limited obligations with premium caps and more stringent service requirements (Fronstin, Reference Fronstin2005). Given that private employers have moved more aggressively in curtailing retirement benefits than public employers in recent years, cash wages paid in the private sector should be rising faster than those in the public sector. Median pay levels in the public and private sectors shown in Figure 1 suggest that private sector pay growth has lagged that of public sector workers over the last 25–30 years with the differential increasing gradually over time. On first glance, private workers appear to be falling behind in pay despite their benefit cutbacks. The story is more complicated than the figure suggests.
Median reported annualized earnings for private sector, federal and state and local workers by year. Source: Tabulations of the March current population survey, various years.

Smith (Reference Smith1976) analyzed private and public sector pay comparability in the early 1970s. She controlled for workers’ characteristics estimating that women were paid a 12% premium in state-level jobs compared to their private sector counterparts but found no differential among men. At the local level, Smith estimated that women in the public sector received a 3.6% premium relative to the private sector women but men's pay lagged their private sector counterparts by 4.9%. Poterba and Rueben (Reference Poterba and Rueben1994) found rough parity in public and private sector wages in the early 1990s when controlling for workers’ characteristics. In a recent study, Bender and Heywood (Reference Bender and Heywood2010) conclude that state employees earn 11% less than comparable private sector workers and those at the local level earn 12% less. Their analysis suggests that state and local workers earnings have been declining over the past couple of decades relative to those in the private sector. It is possible that public sector employers have held the line on wages because they have not controlled benefits costs the way private employers have.
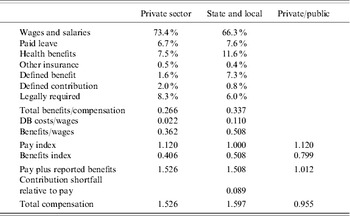
Bender and Heywood claim that adding benefits into their analysis has little effect on the results. They use the Department of Labor's National Compensation Survey (NCS) to measure the costs of wages and other components of compensation. Their results are hard to reconcile with the NCS data. The top section of Table 1 shows the share of compensation paid in various forms in the private and public sectors from the NCS. The second section of the table shows the aggregation of total benefits as a share of compensation, and DB costs and total benefits costs as a share of wages and salaries. It is clear that benefits are a larger share of compensation in the public sector. In the last segment of the table, benefits are added to wages in an index form to show how total compensation in the two sectors compares. For pay, the index is set to 1.12 for private sector workers and 1.00 for public sector workers to reflect the 12% differential pay levels that Bender and Heywood estimated. Benefits are added to the index by multiplying the ratio of benefits-to-wages by the pay index in each case. When pay and benefits are considered together, the 12% premium in pay attributed to private sector workers drops to 1.2% in the context of a total compensation comparison.
Shares of private and state and local employer compensation paid as wages or specified benefits

Source: U.S. Department of Labor, Bureau of Labor Statistics (2010), ‘Employer Costs for Employee Compensation’, News Release (8 September 2010), available at http://www.bls.gov/news.release/ecec.nr0.htm.
Benefit costs reported in the NCS may be biased downward and the bias is likely greater for public workers than those in the private sector. This is the case for retirement plans because private employers offering traditional pensions are subject to more stringent funding and disclosure requirements than the public sector. It is the case for retiree health benefit plans because they are much more prevalent in the public sector.
In the data that I have compiled on state-sponsored pension plans, the contributions made to the pensions during fiscal 2009 averaged 10.7% of covered payroll, almost identical to the reported level of contributions in the NCS and reflected in Table 1. The ‘actuarially required contributions’ (ARC), which would cover the cost of benefits that have accrued in the plan year plus an amortization payment to pay off unfunded liabilities over a specified period, usually 30 years, averages 12.6% of covered pay. In other words, the plan sponsors contributed an average of 1.9% of pay less than their computed ARC. For retiree health insurance plans, actual contributions averaged 3.5% of covered pay, whereas the ARCs averaged 10.5% of payroll. The states, on average, are contributing 8.9% of payroll less than their own calculations suggest that they should be contributing to these plans. If that 8.9% is added into the comparison calculation of compensation in the public and private sectors, as it is shown in the bottom line of Table 1, then state and local workers’ appear to be receiving a premium relative to their private sector counterparts. If the pension plans were valued in accordance with the method suggested by Novy-Marx and Rau (Reference Novy-Marx and Rauh2009), 30-year amortization costs would drive up pension costs by an additional 15% of payroll and the cumulative premium paid to public sector workers would reach 10%.
If policymakers have intended to provide benefits to offset pay penalties for public sector workers, they seemingly have been successful and possibly more. The result raises the question of whether public sector workers deserve a premium in compensation for their work given the relative security of public sector jobs compared to those in the private sector. The time trends on benefits suggest that the current premium in benefits at the public sector level will continue to widen in the future as many remaining private DB and retiree health plans wither away.
5 Commitments and consequences
Generous retirement benefits are expensive. Under current measurement standards, the unfunded obligations in state-sponsored pension plans are currently around $560 billion and underfunding of retiree health plans adds another $610 billion. The combined $1.2 trillion is an obligation accrued under policies adopted by public officials who will likely be long gone from their positions when future taxpayers are called upon to pay the bill. The bill is now coming due in many jurisdictions and it is having serious ramifications. In California, the LA Times reports that ‘commitments to retired state workers are crowding out crucial investments in education, health and infrastructure’ (LA Times, 2010). Pension costs have become so burdensome in some states that political leaders are now attempting to roll back benefit provisions even for current workers.
New Jersey Governor Chris Christie was recently quoted (Fehr, Reference Fehr2010) as saying, ‘Make no mistake about it, pensions and benefits are the major driver of our spending increases at all levels of government – state, county, municipal and school board. We cannot in good conscience fund a system that is out of control, bankrupting our state and its people, and making promises it cannot meet in the long term’. Shortly after his inaugural speech as governor in January 2010, he declared public budgets in the state a financial disaster and pointed to retirement costs as a major reason. The article that reported what governor Christie was raising in New Jersey indicated that 16 other states were considering pension changes that could mean lower benefits, later retirement ages or reduced cost of living adjustments but that most were only considering the changes for future new hires. Some states were said to be considering raising workers’ contribution rates immediately.
It is understandable that policymakers might offer public workers generous pensions to make up for low wages but it is not so clear why they would offer benefits that would jeopardize government operations even if such problems were off in the future. In partial explanation of the lavish pensions offered by the New York public systems, Walsh and Schoenfeld (Reference Walsh and Schoenfeld2010) offer:
The benefits have been enacted by legislators, signed into law by governors, hailed by comptrollers and adopted by local officials – all of whom were told by actuaries and other financial advisers that the pensions would cost just a fraction of what they are now turning out to cost. In very few cases do they know what they're agreeing to’, said Edmund J. McMahon, Director of the Empire Center for New York State Policy, which tracks pension costs. ‘They almost always obscure the costs, from themselves and from the public’.
The pension consulting industry in the U.S., which includes virtually all of the consulting pension actuaries, is rooted in the need for sound financial management of state and local pension systems (Sass, Reference Sass1997). George Buck established an actuarial consulting firm in New York in the 1920s to help New York City deal with a pension-funding crisis. Buck believed in funding workers’ pensions as they were earned (Sass, Reference Sass1997, p. 64). Pension funding was not just a New York concern in the 1920s. A Commission on Pensions of State Employees in California in the late 1920s stated that ‘An urgent responsibility rests upon the state to see that any retirement system which it may sponsor is placed upon a sound financial basis, where liabilities are provided for as they are incurred rather than when they mature’ (Legislative Analyst, 2007).
Despite good intentions by some, many state and local pension systems in the USA were poorly funded leading up to the Great Depression (Clark et al. Reference Clark, Craig and Sabelhaus2010). The Depression devastated state and local revenues when demand for public services was at a peak. While the states were struggling to cover their budgets, legal statutes or court orders frequently required them to pick up the pension liabilities of the municipalities within their borders as well. It seems logical that public officials would have learned the importance of pension funding from this experience. Evidence suggests otherwise.
Congress exempted public pension sponsors from the funding requirements in ERISA but policymakers were sufficiently concerned about the state of public plans that the House Committee on Education and Labor established a Pension Task Force on Public Employee Retirement Systems to document the status of public plans. The Task Force issued a report in 1978 (U.S. House of Representatives 1978) finding that 17% of state and local retirement plans were being run on a pay-as-you-go basis, 25% on some other non-actuarial basis and the remainder on some sort of actuarial funding basis (p. 151).
In the late 1970s, the most common funding approach used by employers in both the private and public sectors that were funding pension plans was the entry-age normal (EAN) method. Under this method, the actuary estimates the present value of expected lifetime benefits under the plan when the worker is first covered and divides that by the present value of the worker's expected lifetime earnings under the plan. This estimates the flat percentage of pay to be contributed each year to fully fund the benefits by retirement.
Beyond the late 1970s, public and private plans went in different directions in calculating funding requirements. Most private sponsors shifted funding to the projected-unit-credit (PUC) basis to coordinate with an FASB's requirements for pension accounting. Compared to the EAN approach, the PUC lowered costs early in workers' careers and increased them later. Novy-Marx and Rauh (Reference Novy-Marx and Rauh2009) estimate that today, about 15% of public plans are funded on a PUC basis and that the remaining plans are funded on an EAN or related basis. The EAN funding pattern is more conservative than the PUC pattern because the former tends to front-load contributions toward the beginning of a worker's career. If public plan actuaries are systematically underestimating pension costs, it seems odd that they would continue to use the conservative EAN funding method to estimate pension funding requirements.
It is possible that actuarial incompetence is leading some public plan sponsors to adopt plan provisions or administrative practices that are leading to erratic or overly burdensome funding requirements and a number of public plans have turned to the courts in recent years to make this claim. Alaska recently settled a suit that it had brought against its former actuary for a reported $500 million. But such settlements are often misleading with regard to culpability on the part of the consulting actuary. The plaintiffs nearly always demand a trial-by-jury in these cases and the issues are often extremely complicated to present to a group of individuals drawn from the local population. Settlement is often the low-cost way out of the suits.
Of course, with every action there is a reaction and the long-term result of recent law suits related to problems resulting from actuarial estimates of public pension costs may be the opposite of the desired outcome. A number of larger actuarial firms have recently withdrawn from consulting with public retirement plans because of the legal liabilities. The smaller firms that have picked up the business naturally lack the financial wherewithal of the larger firms. When problems arise with their work, the professional insurance coverage or resources of the firms themselves dramatically limit recovery by aggrieved clients.
Fresno County, California's Retirement Board recently brought suit for $99 million for errors made by their actuary leading to pension funding shortfalls. Ultimately, the plan settled for $250,000 because the professional insurance had lapsed for the small actuarial firm that made the mistake (Branan, Reference Branan2010). While the consulting actuary in the case admitted making errors in the plan valuation, an editorial in the Fresno Bee concluded that their ‘pension problem is a self-inflicted wound by various members of the Board of Supervisors and other county officials’. The editorial asserts that the county leaders should have been calculating the long-term costs associated with benefit enhancements adopted in 2001. The County Grand Jury concluded that ‘supervisors were to blame for the pension problems because they failed to say no to union demands for better benefits’. The Fresno Bee editorial concludes that the pension problems arose because ‘elected officials were looking out for union members instead of taxpayers footing the bill’.
Fresno was not the only local jurisdiction in California who enhanced retirement benefits in the early 2000s. Many jurisdictions were caught in a stampede response to enhancements to the state's public employee retirement plans (Rainey, Reference Rainey2010). In May 1999, CalPERS, the California Public Employee Retirement System administrator, introduced legislation to enhance benefit for members. The state legislature adopted the pension reform bill on the last day of its legislative session in September that year. For regular employees, the prior plan allowed retirement at age 60 with a benefit equal to 2.0% of 3-year average salary. The modified plan paid the 2.0% benefit at age 55 and graded up to 2.5% at age 63. For highway patrol members, the benefit formula went from 2.0% of average salary to 3.0% at age 50. For peace officers and firefighters, the 3.0% formula applied at age 55 and after. The enhancements applied to past service. For workers covered under CalPERS in the school system, it reduced the earnings averaging period from 36 to 12 months. The bill also provided an added cost-of-living adjustment on top of the annual adjustment built into the existing system (California Senate SB400 Analysis). According to the analysis of the legislation passed by the legislature,
CalPERS intends to fund the enhanced benefits provided by this bill through: (1) assets the system has generated over the past several years, due to the superior performance of the stock market; and (2) an accounting change that will value the system's assets at 95% of market value, rather than 90%, as is current practice. CalPERS indicates that the benefit package will reduce the actuarial surplus for the state from $10.4 billion to $7.092 billion, and for the schools from $7.2 billion to $4.46 billion.
If this benefit package is enacted, the state contribution will fall initially in 2000–2001, to 1.075 of payroll, or $103 million, due to the initial impact of the accounting change, but will increase significantly thereafter, to 4.65% of payroll in 2001–2002, or $465.6 million. The employer rate will level off in subsequent years, eventually falling below 3% in 2008–2009, but the employer contribution amount will remain in the $379 million range. CalPERS, however, believes they will be able to mitigate this cost increase through continued excess returns of the CalPERS fund. They anticipate that the state's contribution to CalPERS will remain below the 1998–1999 fiscal year for at least the next decade. (California Senate, 1999).
Despite CalPERS’ admission that this was ‘the biggest benefit increase in the history’ of the system in introducing the proposal, it received virtually no press coverage during the deliberations over its passage. When the bill passed, it received only cursory mention in the press anywhere in California, totally eclipsed in the news by a bill passed on the same day to provide gay students legal protection against abuse and an agreement to allow expanded Indian gambling operations around the state. The pension bill passed 39–0 in the Senate and 70–7 in the Assembly. Tom McClintock, now a Republican Representative in the U.S. Congress from California, was one of the no votes on the measure. He recently said that those supporting the measure at that time ‘could get credit from the unions now and the bill wouldn't come due until after they were gone’ (Rainey, Reference Rainey2010) – a classic moral hazard problem. Ultimately, some who voted for the measure were caught by their own contrivances because they continued to serve in the legislature as California public pensions became a fiscal nightmare. The anticipated funds to pay for the 1999 benefit increase were not available. The most recent ARC for the CalPERS plan is $6.9 billion dollars, 15.6% of covered payroll. The separate state teachers' plan, CalSTRS, has an ARC of $4.5 billion, 16.7% of payroll.
In the vast majority of states now experiencing financing problems with their pensions, the problem has nothing to do with actuarial calculations. It has to do with assumptions that ‘surplus’ funds in a booming financial market mean-free benefit enhancements can be dispensed without recognizing the true costs associated with the risks of doing so. In cases such as the 1999 CalPERS example, it has to do with functionaries within the system making the case that benefits can be dramatically enhanced without the public understanding the direct conflict of interest those individuals have in advocating pension increases from which they will benefit. It generally has to do with those voting to increase benefits being able to cash immediate political dividends without having to face the implications years later when the bill comes due.
5.1 Expected benefits: implications for pension funding and finance
The Government Accounting Standards Board (GASB, 2010) in its Statement 25 indicates that
The discount rate should be the single rate that, when applied to projected benefit payments, results in a present value of those payments equivalent to the sum of (1) the present value of projected benefits expected to be paid from current and expected future plan net assets, discounted at the long-term expected rate of return on plan investments, and (2) the present value of projected benefit payments that are expected to be made after plan net assets are projected to be fully depleted, discounted using a high-quality municipal bond index rate (GASB, 2010, p. 16).
Novy-Marx and Rauh (Reference Novy-Marx and Rauh2009) collected pension valuation data on 116 public pension plans sponsored by the 50 states to evaluate their calculation and reporting of their pension funding status. They conclude that most states are using an 8% rate to discount their future pension obligations and that there is little variation in assumed rates across the spectrum of states. This may reflect the long-term expected rate of return that public plans have realized in recent years (Novy-Marx and Rauh, Reference Novy-Marx and Rauh2009, p. 202).
Brown and Wilcox (Reference Brown and Wilcox2009) suggest that valuing pension obligations according to GASB Statement 25 implicitly assumes pension liabilities have the same risk profile as the invested assets securing the benefits. They summarize articles by Moore (Reference Moore2000) and Morrison and Foerster (Reference Morrison, Foerster, Greenebaum and McDonald2007) to indicate that most public sector workers have relatively strong contractual rights to their pensions. They observe that jurisdictions facing financial pressures often cut jobs and public services but pay their pensions because benefits' legal status is well grounded. If the obligation to pay the benefits is a virtual certainty, then future stream payments should be valued accordingly using a discount rate that is essentially risk free.
Brown and Wilcox and Novy-Marx and Rauh suggest that the appropriate liability measure for measuring public pension funding is the accrued benefit obligation (ABO) that considers the earned benefit based on current service under the plan and current pay. In terms of measuring pension obligations at a point in time, this is likely the best measure. However, it does not capture the obligation that a group of workers pose if there are protections in the plan guarantee such that the current benefit formula or plan rules cannot be suspended or curtailed even for future accrual purposes for existing workers.
In the analysis of the 116 plans that Novy-Marx and Rauh developed, they estimated plans’ asset holdings as of December 2008 at $1.94 trillion and their stated liabilities at $2.98 trillion. If the liabilities had been valued using a Treasury rate, the liabilities would have been $5.17 trillion; at municipal bond rates $3.25 trillion. Needless to say, the funding status of plans looks very different under the alternative perspective on valuing liabilities. If plans’ liabilities had always been valued on the basis of less risky discounting rates, it is likely that policymakers who approved the plans might have been less generous in providing public pensions.
Keith Brainard, Research Director at the National Association of State Retirement Administrators suggests that the risk-free discounting of liabilities might make sense for private pension plans because of potential bankruptcy but is not appropriate in the case of public plans. He argues that public plan sponsors have an ‘essentially perpetual’ life and can stay invested throughout financial market cycles (Mysak, Reference Mysak2010).
Possibly the strongest opposition of all to valuing pension liabilities any other way than they have been valued for years will come from the participants in the plans, especially union members with a natural platform to organize and make themselves heard with the policymakers who ultimately may be asked to weigh in on the subject. Biggs (Reference Biggs2010) tells of a recent solicitation for actuarial services by the Montana Public Employees' Retirement Board and the Montana Teachers' Retirement System where the request for proposals states: ‘If the Primary Actuary or the Actuarial Firm supports [market valuation] for public pension plans, their proposal may be disqualified from further consideration’.
Both views for assessing the obligations that plan sponsors face have a degree of legitimacy. For the purposes of funding, if a state is committed to keeping the plan fully funded, on average, over the investment cycle and is willing to increase contributions accordingly in the downside of the cycle, then Keith Brainard's perspective may be the optimal way to operate the plan. On the other hand, when a state or local government is going to the credit markets to help finance operations, lenders should have a reasonable perspective on the extent of existing obligations valued in accordance with the characteristics of the obligations. If the pensions are risk-free obligations, they should be so valued to properly inform the market. From this perspective, benefit enhancements are the equivalent of a bond issue and arguably should be considered in the context of valuation at rates consistent with the public entity's borrowing costs.
6 Pension benefits across the state divides
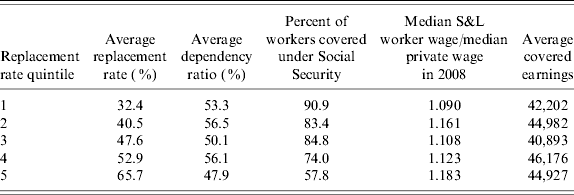
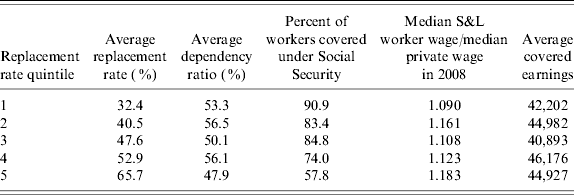
It is clear that various labor markets, other economic and political factors are associated with public pension outcomes across the states. To shed some light on these, plans are compared on the basis of generosity measured using a derived earnings ‘replacement rate’ estimated across the plans in the 50 states. The replacement rate in this case is the average benefit provided to retirees covered under the plans divided by the average pay rate of active workers currently covered under them. The states are grouped together in the Table 2 in quintiles based on their replacement rates. The averages shown in the table are calculated across the 10 states in each group. Weighting them by numbers of workers made little difference in the results. The results shown here are simply the averages from the ten states in each category.
Summary characteristics of pension plans provided to state and local workers at the state level by generosity of benefits provided to retirees relative to workers’ covered pay
Source: Developed by the author.
The average replacement rate in the bottom quintile of the distribution is half that of top quintile and the three states with the lowest replacement rates are providing benefits that are only about one-third of the top three states. The average dependency ratio variable in the table is simply an average across the states in each quintile of the number of retirees divided by the number of active workers in their respective retirement systems. There is no clear pattern between plan generosity and the average dependency ratio that would suggest the relative number of retirees is driving plan generosity.
One explanation for why some states might provide more generous retirement benefits than others reflected in Table 2 is that a number of public employees in some states are not covered under the Social Security. For example, in Ohio, virtually no public employees are covered under Social Security. In Texas, general employees of the state are covered but teachers are not. At least in theory, any public employer not providing workers Social Security coverage would have to provide a benefit of some comparable worth in order to be competitive in a labor market where virtually all other employers are required to provide such coverage. The data are consistent with the proposition that employers not offering Social Security coverage make up for it in their own retirement plans, although more than 90% of the state and local workers in three of the ten states in the top (most generous) quintile (Wisconsin, New Jersey and New York) are covered by Social Security.
The idea that public sector workers are provided richer pensions because they have inferior pay may be arguably consistent with the literature on pay differentials between public and private sector workforces. To be totally consistent, it would seem that the generosity of the pensions would decline as the pay differential with the private sector increases. The second column from the right-hand side of the table shows the averages of the median wages reported by state and local workers on the March 2009 CPS divided by the median wages reported by private sector workers in each state. The results do not reflect any clear-cut pattern in the relationship of plan generosity and relative pay rates between public and private sector workers. The right-hand column in the table suggests there is no clear pattern in the relationship of average pay under public plans and the generosity of the pension plan offered.
In order to more clearly sort out what factors might help explain the general generosity of public pensions offered at the state level, we estimate a simple model where:

where Replacement Ratei is the average benefit being provided by the pensions offered by state i divided by the average covered pay of active workers under the system; Dependency Ratioi is the number of people receiving a benefit in state i divided by the number of active workers covered under the system as reported in the most recent valuation; Funding Ratioi is the actuarial value of assets in the plans sponsored by state i divided by the actuarial accrued liability in the plans from the most recent plan valuation; Unioni is the percentage of state and local workers in state i that are unionized as estimated from the March 2009 CPS; Social Securityi is the percentage of state and local workers in state i who are covered under Social Security with rates taken from a report by the U.S. Senate Special Committee on Aging (2010, p. 13); Pubwage/Privwagei is the ratio of average wages paid to state and local workers in 2008 to the average wage of private sector workers as derived from the March 2009 CPS; RelWageGrowth is the change in the ratio of public wages to private wages from 1998 to 2008; GDPgrowthi is the rate of growth in real GDP per capita from 1995 through 2005 in the state; Avpay08i is the average pay of workers in the state pension plans from the most recent valuation. The variables that are specifically related to the pension plans were derived from the disclosure data on plans compiled for the project.
It is important to note that the model is not meant to ‘explain’ the generosity of public sector pensions but to provide a convenient way to summarize the data to indicate the correlation of public sector labor market characteristics and government fiscal operations with public pension generosity. In addition, in postulating the theoretical regression function, it is standard to assume that all the model's explanatory variables have a separate or independent influence on the dependent variable. But in any given sample used to test the regression function, some or all of the independent variables may be highly collinear, preventing the model from isolating their individual influence on the dependent variable. While, in theory, collinearity between independent variables does not result in unbiased and inefficient estimates, in practice it may be difficult to isolate that impact of these factors on the replacement rate. As such, three alternate model specifications are provided to better understand the possible collinearity between the independent variables and the robustness of their relationship with replacement rates.
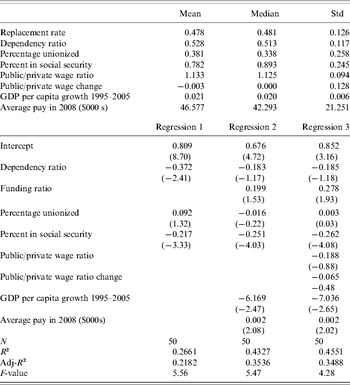
The results of the analysis are presented in Table 3. The top part of the table shows the means, medians and standard deviations for each of the variables. The bottom section of the table reports the results from three estimates based on three separate combinations of the variables considered with the t statistics reported in parentheses.
Factors related to pension replacement rates for state and local workers

Source: Estimated by the author.
Pension costs will be more or less driven by the dependency ratio in relation to plan funding. Under pay-as-you go financing, the pension cost varies in direct proportion to the dependency ratio. If costs vary with the dependency ratio, they can be reduced by providing a less generous benefit. With fully funded plans, cost will not rise as directly with changes in the dependency ratio but a high ratio suggests that tenures under plan coverage might be relatively short. If that is the case, the plan would likely be less generous. So the characteristics of both types of plans suggest that dependency ratios should vary inversely with plan generosity. The results support that expectation, but are statistically significant only in the first regression. The result in that case suggests that a 1% increase in the dependency ratio is associated with a 0.37% lower replacement rate.
If there is economic benefit to funding a pension over running it on a pay-as-you-go basis, the benefit of funding a generous plan would be greater than funding one that is less so. Again, the regression results are consistent with the expectation, but it is only statistically significant in the estimation of the full model. An increase of 1% in the funding ratio is associated with a 0.28% increase in the replacement rate provided.
Because unions tend to favor pensions, the more unionized the public workforce, the more generous the benefits are expected to be. The coefficient in each of the estimations is relatively small and insignificant. In a related analysis, Clark et al. (Reference Clark, Craig, Ahmed, Mitchell and Anderson2009) found the extent of unionization of public employees to contribute positively to plan generosity in 1982 but negatively in 2006. In both cases, the results were statistically significant. Their specification of plan generosity was different from the one used in this analysis. Theirs was based on estimated pension replacement rates for a hypothetical worker with consistent salary and tenure across all states. In sorting out the change in their results from 1982 to 2006, they concluded, ‘Thus it appears that by 2006, having a large share of the state's public sector work force in a union was a proxy for slow population (and economic) growth and finance problems. In short, the union variable may have switched from being an indicator of bargaining strength and larger pension benefits to an indicator of overall economic weakness’.
There should be a strong negative relationship between the share of workers covered by Social Security and the generosity of the public plan benefit. If a worker is not covered by Social Security in public employment, the employer typically designs a standalone plan that would provide somewhat comparable benefits to those provided in tandem to workers covered by both a pension and Social Security. The results are as expected and highly significant and the estimated relationship is consistent across the three model specifications. A 1% higher Social Security coverage rate among a state's public workforce is associated with a 0.22–0.26 lower pension replacement rate.
If pensions are a substitute for wages, the higher the public wage level is relative to private wage levels in the state, the less generous the public pension benefit should be. In fact, the signs on both the public/private wage ratio and the change in that ratio over the 1995–2005 period are negative in the estimation but neither is statistically significant.
Clark et al. (Reference Clark, Craig, Ahmed, Mitchell and Anderson2009) used population growth as an indicator of economic growth at the state level and found a strong and significant relationship with public pension generosity. Here, growth in GDP per capita from 1995 to 2005, was used as the measure of economic growth and anticipated that the relationship would be positive because high growth provides the resources to support richer pensions. The estimates came out the opposite of the expected results and were highly significant and quite substantial. They imply that a 1% increase in growth in GDP per capita in a state was associated with a 6–7% lower public pension replacement rate. Given the strong pattern of private employers moving away from sponsoring generous DB plans for their own workers, it may be that they are also moving away from places where such plans are being offered to anyone.
Plan generosity is expected to increase as average pay rises because pensions generally integrate implicitly or explicitly with Social Security. Since the latter is redistributive toward lower earners, pension benefits are expected to be more generous at higher earnings levels. The resulting estimate came out as expected and was statistically significant but only suggests that a $1,000 of added average public pay is only associated with an increase of 0.002 in the replacement rate under the public plan offered.
7 Looking forward
There is some sentiment and sketchy evidence that public pensions tend to be enhanced during economic good times. In 1999, when the stock market was approaching an all-time peak, California significantly improved its public pensions (Bornstein et al. Reference Bornstein, Markuze, Percy, Wang and Zander2010). In 2006, Maryland teachers benefit accrual rate was increased by nearly 30% and made retroactive to 1998 (Maryland State Education Association, http://www.mstanea.org/political/pension_a5.php/). In New York that year, the legislature passed at least 36 bills increasing benefits (Manhattan Institute for Policy Research, http://www.empirecenter.org/Special-Reports/2006/06/defusing_new_yo.cfm). Whatever the reason, plan generosity has increased over the years. Clark et al. (Reference Clark, Craig and Sabelhaus2010) estimate that replacement rates increased an average of 10% or so between 1982 and 2006 for workers covered under public plans who retired with 30 years of service. In addition, the ages at which unreduced pensions are payable has declined as well or the actuarial reductions for early-retirement benefits have been reduced.
The impression today that many states have offered richer retirement benefits than can be justified on the basis of competitive pay levels with the private sector appear to have some justification. That the benefits have become more costly than some states and their contributing subunits can afford is undeniable. The protections for benefits, in many cases, suggest these problems may persist for a long time. The problem is that benefit accrual rates are considered contracts or property rights by many states. The protections go beyond accrued benefits in many states because the pension offered to an employee cannot be modified as long as that individual remains with the government (Monahan, Reference Monahan2010). That means 20-year-old workers today will continue to be covered by retirement provisions that the jurisdictions have already determined are beyond their budgetary capacity.
The requirements to provide benefits that workers have accrued are important in understanding current plan obligations. More important is the legal claim current workers have on future accruals that may dramatically limit the options policymakers face in modifying public pensions. It is unlikely that many publicly elected policymakers will risk the criticism aimed at the private decision makers who have curtailed pension benefits. But the pension claims on future budgets may become so large in some cases that it will be impossible to sustain plan generosity for young workers over the remainder of their careers.
Policymakers in several states have begun to review public pension policies. The idea that state and local lawmakers cannot change their pension plans defies the economic realities that have forced private employers to address plan design issues to control costs at sustainable levels. Some states have moved to modify pension promises but have done so only for future employees. Undoubtedly, real legal restrictions are one explanation for the lack of adjustment to existing systems for current employees. At some juncture, however, budgets may become so binding that policymakers will have to curtail future accruals for existing workers. There are many ways that accrued benefits can be protected if the structure of existing plans is modified or accrual rates are modified on a prospective basis.
In contemporary policy discussions, one option for dealing with long-term public pension costs that seems to be gaining some credence is for those jurisdictions whose workers are not covered by Social Security to bring such workers under the national system's coverage as part of a package of bringing the state pension systems into balance. Rauh suggests that this as a ‘compensating differential’ for freezing benefits at current levels for workers not covered by Social Security. The state legislature in Maine is seriously considering such an option as part of pension reform on its agenda in the summer of 2010 (Walsh, Reference Walsh2010). There are many reasons that all U.S. workers should be covered under Social Security but expanding coverage to workers now outside the system is not a way for public plan sponsors to save money.
It is well known that mature retirement systems that are financed on a pay-as-you-go basis are inefficient over time. While Social Security is arguably partially funded, it is mostly financed on a pay-as-you-go basis. A system that is redistributive, like Social Security, will be even more inefficient as a retirement savings vehicle for workers with above-average earnings. There may be some question as to whether public sector workers receive comparable pay to private sector workers; there is no question that average public pay is higher than that in the private sector. Putting workers now outside the system into Social Security will mean that those individuals affected and their employers will have to contribute more to purchase those benefits over the long term than the benefits from existing systems.
If policymakers can freeze existing pensions and not offer a replacement plan, as Rauh (Reference Rauh2010) suggests, moving workers into Social Security may reduce pension costs but it would substantially reduce pensions for affected workers. If policymakers offer workers a replacement plan that in conjunction with Social Security roughly matches their existing stand-alone systems, there cannot be long-term saving. It is hard to fathom how Social Security coverage can be more efficient for any uncovered state and local government workforce than the existing systems at current levels of funding even if inadequate. The demographics for efficient operation of retirement systems financed on a pay-as-you-go basis no longer exist and are unlikely to reappear in the future.
In most cases, state and local governments operate on some sort of balanced budget requirement. Yet, for years debate over public pension financing has been carried out in many states. In some, the advocates of full funding have prevailed because they have focused on pension costs from an accrual perspective. Whether or not the balanced budget rules applied to pension financing, these states have stuck with the spirit of the balanced budgeting in their view of financing pension commitments. In other cases, the focus has been more influenced by current cash flow considerations and financing of pension liabilities has been pushed to future generations. Policymakers who have taken this route have often benefited from the lack of public understanding of the ramifications of their actions.
The evidence from the private sector suggests that adopting standardized accounting rules led to profound effects on employer-sponsored retirement plans. The changes were not instantaneous but were driven by a growing awareness of the implications of contemporary decisions on future obligations. It may be premature to suggest that recent GASB disclosure requirements will have the same ultimate effect on public retirement systems as the disclosure requirements did in the private sector, but there is some evidence that a new order is already emerging. If the shift toward DC plans in states such as Alaska, Florida, Michigan and others continues, the effects of public disclosure are likely to prove the most profound change to public pension policy that has occurred in decades.