Recently, political scientists have taken notice of the role of personality in political behavior. The five-factor, or “Big Five,” model has been applied widely in the behavior literature to the study of participation, ideology, and vote choice (e.g., Caprara et al. Reference Caprara, Schwartz, Capanna, Vecchione and Barbaranelli2006; Gerber et al. Reference Gerber, Huber, Doherty, Dowling and Ha2010; Mondak et al. Reference Mondak2010; Gerber et al. Reference Gerber, Huber, Doherty and Dowling2011a). This model decomposes individual personality into five traits—Openness to Experience, Conscientiousness, Extraversion, Agreeableness, and Emotional Stability. Though growing rapidly, this literature has eschewed a focus on elite behavior. This is unfortunate, as the study of personality among the public has yielded many findings linking personality to ideology (Jost, Nosek and Gosling Reference Hornik, Buchta and Zeileis2008; Gerber et al. Reference Gerber, Huber, Doherty, Dowling and Ha2010), political information (Gerber et al. Reference Gerber, Huber, Doherty and Dowling2011b), civic engagement (Mondak et al. Reference Mondak2010), and many other dynamics important to the political sphere. Indeed, while personality is related to ideology and other factors that predict behavior, it offers predictive power above and beyond these more traditional measures.
A key reason for the lack of focus on elites is that measuring elite personality is more problematic than it may seem at first, as most political science applications involve surveys (Caprara, Barbaranelli and Zimbardo Reference Caprara, Barbaranelli and Zimbardo2002; Gerber et al. Reference Gerber, Huber, Doherty and Dowling2011a). While useful, these studies tell us little about the traits of elites. One solution might be to survey legislators, but this approach would prevent us from being able to study the deceased and would be difficult to perform for retired legislators. Moreover, even if we restrict ourselves to the contemporary legislative period, most legislators would be unwilling to participate, and any responses would likely be subject to selection bias and strategic decisions. Indeed, to our knowledge, only one study has attempted to apply survey-based inventories with legislators (Dietrich et al. Reference Dietrich, Lasley, Mondak, Remmel and Turner2012).Footnote 1 Response rates were low—ranging from 17 to 26 percent. These rates, coupled with the inability to get estimates for past time periods, have prevented scholars of behavior in institutions from incorporating personality into their analyses.
In this paper, we present a method for measuring elite personality without surveys. Drawing on recent advances in machine learning, we measure legislator personality using floor speeches, estimating Big Five personality traits for all incumbent members of the US House from 1996 to 2014. We show that these estimates parallel findings in the behavior literature linking personality with ideology (Jost, Nosek and Gosling Reference Hornik, Buchta and Zeileis2008; Gerber et al. Reference Gerber, Huber, Doherty, Dowling and Ha2010) and that they are robust to authorship and speechwriting effects. We then use our estimates to shed light on the propensity of legislators to respond to surveys. While perhaps uninteresting on its face, our results suggest the propensity to respond is a function of personality, and that attempting to measure elite personality using surveys will result in selection bias. Finally, we provide one example of the empirical utility of these estimates and examine the relationship between personality and the types of bills legislators propose.Footnote 2
Measuring Personality: From Speeches to Scores
Given the aforementioned issues with survey-based measurement of personality, studying the role of personality in legislator behavior—or, more generally, elite behavior—requires a method different from direct surveys. We therefore draw on a recent literature in machine learning that uses traditional psychometric personality inventories in conjunction with written texts and auditory transcriptions to train predictive models for personality (Mairesse et al. Reference Lowe and Benoit2007; Mairesse and Walker Reference Kuhn and Tucker2008; Schuller et al. Reference Rubin2013). In a foundational piece in this literature Mairesse et al. (Reference Lowe and Benoit2007) develop a widely applicable method for generating personality estimates from speech and text. Using Pennebaker and King’s (Reference Neale1999) corpus of nearly 1.9 million words from laboratory experiments, and Mehl, Gosling and Pennebaker’s (Reference Mairesse, Walker, Mehl and Moore2006) corpus of ~100,000 words from recorded conversations, Mairesse et al. (Reference Lowe and Benoit2007) train several machine learning models to predict personality traits. Machine learning methods are a class of models that seek to predict an observed output with optimal combinations of features. The models are “trained” on a subset of data and the estimates are used to predict the rest of the data using only right-hand-side variables. An example would be to perform a linear regression of some variable y on a matrix X of covariates for a fraction of a sample of data. Then, the coefficients β estimated using the “training” set would be validated by predicting y using only the X for the unused part of the sample.Footnote 3
As mentioned, Mairesse et al. (Reference Lowe and Benoit2007) use written and spoken language to predict personality traits, which are measured by independent observers and self-placement.Footnote 4 Crucial for our purposes, words are categorized according to Pennebaker, Francis and Booth (Reference Ozer and Benet-Martinez2001) Linguistic Inventory and Word Count (LIWC) dictionary (2001 edition), as well as Coltheart’s (Reference Coltheart1981) MRC Psycholinguistic Database (MRCPD).Footnote 5 Doing so allows scholars to generalize to domains beyond the confines of the laboratory. Both the LIWC and MRCPD search for linguistic features in texts, such the number of second person pronouns, punctuation, six letter words, and more. After processing the data using these dictionaries and reducing the spoken and written text to a collection of linguistic features, Mairesse et al. (Reference Lowe and Benoit2007) train several machine learning algorithms on the data.Footnote 6 They find Support Vector Machines for Regression (Shevade et al. Reference Saucier and Goldberg1999; Smola and Schölkopf Reference Sigelman2004; Bishop Reference Bishop2006; Hastie, Tibshirani and Friedman Reference Hall2009)—hereafter referred to as SMOreg—best recovers personality measures in written trials.Footnote 7 Thus, we use SMOreg in the analyses that follow.Footnote 8
Using Mairesse et al.’s (Reference Lowe and Benoit2007) pre-trained SMOreg model, our goal is to predict the personality traits of members of Congress. However, applying this approach to Congress requires texts to feed to the models. To that end, the most systematic data available are speeches made on the floors of the House and Senate, which can be found in the Congressional Record. Though there exist concerns with using these data, as legislators might use floor speeches to strategically convey their policy preferences, constituency preferences, or (remote, but possibly) personality or leadership profiles, we show below that our measures of personality, while correlating with Common Space ideological scores (and generally in the expected directions), explain only a small fraction of the variance, suggesting personality is not equivalent to ideology and our estimates have meaning independent of it. As for the third concern, this is only a problem if legislators try to convey “fake” profiles. Relative to one-time self-administered personality surveys, the Mairesse et al. (Reference Lowe and Benoit2007) method should result in more accurate profiles, as it will be harder to maintain a “fake” profile over the course of a career than over the span of a short survey. Nevertheless, this effect would simply attenuate our results. Furthermore, if some legislators were speaking sincerely and others strategically, further attenuation would occur, and our estimates would have little predictive power.
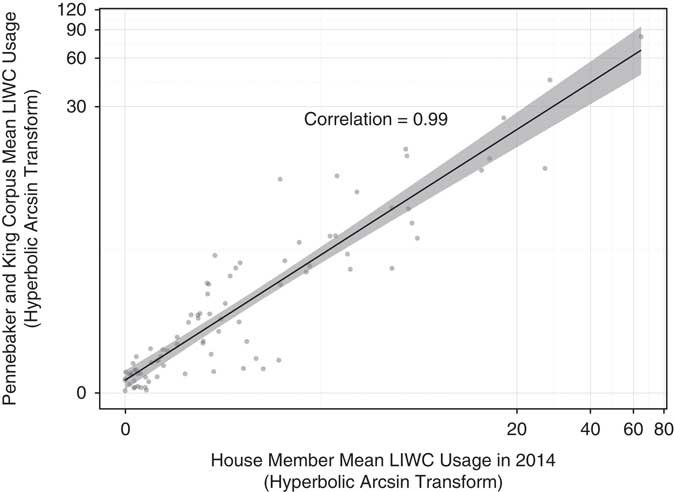
Last, we might be concerned that the subject matter reflected in the Pennebaker essay corpus might not map well to legislator floor speeches. Specifically, the kinds of words used by laboratory participants are almost certainly different from those employed by legislators in their floor speeches. To assess this concern, Figure 1 plots the mean LIWC category usage from the Pennebaker data against the mean usage of members of the 114th House of Representatives.Footnote 9 Each point represents a LIWC category; a version of this plot with category labels in found in the Online Appendix. As we see, there is a close correspondence between the two; the correlation on the untransformed scale is ~0.99. Additionally, the τ B rank correlation coefficient for the rank orderings across the two is 0.72 (p<0.001). Thus, while the subject matter of the texts are different, legislators’ usage of the various categories does not differ substantively from the laboratory essay writers.Footnote 10
Comparing Linguistic Inventory and Word Count (LIWC) (Reference Ozer and Benet-Martinez2001) usage between the Pennebaker corpus and floor speeches

As none of these concerns seem to be particularly damning, we apply Mairesse et al.’s (Reference Lowe and Benoit2007) SMOreg model to the corpus of every legislative speech by every sitting member of the House of Representatives in the 104th–113th Congresses (1996–2014). The procedure is as follows:
1. For each set of speeches by a given legislator in a fixed time span (in our case, by year, though Congress-level estimates can be similarly estimated), process the raw text through LIWC and MRCPD to get counts of word usage across all LIWC and MRCPD categories.Footnote 11
2. Once all speeches have been processed for the given span, feed the directory of texts through the Mairesse et al. (Reference Lowe and Benoit2007) models in corpus mode. Specifically, all LIWC and MRCPD features are standardized and then fed in to the standardized SMOReg models. Though we showed above that the category usage of the training (essay) sample is substantively similar to the legislator sample, using the standardized models offers additional leverage on estimating the personality traits within the legislative domain.
3. The output from Step 2 (Big Five estimates for each legislator) is saved and the process is repeated for as many years as there are available.
4. (Optional correction) A legislator i’s personality on dimension d in year t=1, 2, …, T i (T i is the number of years in which legislator i served) is rescaled as the jackknifed average of his/her personality estimates on that dimension for all years except t That is,
 $$\tilde{\theta }_{{it}}^{d} \,{\equals}\,{1 \over {T_{i} {\minus}1}}\mathop{\sum}\limits_{t'\,\ne\,t} \hat{\theta }_{{it'}}^{d} $$
Footnote
12
This ensures that personality trait estimates in session t are not corrupted by language associated with particular actions in that session (e.g., legislators that cosponsor more might be perceived as more Agreeable, not because they cosponsor more legislation per se, but simply because the act of cosponsorship inherently entails using Agreeable language).Footnote
13
In short, this correction alleviates concerns of endogeneity.Footnote
14
5. To generate measures of uncertainty, we follow Lowe and Benoit (Reference Küfner, Back, Nestler and Egloff2011) in using a sentence-level bootstrap. Specifically, suppose legislator i utters N it sentences in time period t. For all i, we resample from the set of their sentences N it times with replacement (Efron and Tibshirani Reference Efron and Tibshirani1994). At the year level, we conduct 100 bootstrap replications/member and compute the empirical 95 percent confidence interval.Footnote 15 To measure uncertainty in the jackknifed estimates, we take the legislator’s estimates by year across each of the 100 bootstraps, calculate the jackknife per Step 4 (if desired), and then compute the 95 percent confidence interval.Footnote 16

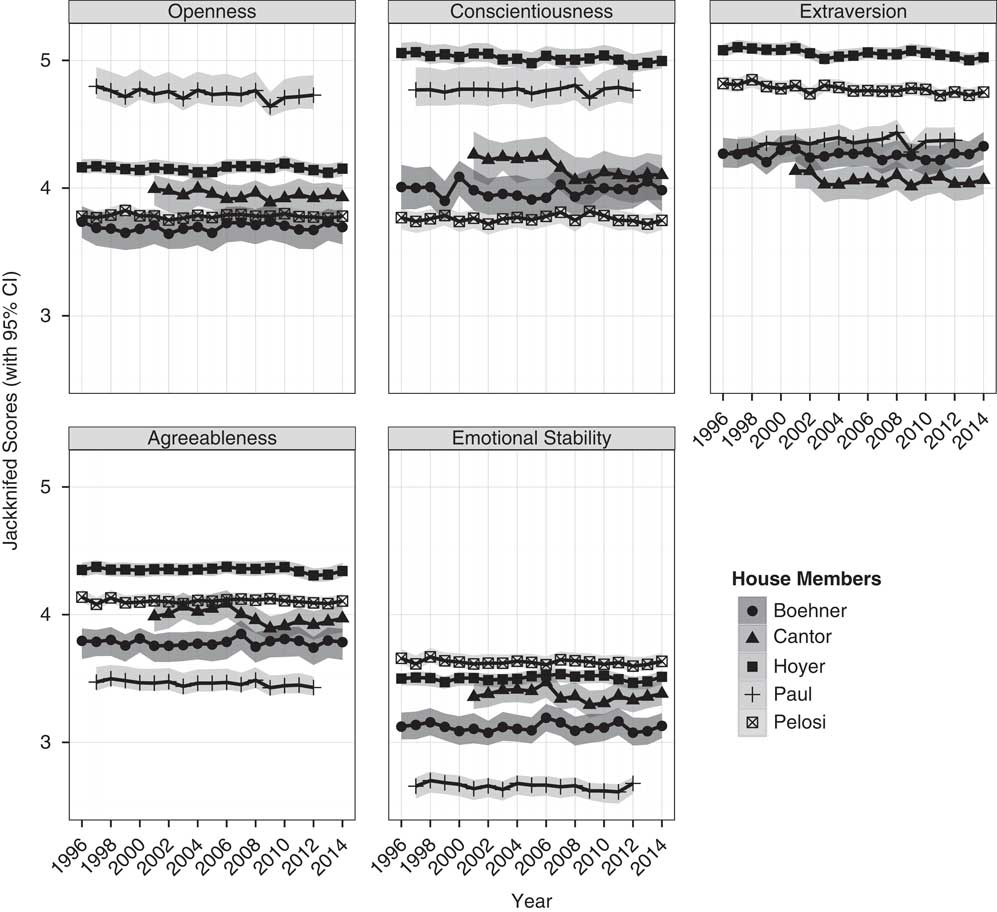
Importantly, we are agnostic as to whether our personality scores are measures of “sincere” legislator personality. Like with ideal point estimates based on roll calls, we simply consider these estimates as revealed and potentially strategic preferences. Estimates of the traits and confidence intervals are presented for key House members in Figure 2. The scale for each trait ranges from 1 to 7. As we see, the estimates are stable and precise, despite the fact that only single Congresses—as opposed to the entire corpus—were used at any one time during the estimation process.
House scores over time (selected members) Note: CI=confidence interval.

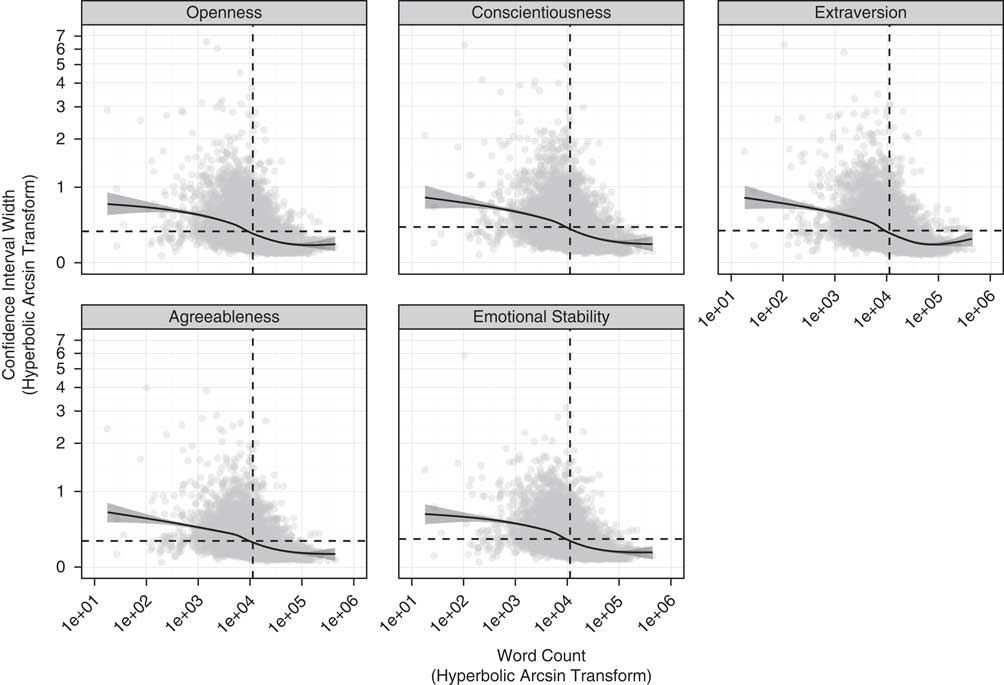
Additionally, Figure 3 presents the relationship between word count and confidence interval width. The median member utters around 11,000 words/year. Once the word count exceeds about 5000 words, the confidence interval width is about 0.3 or less, meaning the 95 percent interval is the point estimate ±0.15 on the seven-point scale. Thus, the estimates are relatively precise for the vast majority of legislators. Moreover, the estimates make intuitive sense. Former Representative Ron Paul (R-TX) is significantly more Open and less Emotionally Stable than the rest of the legislators in this subsample. Representative Paul’s out-of-the-box libertarian ideology and his frequent diatribes against the status quo politics embodied by the two major parties are in line with common characterizations of both of these traits (McCrae and John Reference Mairesse and Walker1992; Jost, Nosek and Gosling Reference Hornik, Buchta and Zeileis2008). That said, our main goal in Figure 2 is not necessarily to make any claims about the personalities (either relative or absolute) of any particular members of Congress. Rather, we simply want to show that the scores are stable over time and not subject to great deals of uncertainty. Indeed, at the present time, more stringent forms of validation are not yet possible; as we have mentioned earlier, previous efforts to ascertain the personalities of legislators via more traditional personality inventories have resulted in low response rates and high levels of clustering at the “more desirable” ends of each scale (Dietrich et al. Reference Dietrich, Lasley, Mondak, Remmel and Turner2012). Whether this clustering reflects the desire of legislators to make themselves look more appealing to constituents or the natural self-selection of certain personality types into elected office has not yet been determined.Footnote 17 Additionally, as we show later, personality traits themselves help explain the rate of response to less intrusive surveys that ask about policy preferences; the relationship between personality and the rates of response to personality inventories would almost assuredly be stronger, especially given the more intrusive nature of the latter. All that aside, we can perform some more indirect tests of validity, which we discuss in the following section.
Word count and precision Note: Points are individual members. The smoothed line is a loess-smoothed trend. The vertical dashed lines are the median member’s word count (~11,000 words/year). Horizontal dashed lines are the average confidence interval width (~0.35). Thus, most members’ personality estimates are their point estimates ±0.175.

Validity Checks
Strategic Concerns
We acknowledge legislators may have incentives to misrepresent their “true” personality traits and adopt false personas. In this case, their behavior and language would be affected as well. While we acknowledge this concern as a serious issue, based on the evidence currently available, we do not believe it is a serious impediment to the measurement of legislators’ beliefs and/or preferences, as exhibited through the Big Five personality traits.
Indeed, a common objection to the standard NEO-PI-R personality inventory (Costa and McCrae Reference Costa and McCrae1992) is that the “desired” trait or answer is transparent. Critics of the inventory argue the average respondent would certainly prefer to think of him or herself as extraverted rather than introverted, emotionally stable rather than neurotic, agreeable rather than selfish, conscientious rather than lazy, and open to experience rather than insular. This concern appears to gain support from personality inventories administered to state legislators (Dietrich et al. Reference Dietrich, Lasley, Mondak, Remmel and Turner2012), as the responding legislators’ responses are substantially skewed toward these “favorable” personality trait values, suggesting personality traits serve as valence characteristics.
Indeed, legislators may consciously adopt speech patterns in order to signal these valence characteristics. There are likely many verbal cues that both indicate personality types to legislators and voters, and are known to all and can be voluntarily suppressed or performed insincerely. However, we also assume there exists some subset of these cues tied to personality, which are unknown to legislators, but may be captured by the personality recognizer described above.
We suppose legislators also have unconscious verbal cues that signal personality and that the algorithm can read them. In that case, it is in the interests of legislators to misrepresent their personalities by appearing to hold personality trait values as favorable as possible throughout their public speech. While all known cues should be utilized to develop valence trait values, the unknown subset of cues should exhibit variation as legislators are simply unaware of their link with personality. Combining these known and unknown subsets of speech elements should result in measures that appear skewed toward the valence characteristics, but with substantial variation reflecting the true variation in the underlying trait values.
Face Validity
Theoretical concerns aside, it is important to ensure our estimates have some degree of face validity. Traditionally, personality psychologists have relied on surveys to develop measures on the Big Five dimensions. However, as we note above, surveying current and former federal legislators is not likely to yield adequate responses given the difficulty other scholars have faced in reaching currently serving state legislators. Therefore, we will instead rely on more indirect validity checks based on associations repeatedly uncovered in the literature. Our analysis here will focus on the relationship between personality and ideology.
As mentioned, much recent research has focused on the relationship between personality and partisan attitudes (Gerber et al. Reference Gerber, Huber, Doherty, Dowling and Ha2010; Mondak Reference McCrae and John2010; Gerber et al. Reference Gerber, Huber, Doherty and Dowling2011a). Strong and consistent relationships have been uncovered between ideology and Openness, Conscientiousness, and Emotional Stability, with the former being associated with liberalism, and the latter two associated with conservatism. Effects for the other two traits are more mixed; Mondak (Reference McCrae and John2010) finds no relationship between Extraversion and ideology, and only a weak—and inconsistent—relationship between Agreeableness and liberalism. Gerber et al. (Reference Gerber, Huber, Doherty and Dowling2011a) find the same relationships between ideology and Openness, Conscientiousness, and Emotional Stability. Moreover, they find no relationship between Agreeableness and self-reported ideology, but uncover divergent relationships between Agreeableness and economic attitudes, and Agreeableness and social attitudes; more Agreeable people are more economically liberal and socially conservative. Finally, they find a positive relationship between Extraversion and conservatism, though the relationship is weaker than those between ideology and the other four traits. Similarly, Gerber et al. (Reference Gerber, Huber, Doherty, Dowling and Ha2010) find consistent relationships between ideology and Openness, Conscientiousness, and Emotional Stability in the same directions, but the other relationships are more nuanced.
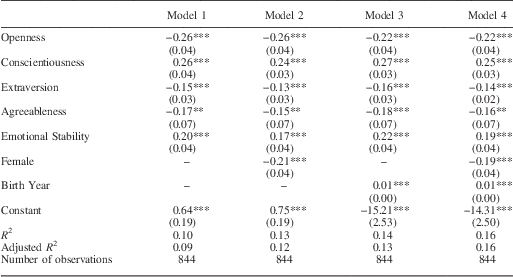
Nonetheless, we can use these findings to perform an indirect test of the validity of our estimates. Using Common Space (Poole and Rosenthal Reference Pennebaker and King1997) scores, we can examine the direction of the relationships between the Big Five traits and ideology. From these findings, we should expect a negative relationship between Openness and the Common Space score, and positive relationships between Conscientiousness, Emotional Stability, and the Common Space Score. Additionally, as Common Space scores tap into the underlying economic conflict between the two dominant parties (roughly approximate to the contemporary liberal-conservative dimension), we should find a negative relationship between Agreeableness and the Common Space score (Poole and Rosenthal Reference Pennebaker and King1997; Crespin and Rohde Reference Crespin and Rohde2010).Footnote 18 Finally, the literature is much more mixed on the relationship between ideology and Extraversion; as such, we remain agnostic regarding the expected sign (or significance). Table 1 presents several ordinary least squares (OLS) models of ideology as a product of personality (as measured by the lifetime means of each trait) and demographic traits.Footnote 19
Ordinary Least Squares Models of Personality and Common Space Scores (1996–2014)

Note: Standard errors in parentheses.
Two-tailed tests: ***p<0.01, **p<0.05, *p<0.1.
All four traits with expected relationships have statistically significant coefficients in the expected directions in each model. Additionally, in line with previous literature, the coefficients on Extraversion are of smaller magnitudes than those for the other traits, and this holds for all four models (though the relationship between ideology and Extraversion is still a point of contention). Moreover, these results allay one natural concern with using potentially ideologically-tinged legislative speeches to estimate personality, in that our personality estimates may be simply summaries of legislator ideology. However, our model R 2s in Table 1 are not large, even when controlling for the additional demographic variables, suggesting personality traits alone do not account for large proportions of the variance in ideology.Footnote 20 All together, the results are in line with expectations from the literature (Jost, Nosek and Gosling Reference Hornik, Buchta and Zeileis2008; Gerber et al. Reference Gerber, Huber, Doherty, Dowling and Ha2010). Specifically, Jost, Nosek and Gosling (Reference Hornik, Buchta and Zeileis2008) find that while there are correlations between the Big Five and ideology, the magnitudes of these are not large. Our model R 2 is very much consistent with this finding. This suggests whatever theoretical concerns one might have about the dependence of the Big Five on ideology or the ideological content of the legislative record are, in practice, not a problem.
Personality Traits and Linguistic Features
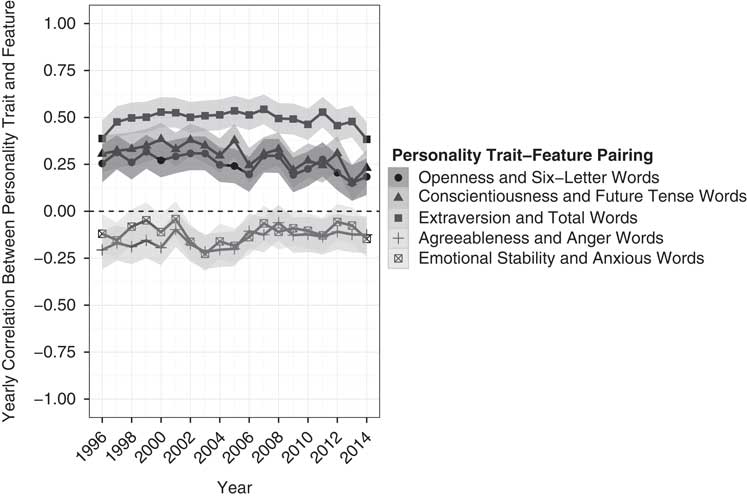
We can also examine the relationships between LIWC/MRCPD features and the estimated personality traits to see if they have face validity. While a full feature exploration is beyond the scope of this paper due to reasons of length (as there are over 80 features), we can examine the stability of selected relationships. To wit, Figure 4 presents the yearly correlations between the Big Five and one feature per trait.Footnote 21 The correlations are remarkably stable over time and generally are distinct from 0 at the 95 percent level.
Correlations between personality traits and selected Linguistic Inventory and Word Count features

However, as the LIWC/MRCPD traits are used in the estimation of the personality traits, it is not surprising that they are relatively stable over time. What is more important is that these relationships make sense. As Openness is associated with intellectual pursuits (Borgatta Reference Borgatta1964; Tupes and Christal Reference Silvester, Wyatt and Randall1992)—indeed, the trait is sometimes referred to as Intellect rather than Openness (Saucier and Goldberg Reference Rubenzer and Faschingbauer1996)—we might expect more Open members to express themselves in more conventionally “intellectual” ways; one rough proxy for intellect is the length of words used (Vetterli and Furedy Reference Verhulst, Eaves and Hatemi1997).Footnote 22 As such, it should be unsurprising that more Open members use longer words at higher rates. Additionally, more Conscientious individuals tend to be more goal-oriented and have greater abilities to engage in delayed gratification (Duckworth, Tsukayama and Kirby Reference Duckworth, Tsukayama and Kirby2013), and should therefore focus on the future and long-term goals more than those who are less Conscientious (Barrick, Mount and Strauss Reference Barrick, Mount and Strauss1993; Ozer and Benet-Martinez Reference Muris, Roelofs, Rassin, Franken and Mayer2006). As Figure 4 shows, this is also supported, as more Conscientious members use future tense words at higher rates. Similarly, more Extraverted members should be more sociable and talkative, and they do speak more in our data.Footnote 23 Additionally, as Agreeableness is almost tautologically at odds with the propensity to anger (Gosling, Rentfrow and Swann Reference Gosling, Rentfrow and Swann2003)—indeed, the TIPI asks respondents if they are “quarrelsome” and the responses are used to code for Agreeableness or the lack thereof—legislators should use angry, off-putting language at lower rates.Footnote 24 This relationship, though weaker than those described above, is also found in our data, and in the expected direction. Finally, as Emotional Stability is “believed to reflect the general predisposition to develop psychological symptoms such as anxiety” (Muris et al. Reference Mondak and Halperin2005, 1106), more Emotionally Stable members should exhibit less outward anxiety; again, this relationship is found in our data, though it is somewhat weaker than those for Openness, Conscientiousness, and Extraversion. Nonetheless, the relationships between the features and the estimated traits are not only stable, but are generally in the expected directions, thus providing additional face validity.
Authorship and Speechwriter Effects
An additional important concern to address is the potential for speechwriting effects. Specifically, as at least some of members’ speeches are written by their staff members, our estimates might be reflective of the writers’ personalities and not those of the Congressmembers. This turns out to be a nonissue for a number of reasons. First, few members have professional speechwriting staff. A cursory look at the House disbursement records demonstrates that, outside of the Speaker and a few key members, speechwriters are simply not hired by most members.Footnote 25 This does not mean that other staffers do not write speeches. However, as staff turnover is notoriously high (Congressional Management Foundation and Society for Human Resource Management 2013), it is reasonable to assume that many staffers would contribute to many speeches and, if so, our estimates should be unstable or clustered for all members. As Figure 2 shows, for some of the highest ranking and/or most prominent members of Congress during our time period, there is marked stability in the jackknifed personality estimates. Perhaps most assuring, neither Pelosi nor Boehner were Speaker at the start of the data, yet the estimates remain consistent. This suggests their speechwriters maintained the same linguistic patterns over time.
Indeed, the Congressional Research Service admonishes those individuals charged with speechwriting for Congressmembers to make every effort to mimic the language and diction of the member for whom they are writing (Neale Reference Mondak, Hibbing, Canache, Seligson and Anderson1998):
Congressional speechwriters should make every effort to become familiar with the speaking style of the Member for whom they are writing, and adjust their drafts accordingly.
These results somewhat contradict those of Sigelman (Reference Shevade, Keerthi, Bhattacharyya and Murthy2002), who argues that President Reagan’s revealed persona was different in ghostwritten and off-the-cuff remarks. However, he notes that while differences exist between Reagan with speechwriters and Reagan without speechwriters, they are simply variations on a theme. As presidents have arguably the most incentive and ability to shape their public personalities, and the difference is still minimal, there should be even less of an effect for members of Congress. This is precisely what we observe.
Speeches Versus Surveys
Despite the advantages proffered by the speech-based approach, there may be circumstances in which a survey-based approach might be preferable, at least for contemporaries. Indeed, surveys might be preferable for these types of legislators if they were perfectly responsive. However, missingness would not necessarily be a problem, as personality traits could conceivably be imputed using existing algorithms (e.g., Rubin Reference Ramey, Klingler and Hollibaugh1987; Gelman, King and Liu Reference Gelman, King and Liu1998). For example, this is a potentially appealing route, as this would allow us to recover estimates for those who did not respond. However, this approach has limitations. Most important for our purposes here is that the missingness must obey the so-called missing at random (MAR) assumption, which is satisfied if missingness can be modeled as a function of observed data.Footnote 26 A canonical example of this sort of missingness is the case of high wage earners who fail to report their income in surveys. While the income may be unobserved, several known correlates (e.g., education) are not missing. By conditioning on these observed values, we may model missingness using existing algorithms. However, if the missing observations cannot be predicted from observed covariates, MAR is not satisfied and multiple imputation is no longer an option (Weisberg Reference Vetterli and Furedy2009).
This is most problematic if the missingness is in part due to personality. In these cases, missingness is a function of the underlying latent traits the surveys seek to recover, and several characteristics that help predict missingness are themselves missing. Therefore, imputation cannot be used with any degree of certainty. Moreover, the distribution of responsive legislators is subject to selection bias, and any inferences drawn from these data will themselves be problematic. Using predicted values from Heckman (Reference Hastie, Tibshirani and Friedman1976) selection models will not suffice either, as important covariates that predict selection into the sample (i.e., personality traits) will be missing.Footnote 27
To check whether this is potentially a problem, we examine the relationship between our personality scores and response rates to the National Political Awareness Test (NPAT), a survey developed by Project Vote Smart that asks candidates for congressional elections to provide answers to a series of political issue questions.Footnote 28 This survey has received a great deal of attention by political scientists and has been used to estimate the ideology of legislators and candidates (e.g., Ansolabehere, Snyder and Stewart Reference Ansolabehere, Snyder and Stewart2001; Shor and McCarty Reference Schuller, Steidl, Batliner, Burkhardt, Devillers, Muller and Narayanan2011; Battista, Peress and Richman Reference Battista, Peress and Richman2012). Response rates to the NPAT are higher than those from previous (anonymous) studies of personality, presumably because the NPAT questions ask about policy positions, which are more in line with the roles played by legislators, as opposed to the more personally intrusive personality surveys. However, both types of surveys have potential consequences for giving the “wrong” response. As Dietrich et al. (Reference Dietrich, Lasley, Mondak, Remmel and Turner2012) rightly note about their surveys, “respondents may have been concerned about social desirability, leaving them unwilling to admit to possessing certain traits” (201). Similarly, Project Vote Smart notes that “[m]ost candidates, fearing their opponents might use their positions in attack ads, refuse or only respond to a few questions that their consultants stamp as safe.”Footnote 29 Indeed, this attitude is institutionalized within the major party leadership; in 2006, a Democratic leader in the Florida House of Representatives told a Wall Street Journal reporter that “We tell our candidates not to do it. It sets them up for a hit piece” (Grant Reference Weisberg2006).
We therefore estimate a series of logistic regression models where the dependent variable equals 1 if the member in question ever responded to the NPAT, and 0 otherwise. This is arguably a very low bar, and therefore biases against finding significant results, as we minimize the amount of variance in the dependent variable. Thus, significant results should provide strong evidence of a relationship between personality and nonresponse. Independent variables include all personality traits, as well as host of other demographic information on legislators. These include dummy variables for gender (Female), region (South), whether or not legislators are Leaders, and whether or not they are in the Majority Party. Additionally, we control for district partisanship (Democratic Normal Vote), Seniority, electoral vulnerability (Legislator Voteshare in the last election), and Ideological Extremism (absolute value of their DW-NOMINATE score). Because we are estimating the likelihood of ever responding to the NPAT, each member has but one observation in our data; as such, the independent variables are actually set to the Congressmember-level means.Footnote 30
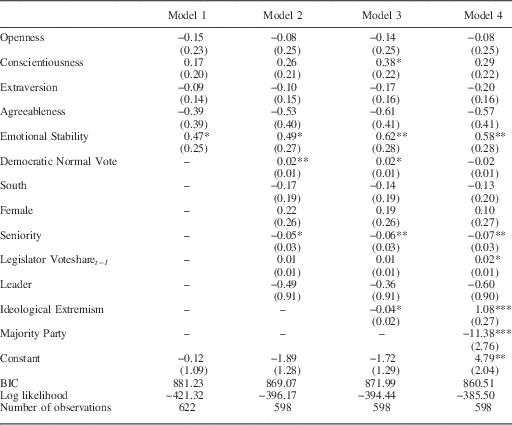
As Table 2 shows, the propensity of nonresponse is a function of personality.Footnote 31 Perhaps most notably, Emotional Stability is positive and significant at conventional levels at all models, regardless of which controls are included. This finding provides strong evidence that the propensity to respond to surveys on which social desirability may be a factor is at least in part a function of personality traits.Footnote 32 Given that Dietrich et al. (Reference Dietrich, Lasley, Mondak, Remmel and Turner2012) note that social desirability likely plays a role in the decision to respond (and, perhaps more worryingly, the revealed traits conditional on response), we have every reason to believe that data gathered through survey methods alone are inappropriate for investigating the relationships between personality traits and elite behavior.
Predicting Response to the National Political Awareness Test At Least Once

Note: Standard errors in parentheses. Observations are pooled by Congressmember.
BIC=Bayesian information criterion.
Two-tailed tests: ***p<0.01, **p<0.05, *p<0.1.
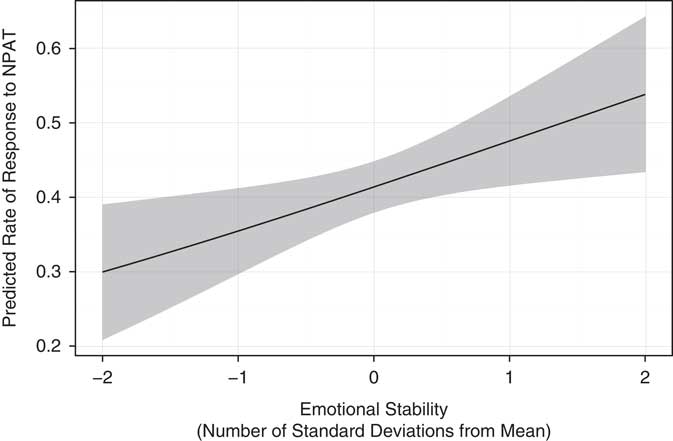
Figure 5 makes these effects even clearer. In this figure, we plot the predicted probability of NPAT response varying Emotional Stability while holding other variables at their means (using the results from Model 4 in Table 2). As we see, increasing Emotional Stability from 2 SD below its mean to 2 SD above increases the predicted probability of response from about 30 to about 53 percent. This increase is enormous and suggests estimates of personality from surveys of elites are highly susceptible to personality-induced selection bias.Footnote 33 , Footnote 34 The effect would almost certainly be stronger if we were modeling the rates of nonresponse to personality inventories, given that they are more personally intrusive than policy-specific surveys like the NPAT and do not offer legislators the ability to take policy positions on important issues of the day. Therefore, more indirect measures of recovering legislators’ personality traits are necessary. At its heart, that is the raison d’être for the text-based method presented here.
Probability of responding to the National Political Awareness Test (NPAT)

An Empirical Application: Personality and Symbolic Bill Proposals
Finally, we present a substantive application of these scores to the legislative domain—determining the types of bills legislators propose. Do they propose symbolic bills intended to rename post offices after local figures, or substantive bills geared toward effecting major policy changes? Different types of bills should reflect different underlying goals and should also require varying degrees of effort to successfully shepherd through the legislative process. However, different types of bills also face different hurdles, and more substantive bills are at greater risk of being prevented from reaching the floor due to partisan concerns (e.g., Aldrich Reference Aldrich1995; Cox and McCubbins Reference Cox and McCubbins2005). Given these hurdles, we expect more Conscientious legislators to propose fewer ceremonial/symbolic bills, as Conscientious individuals are described as having tendencies toward hard work, responsibility, and planning (VandenBos Reference Smola and Schölkopf2007), and they tend to be more driven, goal-oriented, uptight, organized, and have more willpower (Ozer and Benet-Martinez Reference Muris, Roelofs, Rassin, Franken and Mayer2006).Footnote 35 They also tend to exhibit higher levels of performance on work-related and academic tasks (e.g., Barrick, Mount and Strauss Reference Barrick, Mount and Strauss1993; Poropat Reference Pennebaker, Francis and Booth2009), are much more likely to set goals (Barrick, Mount and Strauss Reference Barrick, Mount and Strauss1993), and are also more likely to have high levels of Grit, which is associated with perseverance and the ability to stick to long-term goals (Duckworth et al. Reference Duckworth, Peterson, Matthews and Kelly2007).
Lacking substantive importance, ceremonial/symbolic bills should be less controversial and therefore easier to pass. This suggests more Conscientious members should propose fewer ceremonial/symbolic bills as a proportion of total bills proposed. However, these effects should be conditional on the abilities of members of Congress to get their bills enacted into law; those in the majority should find it easier to have their preferred policies passed by the chamber. Thus, we should expect the effects of personality to interact with majority party status. Members of the minority will have to work harder and expend more effort shaping policy-relevant bills to the liking of the majority; unless they are extremely forward-looking and have immense willpower—that is, unless they are highly Conscientious—they should propose more ceremonial/symbolic bills. More Conscientious members of the minority, however, should be less deterred by the partisan obstacles in their paths—as they place more weight on future payoffs—and should be similar to highly Conscientious members of the majority.
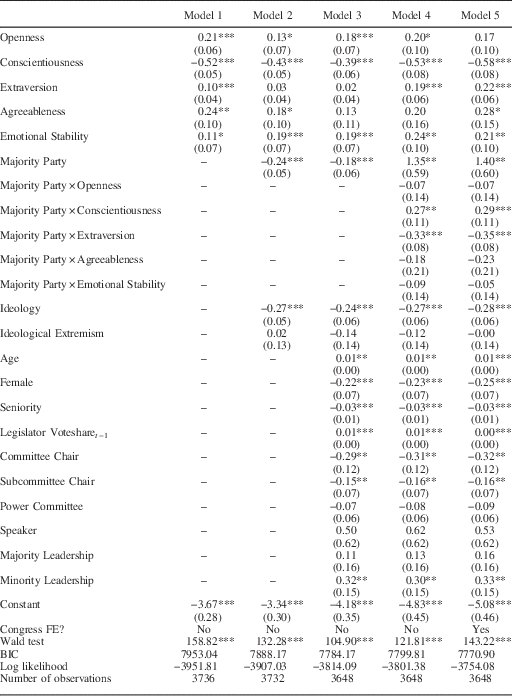
To estimate the importance of Conscientiousness, we analyzed all bills proposed in the House during the 104th–112th Congresses. Each bill was categorized using Volden and Wiseman’s (Reference Verhulst, Hatemi and Martin2014) criteria as being ceremonial/symbolic or of substantive importance.Footnote 36 We then estimated a series of binomial logistic regressions; for these, the proportion of proposed bills that are ceremonial/symbolic in nature is the dependent variable.Footnote 37 The independent variables include our jackknifed personality scores, as well as several other independent variables that might affect the decisions. Ideology is parameterized as the member’s first-dimension DW-NOMINATE score (Poole and Rosenthal Reference Pennebaker and King1997), and Ideological Extremism is the squared first-dimension DW-NOMINATE score. Majority Party is an indicator variable equaling 1 if the member and Speaker are of the same party, and 0 otherwise. Seniority denotes the number of terms a member has served. Legislator Voteshare t−1 denotes the percentage of the vote (on a 0–100 scale) the member received in the election to the current Congress. Committee Chair and Subcommittee Chair are indicator variables equaling 1 if the member served in the relevant role in the Congress under analysis, and 0 otherwise. Power Committee is an indicator variable that equals 1 if the member in question sat on at least one of the three most powerful committees in the House—Appropriations, Rules, and Ways and Means—and 0 otherwise. Finally, we account for the importance of party leadership by including indicator variables for Speaker, Majority Leadership, and Minority Leadership, which are indicator variables equaling 1 if the member served in the relevant role in the Congress under analysis, and 0 otherwise. We account for previously established correlations between personality and personal demographics by including variables for Age and whether or not the member is Female; the former denotes the member’s age at the end of the first session of each Congress, and the latter is an indicator variable equaling 1 if the member identifies as female and 0 otherwise. We also include interactions between personality and Majority Party.
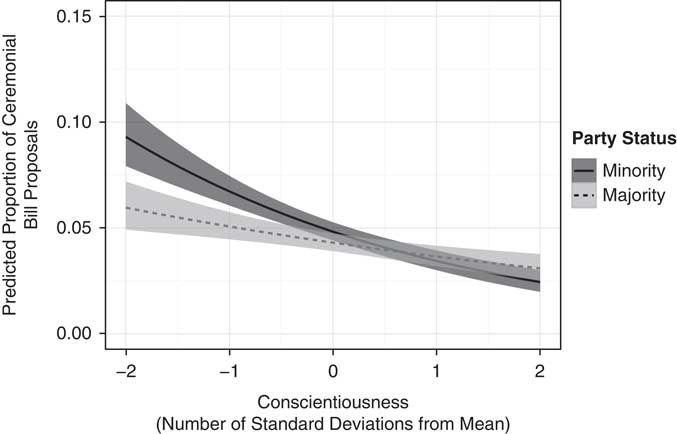
Results are in Table 3, and Figure 6 presents the predicted proportions of ceremonial bill proposals, conditional on Conscientiousness and majority party status, along with 95 percent confidence intervals.Footnote 38 More Conscientious members propose fewer ceremonial/symbolic bills, instead dedicating their energies to more substantive arenas. Moreover, the effect is mitigated by structural factors. For example, Conscientiousness seems to least affect those in the majority—that is, those most likely to see bills they agree with pass without their own influence. These members will be able to free ride on the efforts of the majority party leadership with some assurance that substantive bills with which they agree will come to the floor. Conversely, those in the minority will be more inclined to propose substantive bills—as there will be fewer fellow members of the House on whose efforts they can free ride—so long as they are sufficiently Conscientious.
Conscientiousness and symbolic bill proposals

Personality and Ceremonial Bill Proposals

Note: Standard errors in parentheses. Observations are at the Congressmember level. Null hypotheses for the Wald tests are that all coefficients related to the personality traits are 0.
BIC=Bayesian information criterion.
Two-tailed tests: ***p<0.01, **p<0.05, *p<0.1.
Conclusion
This paper demonstrates measurement of elite personality is possible and that estimates are consistent and robust over time. We have also demonstrated that survey methods for recovering measures of elite personality are problematic at best and that the Big Five do indeed play a role in legislative decisionmaking. The next step, incorporating these measures into theoretically motivated studies of elite behavior, requires careful consideration of how personality fits into standard frameworks of elite decisionmaking. These efforts are underway (e.g., Hall Reference Hall, Frank, Holmes, Pfahringer, Reutemann and Witten2015; Hollibaugh, Ramey and Klingler Reference Heckman2015; Ramey, Klingler and Hollibaugh Reference Poropat2015).
There are several ways in which the methods discussed in this paper may be extended in future work. First of all, while we believe text-based measures of elite personality are more appropriate for the study of legislative behavior than survey-based measures, there are a number of ways in which the strengths of survey-based methods may be used to enrich the project, as discussed above. Additionally, while the Congressional Record corpus is very similar to the Pennebaker corpus on the relevant dimensions, comparable sources are not available for many political elites of interest, including challengers in congressional races. Training a model on alternate text sources (e.g., social media corpora, press releases, etc.) would allow for the estimation of personality for many other actors. Additionally, digitizing the pre-1996 Congressional Record will allow for the estimation of personality traits for a wide variety of historical figures of interest.Footnote 39
This ability to generate measures of personality from speech offers scholars a powerful tool for the investigation of the Big Five personality traits among elites. For the first time, personality scores within the five-factor model are available for virtually all members of the US Congress going back to 1996. With these tools, established findings from personality psychology and the growing literature on personality in political behavior may be applied to develop new theories of legislative behavior. Furthermore, there is an opening for a modeling framework that would allow the Big Five to be incorporated into models of political institutions. The personality scores introduced in this paper now allow the implications of such models to be examined empirically.
In sum, text-based measures of legislator personality make significant improvements over existing measures derived from expert ratings or personality inventories administered through surveys. They represent a significant innovation and serve to fill a critical gap in the burgeoning literature on elite behavior in institutions.