INTRODUCTION
Nitrous oxide (N2O) and carbon dioxide (CO2) are two important greenhouse gases (GHGs) contributing approximately 5% and 60%, respectively to the enhanced greenhouse effect (IPCC, 2007). Agricultural soil is a significant source of atmospheric NO and N2O contributing 65% to the total global emission (Ehhalt et al., Reference Ehhalt, Prather, Dentener, Derwent, Dlugokencky, Holland, Isaksen, Katima, Kirchho, Matson, Midgley, Wang, Houghton, Ding and Griggs2001) and studies consistently reveal that N fertilisation increases their emission (Granli and Bøckman Reference Granli and Bøckman1994; Williams et al. Reference Williams, Hutchinson and Fehsenfeld1992). Nitrous oxide emitted from soil primarily originates from the two microbial processes nitrification and denitrification which are controlled by soil moisture that regulates oxygen availability, and supply of substrates, Denitrifying bacteria need labile carbon (C) compounds as an energy source. To meet the food demand for the growing population, the consumption of synthetic fertiliser N in Asia, is estimated to increase approximately 50% by 2030 (Zheng et al., Reference Zheng, Fu, Xu, Yan, Huang, Chen, Han and Hu2002), which will most likely be accompanied by a proportional increase in N2O emissions. Globally, agricultural N2O emissions increased by nearly 17% from 1990 to 2005 accounting for about 60% of global anthropogenic N2O emissions (IPCC, 2007).
Elevated carbon dioxide (CO2) level in the atmosphere not only improves crop yield due to increased photosynthesis but also influences the biomass partitioning and carbon allocation to the roots. This has a direct bearing on the carbon and nitrogen dynamics in soil and may impact the soil organic matter decomposition, thereby accelerating the soil CO2 and N2O emissions (Sainju et al., Reference Sainju, Jabro and Stevens2006). A common plant response to elevated CO2 is increased deposition of root-derived C into the rhizosphere (Allard et al., Reference Allard, Robin, Newton, Lieffering and Soussana2006). The positive effect of elevated CO2 on the N2O emission is due to increased rhizodeposition of labile C substrates stimulating denitrification (Phillips et al., Reference Phillips, Whalen and Schlesinger2001) and improved soil moisture conditions favouring the microbial transformation of N (Arnone and Bohlen, Reference Arnone III and Bohlen1998).
An earlier study conducted by Patten et al. (Reference Patten, Bremner and Blackmer1980) demonstrated that the rate of denitrification was dependent on the quantity of organic C readily utilised by denitrifying microorganisms, while the organic C in various pools is not completely available to microorganisms. As a specific fraction of soil organic C, the dissolved organic carbon (DOC) represents easily degradable and available to microorganisms (Boyer and Groffman, Reference Boyer and Groffman1996; Yano et al., Reference Yano, McoDowell and Kinner1998).
C4 crops were responsible for 40% (approx. 800 million metric tonnes) of the world's grain harvest in 2006 (USDA-FAS, 2006), which indicates the global significance of future climate change impacts on production from C4 crops. An increase in the atmospheric CO2 from today's ambient CO2 of 385 to the 550 ppm projected for 2050 (IPCC, 2007) will lead to differential effects on C3 and C4 plants. An increase in the ambient CO2 to 550 ppm results in direct stimulation of photosynthesis by 29% in C3 crops. Whereas C4 plants concentrate CO2 around Rubisco to more than five times ambient CO2 in specialised bundle sheath cells, which saturates or nearly saturates the carboxylation reaction and inhibits photorespiration (Furbank and Hatch, Reference Furbank and Hatch1987). Consequently, in C4 plants, an increase in atmospheric CO2 from 385 to 550 ppm also leads to greater intercellular CO2 but the nature of C4 plant responses to elevated CO2 has been controversial. Some recent evidences suggest that elevated CO2 does not directly stimulate C4 photosynthesis (Leakey et al., Reference Leakey, Bernacchi, Dohleman, Ort and Long2004, Reference Leakey, Uribelarrea, Ainsworth, Naidu, Rogers, Ort and Long2006; von Caemmerer et al., Reference von Caemmerer, Ghannoum, Conroy, Clark and Newton2001).
Currently, among the C4 crops, Maize (Zea mays L.) is one of the most important cereal crops of the world. In India, maize is grown in 7.8 million ha of land with a production of 19.50 million tonnes and average yield of 1912 kg ha−1 (FAI 2009). Maize has a high yield potentiality which can be achieved with higher inputs of nitrogen. However, increased application of N fertiliser might lead to an increase in the emissions of N2O and CO2 from soil (Bhatia et al., Reference Bhatia, Pathak, Jain, Singh and Singh2005). At fertilisation rates exceeding crop requirement, N2O emissions become more variable and often increase exponentially with increased fertilisation (van Groenigen et al., Reference van Groenigen, Velthof, Oenema, van Groenigen and van Kessel2010). The elevated CO2 concentration in the atmosphere may also have considerable impact on N2O and CO2 emissions from soil. The objectives of the study were to quantify the effect of different levels of N fertiliser and elevated CO2 on 1) N2O and CO2 emissions from soil and 2) carbon efficiency ratio (carbon fixed/carbon emitted) in maize.
MATERIALS AND METHODS
Experimental site and soil
A field experiment was conducted growing maize during kharif (June to October) 2008 in a Typic Ustochrept at the experimental farm of the Indian Agricultural Research Institute, New Delhi, India. The site is located in the Indo-Gangetic alluvial tract at 28°40′ N and 77°12′ E, at an altitude of 228 m above mean sea level. The climate of the region is subtropical, semi-arid. The area receives an annual rainfall of 750 mm, about 80% of which occurs from June to September. The mean maximum and minimum temperatures from June to October are 35 and 18 °C, respectively. The alluvial soil (Typic Ustochrept) of experimental site was having a loamy texture (46% sand, 33% silt and 21% clay) and had a bulk density of 1.38 g cm−3, pH (1:2 soil:water) of 8.1, electrical conductivity of 0.48 dS m−1, CEC of 7.3 C mol (p+) kg−1; and organic carbon, total N, Olsen P and ammonium acetate extractable K contents of 4.5 g kg−1, 0.30 g kg−1, 0.007 g kg−1 and 0.13 g kg−1, respectively. The experimental soil was under maize–wheat rotation for the past two years.
Treatments and crop management
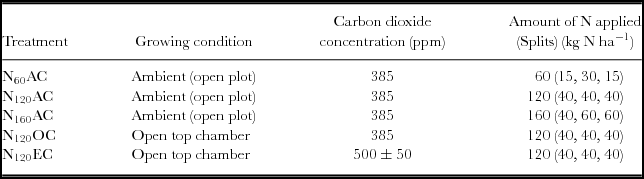
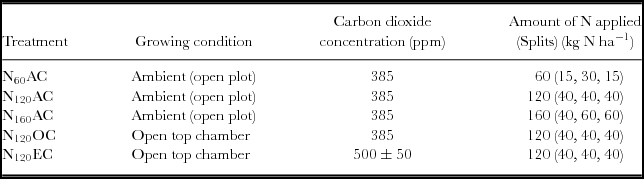
The experiment was carried out with five treatments arranged in randomized block design with three replications (Table 1). Three treatments were taken to analyse the effect of different levels of nitrogen fertiliser on N2O and CO2 emission. The treatments were in open plots with 60 kg N ha−1 (N60AC), 120 kg N ha−1 (N120AC) and 160 kg N ha−1 (N160AC). Other two treatments were taken in open top chambers (OTC) to analyse the effect of elevated CO2 (500 ± 50 ppm) on N2O and CO2 emission. The treatments were ambient CO2 (385 ppm) (N120OC) and elevated CO2 (500 ± 50 ppm) (N120EC). Nitrogen was applied as urea in three splits (Table 1) on 0, 38 and 64 days after sowing (DAS) of maize. The OTCs were fitted with an inert PVC pipe of 10 cm diameter (adjustable height) with many small holes which released, non- filtered air (ambient CO2) and non-filtered air along with elevated CO2 at the crop canopy level. Air was blown into the OTCs through a fan that provided uniform air speeds. The ventilation rates were kept at 3 air changes per min to keep the leaf boundary layer resistances down and the chamber temperature close to ambient. Additional CO2 was applied for 8 h d−1 for 6 d week−1 (09.30–16.30 h) in the elevated CO2 chambers using pressurised CO2 gas cylinders. Air was sampled from the middle of each OTC at the crop canopy level and monitored using a CO2 monitor (Model, CDU-440) for measuring the CO2 concentrations daily from 9.30 to 16.30 h. Light intensity inside and outside the OTCs was measured using a portable light meter (Metravi 1332), temperature and relative humidity was measured using a digital temperature and humidity sensor at 10.00 and 16.00 h daily. Air temperature was higher by 1.2 °C inside the OTCs during the crop growth period. Light intensity was reduced by 10–12% inside the OTCs and relative humidity was 8% higher inside the OTCs.
Treatments in maize grown under ambient and open top chambers.
Maize (variety HQPM-1, 25 kg seeds ha−1) was sown in 60 × 22 cm spacing on 22nd June, 2008. A basal dose of 60 kg P ha−1, 40 kg K ha−1 was applied to all the treatments. Five irrigations were given and weeds, pests and diseases were controlled as required.
Collection and analysis of gas samples
Collection of gas samples for N2O was carried out by the closed-chamber technique (Mosier and Hutchison, Reference Mosier and Hutchison1981). Chambers of 50 cm × 30 cm × 100 cm (length × width × height) made of 6 mm transparent acrylic sheets were placed over the plants for sampling of N2O. A small rotary fan was fixed in each chamber for mixing of air inside the chamber. Temperature and pressure measurement inside the chambers were made during the sampling of N2O. Head space volume inside the chamber was recorded, which was used to calculate N2O. Gas samples were drawn with 50 mL syringe with the help of a hypodermic needle (24 gauge) at 0, 30, and 60 min. The samples collected were brought to the laboratory where they were analysed within two hours. Concentration of N2O in the gas samples was estimated by gas Chromatograph fitted with electron capture detector (ECD) (Pathak et al., Reference Pathak, Bhatia, Prasad, Jain, Kumar, Singh and Kumar2002). A GC–computer interface was used to plot and measure the peak area. N2O standard of 500 ppbV and 1 ppmV obtained from Spectra Gases (NIST standards) were used for calibration.
The CO2 flux was measured using infra-red-based continuous soil CO2 flux analyser (LI-8100) with a 20-cm short-term survey chamber. The closed-chamber was placed on the soil and the rate of increase of the chamber CO2 concentration was used to determine the soil flux. The desired value of the soil flux was determined when the chamber CO2 concentration was the same as the ambient atmospheric concentration. The flux was estimated using the initial slope of a fitted exponential curve at the ambient CO2 concentration.
Samples for GHG analysis were collected between 10 and 11 AM from each replicate of treatments. Estimation of total CO2 and N2O emissions during the crop season was done by successive linear interpolation of average emission on the sampling days assuming that emission followed a linear trend during the periods when no sample was taken (Pathak et al., Reference Pathak, Bhatia, Prasad, Jain, Kumar, Singh and Kumar2002).
Soil sample analysis
Soil samples from the 0–15 cm soil layer in three locations in each plot were collected using a core sampler. The entire volume of soil was weighed and mixed thoroughly and a subsample was taken to determine dry weight. The fresh soil was air-dried for 7 days, sieved through a 2-mm screen, mixed and stored in sealed plastic jars for analyses. Representative subsamples were drawn to determine physico-chemical properties using standard procedures (Page et al., Reference Page, Miller and Keeney1982). Dissolved organic carbon (%) was estimated by hot water extractable method (Ghani et al., Reference Ghani, Dexter and Perrot2003). Fumigation extraction method (Jenkinson and Powlson, Reference Jenkinson and Powlson1976) was used in estimation of microbial biomass carbon (mg Kg−1of soil).
Plant sampling and analysis
Plant samples were collected for recording of root dry weight and shoot dry weight at different growth stages. Yield parameters were recorded after final harvesting. The grains were separated from the cobs, dried and weighed. Dry weight was determined by oven-drying at 65 °C for 48 h to constant weight.
Global warming potential and carbon efficiency ratio
The global warming potential (GWP) of different treatments was calculated using the following equation (IPCC 2007):
 \begin{equation*}
{\rm GWP = N}_{\rm 2} {\rm O}^{\ast}{\rm 298 + CO}_{\rm 2}^{\ast}{\rm 1}{\rm.}
\end{equation*}
The carbon-equivalent emissions (CEE) and carbon efficiency ratio (CER) of the treatments were calculated using the following equations:
 \begin{equation*}
{\rm CEE = GWP}^{\ast}{\rm 12/44,}
\end{equation*}
CER = Grain yield (in terms of C) of the maize / CEE.
Data analysis
Statistical analysis of the data was done using the MSTATC statistical package. Analysis of variance was done to test whether the differences were statistically significant. Unless indicated otherwise, differences were considered only when significant at P < 0.05.
RESULTS
Effect of different levels of N fertilizer application on N2O and CO2 emission from soil
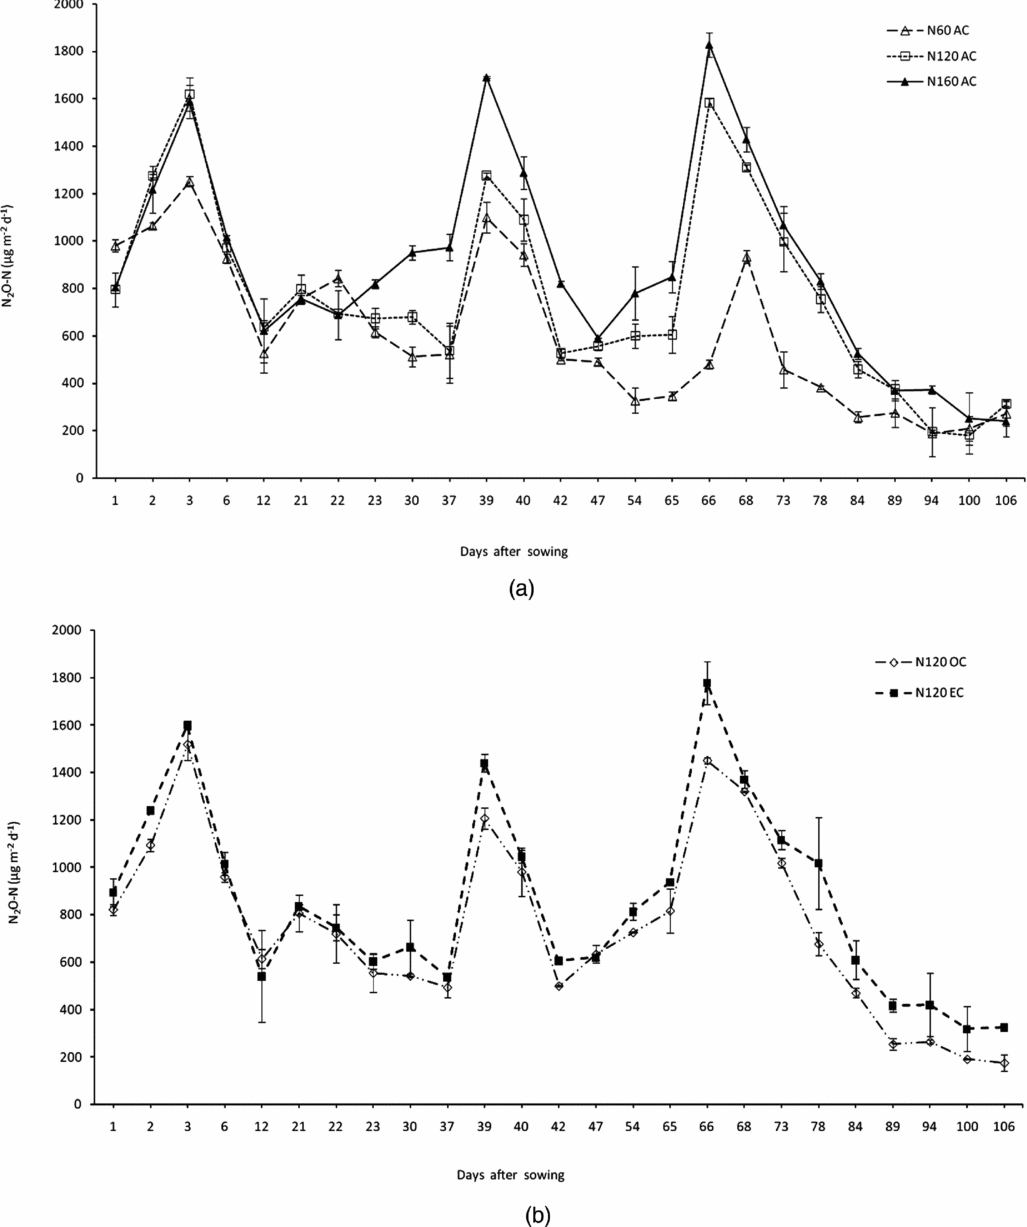
Temporal emissions of N2O for the fertiliser treatments are given in Figure 1a. The N2O fluxes obtained on 1 day after sowing (DAS) were in the range of 795–980 μg m−2 d−1. After application of basal dose of N fertiliser, it resulted in a peak flux of N2O on 3 DAS which varied from 1251 to 1619 μg m−2 d−1 in N60AC and N160AC fertiliser treatments, respectively. The fluxes remained higher till 6 DAS. Subsequently, there was a lowering of the emission till the next date of fertiliser application. Peaks of N2O flux were observed after every dose of N fertiliser application. Three peaks of N2O flux were obtained in each of the treatments which coincide with urea application in three split doses. The highest emission of 1828 μg m−2 d−1 of N2O was obtained on 66 DAS in the N160AC treatment. This peak resulted after application of 60 kg of urea on 64 DAS. This was the highest split dose of urea applied in any treatment (Table 1), which resulted in highest emission of N2O. The N2O fluxes were the lowest in N60AC followed by N120AC and N160AC treatments which is in accordance with the levels of fertiliser applied from lowest to highest dose. The magnitude of N2O emissions during the crop growth period was mostly influenced by the availability of mineral N and ranged from 181 to 1828 μg m−2 d−1 during the crop growth period.
(a) Temporal emission of N2O in different fertilizer treatments in maize (b) Temporal emission of N2O in ambient and elevated CO2 treatments in maize.

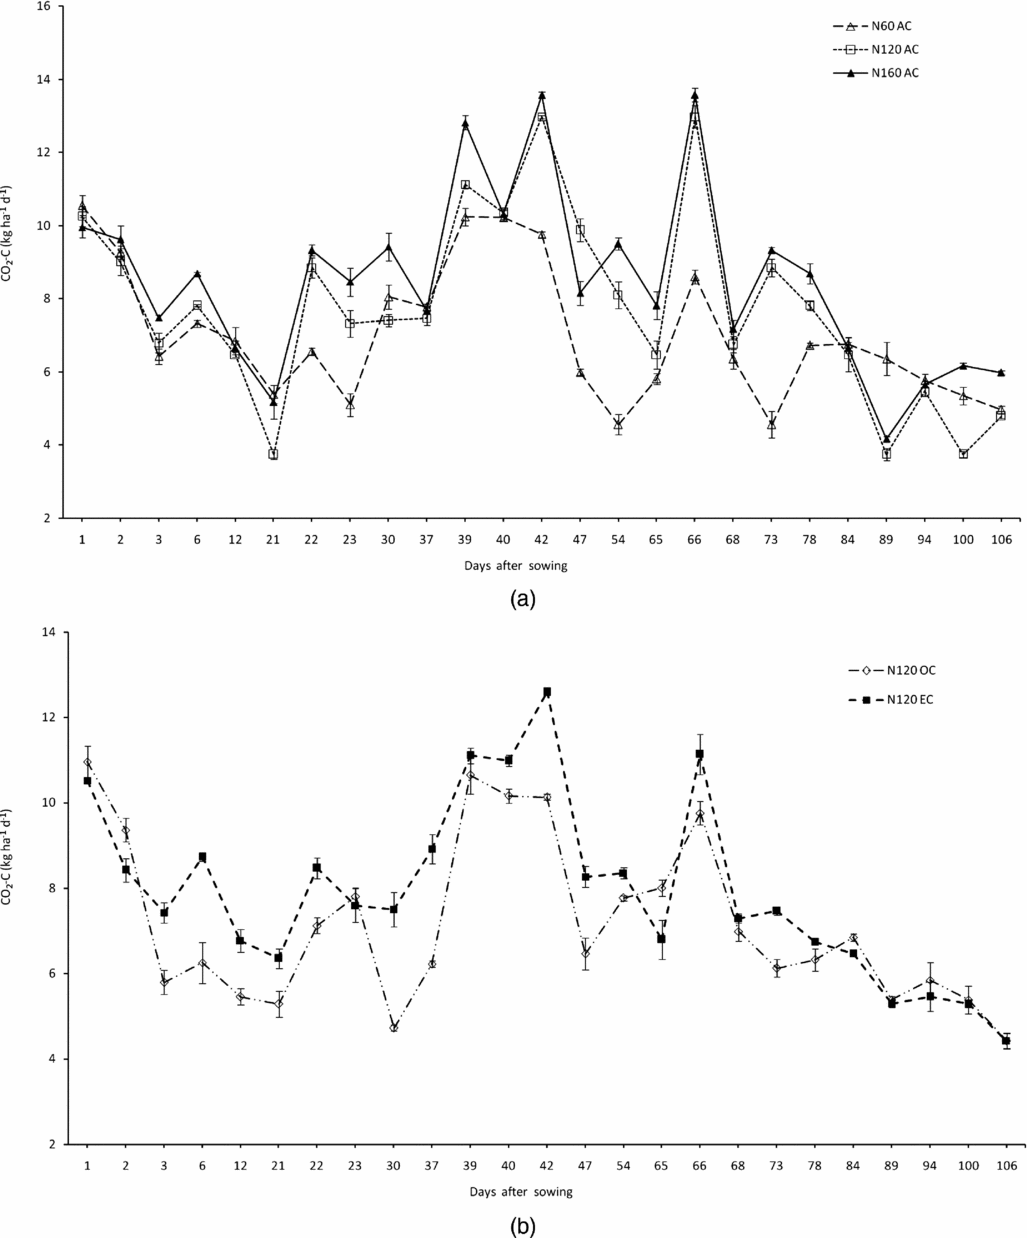
The flux of CO2 fluctuated between 3.10 kg ha−1 d−1 and 13.59 kg ha−1 d −1 during the total crop growing period (Figure 2a) in the fertiliser treatments N60AC, N120AC and N160AC. The mean daily CO2 flux during the crop growth period was highest at 8.48 kg ha−1 d−1 in the N160AC treatment. Average soil CO2 flux was relatively low during the post-flowering period. Figure 2a shows that soil CO2 flux declined steadily after anthesis. The response of different levels of N fertiliser on CO2 emission also followed the same trend as N2O emission as discussed earlier. The highest flux was obtained from N160AC followed by N120AC and the least emission is obtained from N60AC treatment.
(a) Temporal emission of CO2 in different fertlizer treatments in maize (b) Temporal emission of CO2 in ambient and elevated CO2 treatments in maize.
Effect of elevated carbon dioxide on emission of nitrous oxide and carbon dioxide
Higher temporal emissions of N2O and CO2 were observed under elevated carbon dioxide treatment (N120EC) as compared to ambient carbon dioxide treatment (N120OC) in the open top chambers (Figures 1b and 2b). The peaks of N2O were obtained after application of split doses of N fertiliser. However, these peaks are lower than N160AC treatment. In N120EC treatment, the highest peak of CO2 emission was obtained at 66 DAS.
Cumulative CO2 and N2O emission in all the treatments
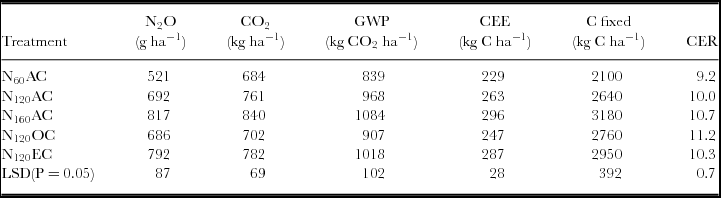
Cumulative seasonal emission of N2O ranged from 521 g ha−1 to 817 g ha−1 in all the treatments (Table 2). The cumulative emissions of N2O were found to be highest in N160AC treatment when compared with all the treatments. In case of elevated CO2 treatment (N120EC), N2O emission was higher by 13% over the N120OC treatment.
Greenhouse gas emission, global warming potential and carbon efficiency ratio under different treatments in maize.
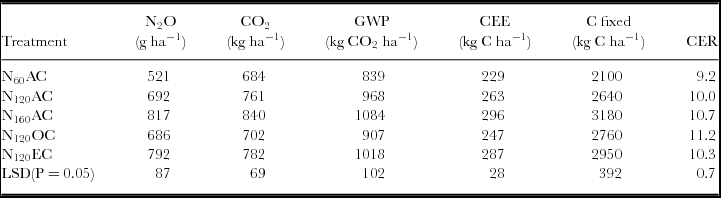
The cumulative seasonal CO2 emission was observed to be the highest in N160AC at 840 kg ha−1 and the lowest emission was observed in the N60AC treatment at 684 kg ha−1 (Table 2). The CO2 emissions were higher by 10.4% in N160AC treatment over the N120AC treatment. The cumulative CO2 emission was 11.3% higher in N120EC treatment over N120OC (Table 2). In our study, CO2 emission per kg of N fertiliser applied increased from 4.2 kg ha−1 under ambient CO2 to 4.9 kg ha−1 under elevated CO2 concentration.
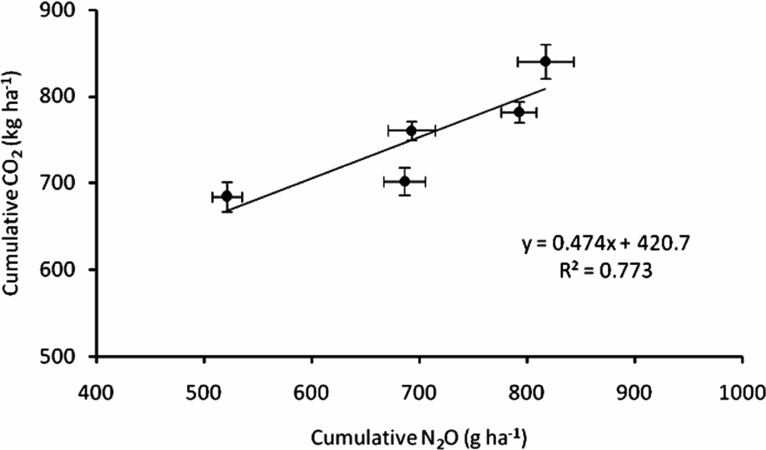
Most soil microorganisms need carbon and nitrogen for their metabolism. In case of nitrification and denitrification processes whereby N2O is produced as an immediate product, these are intimately linked to the carbon availability. When N2O emissions were plotted against CO2 emissions, a positive correlation between these two parameters is found to be significant (Figure 3). In some other studies also, this relationship was significant (Barton and Schipper, Reference Barton and Schipper2001; Zou et al., Reference Zou, Huang, Zong, Zheng and Wang2004).
Correlation of cumulative N2O emission against cumulative CO2 emission. The vertical and horizontal bars represent standard deviation of corresponding axis variables.
Effect of different levels of N application and elevated CO2 on belowground carbon allocation in maize
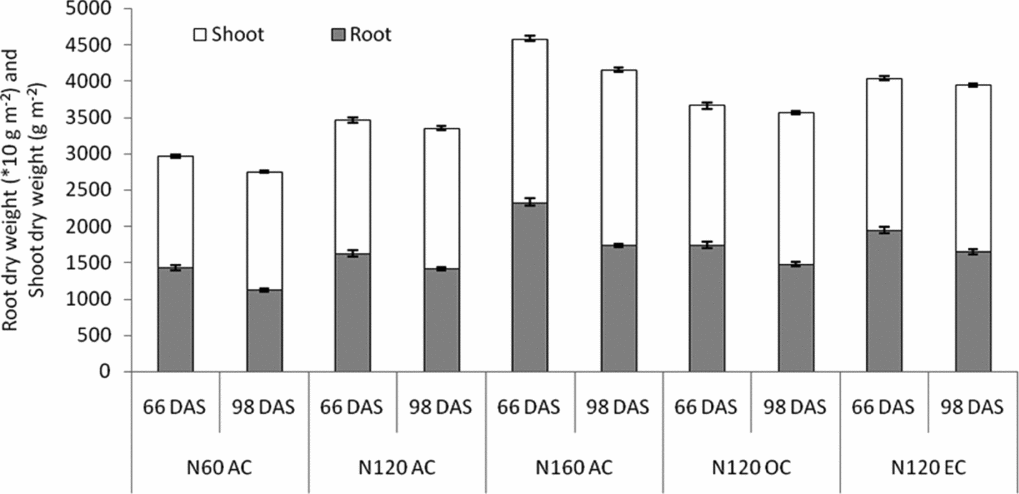
Root dry weight at 66 DAS was lowest in N60AC treatment at 143 gm−2 and highest in N160AC at 233 gm−2 (Figure 4). The root dry weight was higher by 12% in elevated CO2 treatment (N120EC) (195 gm−2) than ambient CO2 (N120OC) (174 gm−2) at 66 DAS. The root dry weight subsequently declined in all the treatments at 98 DAS. The shoot weight was higher under elevated CO2 as compared to ambient CO2 levels but the increase was not significant as maize is a C4 crop. Thus, there was more belowground carbon allocation under elevated CO2 treatment as compared to aboveground carbon allocation.
Average shoot dry weight and average root dry weight under different treatments in maize.
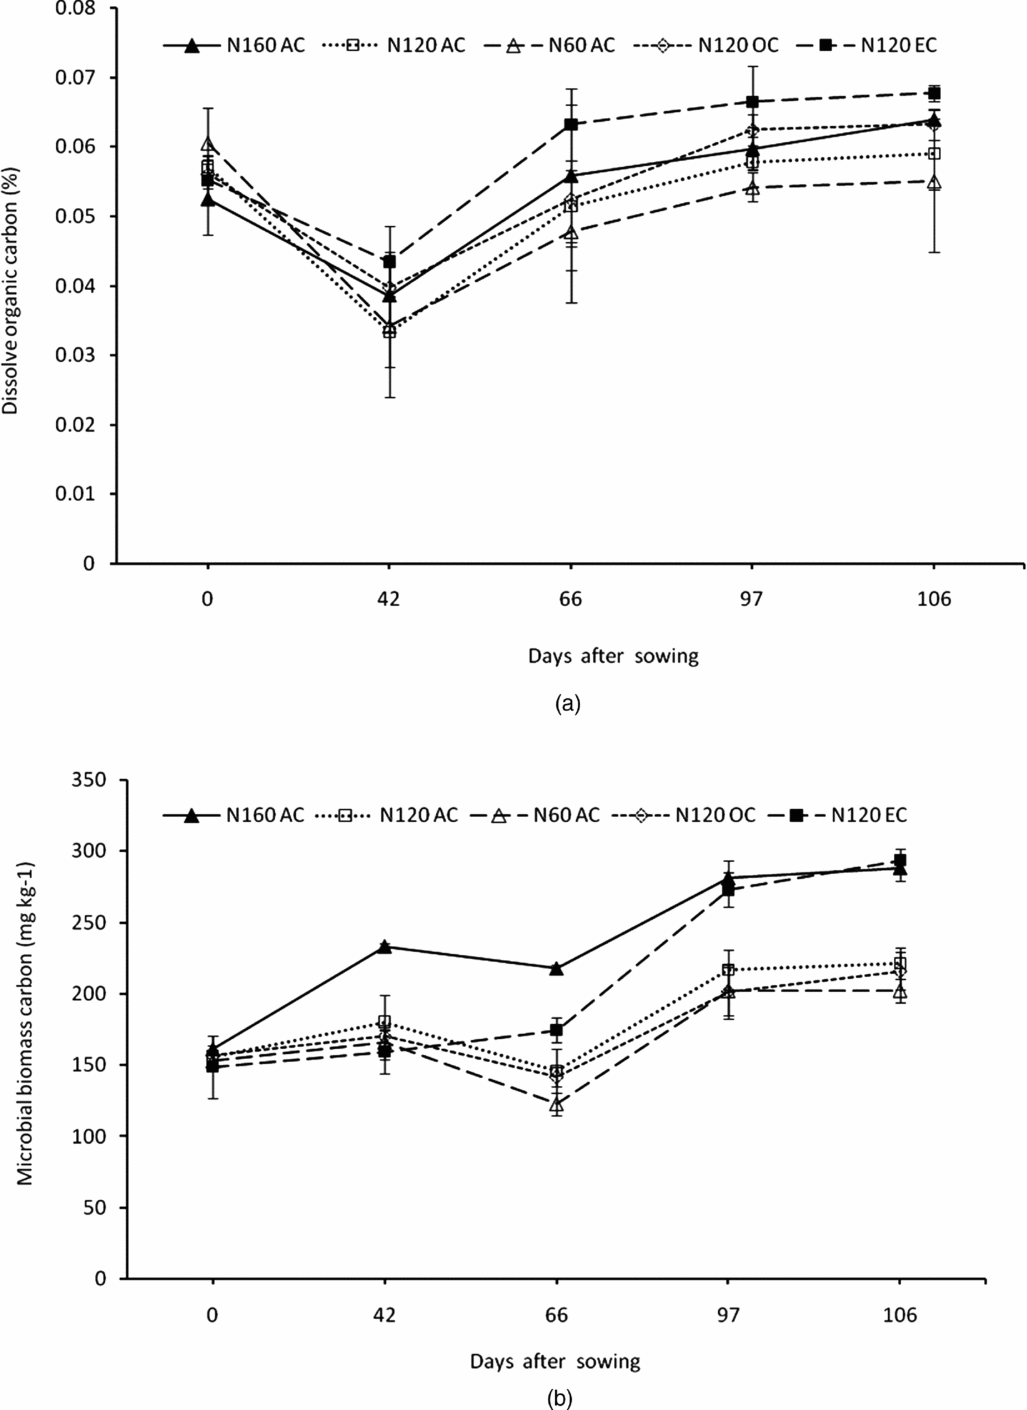
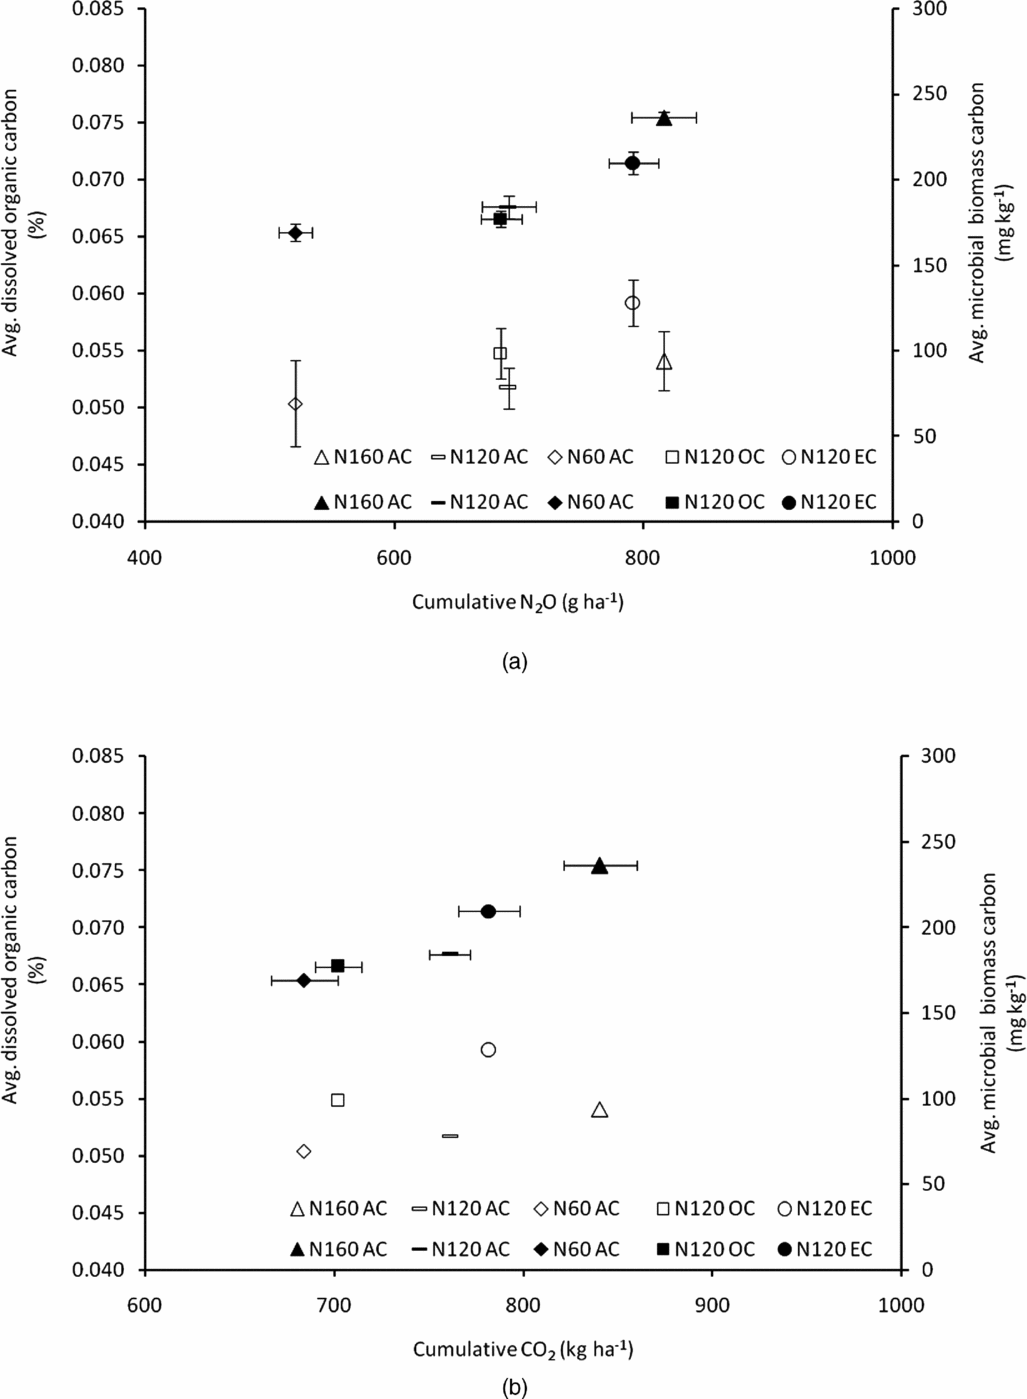
Dissolved organic carbon (DOC) in soil is a labile form of carbon and any short-term changes in the carbon dynamics are very rapidly reflected in this parameter. DOC ranged from 0.033% to 0.067% under different treatments and the maximum was observed under N120EC treatment (Figure 5a). The DOC decreased at 42 DAS and again increased and was highest at 106 DAS in all the treatments. DOC was the least in N60AC among the fertiliser treatments though the difference was not significant. However, the DOC increased in N120EC by 9% over N120OC. The average DOC throughout the crop growth period plotted against cumulative N2O and CO2 emissions from all the treatments was highest in elevated CO2 (N120EC) treatment (Figure 6a, b). In case of highest fertiliser treatment (N160AC), though DOC was lower than N120EC but the emission of both N2O and CO2 was higher.
(a) Dissolved organic carbon (DOC) (b) Microbial biomass carbon (MBC) under different treatments in maize.
Correlation of cumulative N2O emissions against average DOC and average MBC throughout the crop growth period. (b) Correlation of cumulative CO2 emissions against average DOC and average MBC throughout the crop growth period. The solid legends represent MBC values and the empty legends represent DOC values.
The microbial biomass carbon (MBC) in soil varied from 122 mg kg−1 to 281 mg kg−1 (Figure 5b). The MBC was highest in case of N160AC treatment throughout the crop growth period. Soil microbial biomass is linked to plant roots and decomposition of plant residue, as the microbes feed on the roots, root exudates or litter. The relation between average MBC throughout the crop growth period and emissions of N2O and CO2 (Figure 6a, b) showed highest values in N160AC treatment followed by N120EC.
Effect of different level of N and elevated carbon dioxide on global warming potential (GWP) and carbon efficiency ratio (CER)
Due to higher N2O and CO2 emissions under the N160AC treatment, GWP and carbon-equivalent emissions (CEE) were highest under the N160AC treatment and the lowest in N60AC. The GWP increased by 12% in N160AC treatment over N120AC treatments due to increased N2O and CO2 emissions (Table 2). The GWP increased from 906 kg ha−1 to 1017 kg ha−1 under the effect of elevated CO2 in open top chamber. In OTCs, the CEE increased by 16% in N120EC over N120OC.
The grain yield ranged from 5.25 tonnes ha−1 in N60AC treatment to 7.95 tonnes ha−1 in the N160AC treatment. The yield was higher by 17% in N160AC treatment over the N120AC treatment. However, in our study, the yield of maize did not significantly increase under elevated CO2 (Table 2) though there had been an increase in photosynthetic rates during the initial crop growth period (results not shown here). The Carbon Efficiency Ratio, (CER), i.e. carbon fixed/carbon emitted from soil in a fertiliser treatment, is an index of the efficiency of the particular treatment. In our study, the ratio was lowest in case of N60AC treatment at 9.2 and highest in N120OC at 11.2 (Table 2). The CER in N120EC treatment was lower at 10.3 than N120OC as the carbon emitted was significantly higher due to more emissions of N2O and CO2 under elevated CO2 whereas no significant difference was observed in carbon fixed between the two treatments.
DISCUSSION
Effect of N fertiliser application on N2O emission
Nitrous oxide fluxes during the crop growth period were dictated by fertiliser application (Table 1 and Figure 1a). Peaks of N2O flux after application of fertiliser may be due to hydrolysis of applied urea which increased the availability of ammoniacal nitrogen in soil which served as a substrate for nitrification and subsequent denitrification (Abbasi and Adams Reference Abbasi and Adams2000). There are two main processes involved in N2O production from soil: nitrification and denitrification. It is generally assumed that nitrification is the predominant N2O producing process under moderately moist (aerobic) and that denitrification is the predominant process under wet (anaerobic) conditions when NH4+ and NO3− are available in soil (Bouwman, Reference Bouwman1998; Conrad, Reference Conrad1996). In our study, there were conditions that should have been favourable for nitrification. Some findings suggested that denitrification can occur under aerobic soils. Müller et al. (Reference Müller, Stevens, Laughlin and Jägera2004) found that the process of NO3− reduction is the predominant N2O producing mechanism even under aerobic conditions in a temperate grassland soil. Mahmood et al. (Reference Mahmood, Ali, Malik and Shamsi1998) observed that the N2O emissions under maize were significantly correlated with denitrification rate and soil NO3−-N but not with soil NH4+-N. We did not make any measurements on the source of N2O emission and hence we do not know the contribution of nitrification and denitrification to the overall N2O emission in our study. At the later stages of the maize growth, the N2O fluxes did not vary significantly among the treatments. This may be due to drying of roots and reduced root exudates which resulted in availability of lower carbon substrate for nitrifying and denitrifying bacteria.
Effect of N fertiliser application on CO2 emission
Fertiliser N application did not directly affect the temporal CO2 fluxes but higher levels of N application resulted in higher biomass accumulation above and below ground (Figure 4). The root and shoot weight were the highest on application of 160 kg N ha−1 in N160AC treatment. The source of soil carbon from shoot is mainly leaf litter. Higher root weight may have resulted in increased root exudation which provided additional organic substrate for decomposition by microbes resulting in higher fluxes of CO2. Rastogi et al. (Reference Rastogi, Singh and Pathak2002) had reported that litter fall, root mortality are a source of carbon for microbial respiration in soil. Brigid et al. (Reference Brigid, Timothy and John2005) also reported that intensive levels of N application may have an indirect effect on soil CO2 flux by enhancing root and shoot weight of the plant.
Soil CO2 flux (Figure 2) declined steadily after anthesis as more carbohydrates were allocated to grain fill and less to the roots. Martens (Reference Martens1990) reported a decrease in C translocation to the soil and declining rate of root growth as maize plants reached anthesis.
Effect of elevated CO2 on N2O and CO2 emission
Direct effects of elevated CO2 on the components of soil ecosystems are unlikely, since CO2 concentrations in soils are already 10–50 times higher than those in the atmosphere (Lamborg et al., Reference Lamborg, Hardy, Paul and Lemon1983). Therefore, the effects of elevated CO2 concentrations on soil N2O and CO2 emissions were mediated indirectly through altered plant processes and C allocation belowground. The effects of elevated CO2 observed in our study were in general accordance with previous studies, indicating increased biomass production (Figure 4), and increased microbial biomass and a tendency for small increase in soil C content (Figure 5a, b) (de Graaff et al., Reference de Graaff, van Groenigen, Six, Hungate and van Kessel2006; Hungate et al., Reference Hungate, van Groenigen, Six, Jastrow, Lue, de Graaff, van Kessel and Osenberg2009; Luo et al., Reference Luo, Hui and Zhang2006). Studies illustrate that elevated CO2 tends to increase C allocation to root compartments (Luo et al., Reference Luo, Hui and Zhang2006; Rogers et al., Reference Rogers, Runion and Krupa1994) as plants need more resources to sustain the enhanced growth (Bryant et al., Reference Bryant, Chapin and Klein1983). In addition, plants also tend to increase root exudation in elevated CO2 condition (Drigo et al., Reference Drigo, Kowalchuk and van Veen2008; Fitter et al., Reference Fitter, Graves, Wolfenden, Self, Brown, Bogie and Mansfield1997; Lukac et al., Reference Lukac, Lagomarsino, Moscatelli, De Angelis, Cotrufo and Godbold2009). As soil organisms tend to be C limited (Hu et al., Reference Hu, Tu, Chen and Gruver2006; Zak et al., Reference Zak, Pregitzer, Curtis, Teeri, Fogel and Randlett1993), these C inputs could fuel the microbial community (Heath et al., Reference Heath, Ayres, Possell, Bardgett, Black, Grant, Ineson and Kerstiens2005; Zak et al., Reference Zak, Pregitzer, King and Holmes2000), leading to increased microbial biomass and respiration. Soil surface CO2 efflux or soil respiration is the sum of all CO2 produced by belowground processes and includes root respiration and respiration by soil organisms (Litton et al., Reference Litton, Ryan, Knight and Stahl2003). Baggs et al. (Reference Baggs, Richter, Hartwig and Cadisch2003) observed greater emissions of N2O from treatments under elevated CO2 and attributed it to greater below-ground C allocation providing the energy for denitrification in the presence of mineral N.
Effect of management practices on CO2 and N2O emission
Management practices like irrigation and tillage has a significant effect on N2O and CO2 emission from soil. In our study, irrigation showed a minor influence on N2O and CO2 emission from soil. Irrigation on 21 DAS resulted in a small peak of N2O and CO2 (Figure 1a, b and 2a, b) in all the treatments. Pathak et al. (Reference Pathak, Bhatia, Prasad, Jain, Kumar, Singh and Kumar2002) suggested that an application of water triggered off the activity of nitrifying microbes and small peaks were obtained after irrigation events due to the denitrification of nitrate N. When the soil was rewetted, the activity of the microbes, which were in a latent state in the dry soil, increased accompanied by release of air trapped in the soil pores contributing to an increase in CO2 evolution (Orchard Valerie and Cook, Reference Orchard Valerie and Cook1983).
On 1 DAS, higher fluxes of CO2 were obtained in all the treatments. This initial flux may be due to tillage prior to sowing of maize which resulted in breaking down of soil aggregates and resulted in the release of trapped CO2; subsequently, there was a decline in the CO2 flux.
Effect of different levels of N application and elevated CO2 on belowground carbon allocation in maize
The results exhibited that the emission of N2O and CO2 was significantly higher in N160AC among all the treatments followed by elevated CO2 (N120EC) treatment. Elevated CO2 have a propensity to increase C allocation to roots (Figure 4); in addition, plants also tend to increase root exudation as discussed earlier. In our study, this may have increased more carbon availability to nitrifying and denitrifying micro-organisms and hence resulted in higher N2O and CO2 emission.
The shoot weight was higher under elevated CO2 as compared to ambient CO2 levels but the increase was not significant (Figure 6). This may be due to the fact that maize is a C4 plant where there is essentially no (≤1%) direct stimulation of photosynthesis (Leakey et al., Reference Leakey2009). There are also reports of shift in carbon allocation pattern under elevated CO2 treatment where enhanced belowground carbon allocation occurs (Xu et.al., Reference Xu, He, Deng, Wu, Nostrand, Hobbie, Reich and Zhou2013). On application of higher N fertiliser in N160C treatment, the shoot weight was found to increase (Figure 4). A recent meta-analysis done by Sillen and Dieleman (Reference Sillen and Dieleman2012) on grassland revealed that the root-to-shoot ratio (RS) of grasslands tended to decrease significantly under N fertilisation treatment indicating a preferential allocation of carbon towards aboveground biomass. Thus, in N fertiliser treatment, the leaf and other shoot litter is considered as an important carbon source for soil along with root exudates.
Freeman et al. (Reference Freeman, Fenner, Ostle, Kang, Dowrick, Reynolds, Lock, Sleep, Hughes and Hudson2004) observed that under elevated CO2 levels, the proportion of DOC derived from recently assimilated CO2 was higher than that of the control cases. With availability of more DOC in the elevated CO2 treatment, there were higher CO2 and N2O emissions from soil as the additional dissolved organic carbon served as a substrate for microbes (Figure 6a, b). Though DOC of N160AC was lower than elevated CO2 (N120EC) treatment, but the emission of both CO2 and N2O was higher. The availability of extra N in the N160AC treatment may have accelerated the decomposition of soil organic matter by decreasing the C:N ratio of soil and by providing organic carbon as the substrate for CO2 emission and N for microbial growth. Khalil et al. (Reference Khalil, Rosenani, Cleemput, Boeckx, Shamshuddin and Fauziah2002) reported that N2O production was increased by decreasing the C:N ratio of different organic matter. Kiese and Butterbach-Bahl (Reference Kiese and Butterbach-Bahl2002) found a strongly negative correlation between mean annual N2O emission rate and C:N ratio of tropical rain forest soils.
Zak et al. (Reference Zak, Grigal, Gleeson and Tilman1990) reported that microbial biomass C was highly correlated with DOC. Our results showed that the N160AC followed by N120EC stimulated microbial biomass production very effectively. Since soil micro-organisms are mainly C-limited, increased belowground C and N availability usually enhances microbial growth and activity (Curtis et al., Reference Curtis, Vogel, Wang, Pregitzer, Zak, Lussenhop, Kubiske and Teeri2000). Effects of elevated atmospheric CO2 on soil microbes are generally mediated by plant root production and exudation (Montealegre et al., Reference Montealegre, Kessel, Russele and Sadowsky2002) and has been reported to cause an increase in microbial biomass (Sowerby et al., Reference Sowerby, Blum, Gray and Ball2000). Microbial biomass carbon and emission of N2O and CO2 both were higher in N160AC treatment. This may be because microbes are carbon-limited but they also need nitrogen for their body building process. So, higher addition of N fertiliser not only increased microbial biomass in N160 AC treatment (Figure 6a, b) but also provided additional substrate as ammonia or nitrate for nitrification or denitrification processes in soil. Thus, emission of both N2O and CO2 increased in this treatment.
Global warming potential (GWP) and carbon efficiency ratio (CER)
Results showed highest emission of ghg (N2O and CO2) in N160AC treatment followed by elevated CO2 treatment (N120EC). On higher emissions of ghg, the GWP was also higher in N160AC followed by N120EC treatment. In this study, the results illustrated that the yield of maize increased on application of higher N fertiliser and simultaneously the emission of ghgs. On exposure to elevated atmospheric CO2 though the crop yield was not increased significantly as maize is a C4 crop, but the emission of ghgs was increased. This condition is very alarming for the C4 crops.
The Carbon Efficiency Ratio, (CER), i.e. carbon fixed/carbon emitted from soil in a fertiliser treatment, is an index of the efficiency of the particular treatment. The CER calculated in the study was highest for the treatment N120OC (Table 2). This is the treatment where ambient CO2 level was maintained inside open top chambers (OTC). Conversely, in elevated CO2 treatment, the emission of both the ghgs was higher than N120OC but there was no significant difference observed in carbon fixed between the two treatments as maize is a C4 crop. Thus, CER of elevated CO2 was lower than ambient CO2.
Among fertiliser treatments, the CER was highest in N160AC treatment than N120 AC. In India, the recommended N fertiliser for maize crop is 80–100 kg ha−1 for rainfed and 120- 150 kg ha−1 for irrigated condition (source: www.icrisat.org). The CER value of our study showed that on application of 160 kg N ha−1 increased emission of ghg from soil under maize resulted in increase in GWP. The 160 kg N ha−1 fertiliser dose not only increased GWP but also stimulated the yield of maize. Along these lines, further research is needed to verify upto what level of fertiliser dose the amount of emission will not exceed the yield, i.e. CER value will not get reduced. Thus, optimisation of the fertiliser dose has to be done so that without compromising the yield the emission can be controlled.
CONCLUSIONS
On application of 160 kg N ha−1, the global warming potential of soil under maize cultivation in India (7.8 million ha; FAI, 2009) would increase but it also increases the carbon efficiency ratio (carbon fixed per unit of carbon emitted). Our results further suggested that the elevated level of CO2 in future will increase the carbon-equivalent emissions without significantly increasing the maize yields. There will be higher belowground carbon allocation in soil under elevated CO2 condition which will increase the emission of both CO2 and N2O from soil under maize. Thus, the global warming potential per unit of grain yield will increase under projected levels of CO2 in the future. Some mitigation strategies need to be evaluated by developing new varieties of higher HI and lower R/S ratio to improve yields and decrease the carbon-equivalent emissions.
Acknowledgements
The authors are grateful to the Indian Council of Agricultural Research (ICAR), New Delhi, India for providing funding and the Post Graduate School, Indian Agricultural Research Institute, New Delhi, India for providing facilities during the course of the study. The authors also thank Dr. Vinay Kumar Singh for the help rendered.