1. INTRODUCTION
The characteristics of laser-produced plasmas (LPP) are important in understanding the interaction of lasers and materials in many new emerging research fields such as ignition mechanism of nuclear fusion (Tabak et al., Reference Tabak, Hammer, Glinsky, Kruer, Wilks, Woodworth, Campbell, Perry and Mason1994; Kodama et al., Reference Kodama, Shiraga, Shigemori, Toyama, Fujioka, Azechi, Fujita, Habara, Hall, Izawa, Jitsuno, Kitagawa, Krushelnick, Lancaster, Mima, Nagai, Nakai, Nishimura, Norimatsu, Norreys, Sakabe, Tanaka, Youssef, Zepf and Yamanaka2002; Honrubia & Meyer-ter-Vehn, Reference Honrubia and Meyer-ter-Vehn2009; Theobald et al., Reference Theobald, Solodov, Stoeckl, Anderson, Betti, Boehly, Craxton, Delettrez, Dorrer, Frenje, Glebov, Habara, Tanaka, Knauer, Lauck, Marshall, Marshall, Meyerhofer, Nilson, Patel, Chen, Sangster, Seka, Sinenian, Ma, Beg, Giraldez and Stephens2011; Shiraga et al., Reference Shiraga, Fujioka, Nakai, Watari, Nakamura, Arikawa, Hosoda, Nagai, Koga, Kikuchi, Ishii, Sogo, Shigemori, Nishimura, Zhang, Tanabe, Ohira, Fujii, Namimoto, Sakawa, Maegawa, Ozaki, Tanaka, Habara, Iwawaki, Shimada, Nagatomo, Johzaki, Sunahara, Murakami, Sakagami, Taguchi, Norimatsu, Homma, Fujimoto, Iwamoto, Miyanaga, Kawanaka, Jitsuno, Nakata, Tsubakimoto, Sueda, Morio, Matsuo, Kawasaki, Sawai, Tsuji, Murakami, Kanabe, Kondo, Kodama, Sarukura, Shimizu, Mima and Azechi2012; Batani et al., Reference Batani, Antonelli, Atzeni, Badziak, Baffigi, Chodukowski, Consoli, Cristoforetti, De Angelis, Dudzak, Folpini, Giuffrida, Gizzi, Kalinowska, Koester, Krousky, Krus, Labate, Levato, Maheut, Malka, Margarone, Marocchino, Nejdl, Nicolai, O'Dell, Pisarczyk, Renner, Rhee, Ribeyre, Richetta, Rosinski, Sawicka, Schiavi, Skala, Smid, Spindloe, Ullschmied, Velyhan and Vinci2014), particle acceleration (Clark et al., Reference Clark, Krushelnick, Davies, Zepf, Tatarakis, Beg, Machacek, Norreys, Santala, Watts and Dangor2000; Snavely et al., Reference Snavely, Key, Hatchett, Cowan, Roth, Phillips, Stoyer, Henry, Sangster, Singh, Wilks, MacKinnon, Offenberger, Pennington, Yasuike, Langdon, Lasinski, Johnson, Perry and Campbell2000; Maksimchuk et al., Reference Maksimchuk, Gu, Flippo, Umstadter and Bychenkov2000; Key et al., Reference Key, Akli, Beg, Chen, Chung, Freeman, Foord, Green, Gu, Gregori, Habara, Hatch- ett, Hey, Hill, King, Kodama, Koch, Lancaster, Lasinski, Langdon, MacKinnon, Murphy, Norreys, Patel, Patel, Pasley, Snavely, Stephens, Stoeckl, Tabak, Theobald, Tanaka, Town, Wilks, Yabuuchi and Zhang2006; Vauzour et al., Reference Vauzour, Santos, Batani, Baton, Koenig, Nicolaı, Perez, Beg, Benedetti, Benocci, Brambrink, Chawla, Coury, Dorchies, Fourment, Galimberti, Gizzi, Heathcote, Higginson, Honrubia, Hulin, Jafer, Jarrot, Labate, Lancaster, Koester, MacKinnon, McKenna, McPhee, Nazarov, Pasley, Ramis, Rhee, Regan, Ribeyre, Richetta, Serres, Schlenvoigt, Schurtz, Sgattoni, Spindloe, Vaisseau, Volpe and Yahia2011, Reference Vauzour, Santos, Debayle, Hulin, Schlenvoigt, Vaisseau, Batani, Baton, Honrubia, Nicolaï, Beg, Benocci, Chawla, Coury, Dorchies, Fourment, d'Humières, Jarrot, McKenna, Rhee, Tikhonchuk, Volpe and Yahia2012), high-energy density science (Saemann et al., Reference Saemann, Eidmann, Golovkin, Mancini, An- dersson, Fӧrster and Witte1999; Patel et al., Reference Patel, Mackinnon, Key, Cowan, Foord, Allen, Price, Ruhl, Springer and Stephens2003; Hoarty et al., Reference Hoarty, James, Davies, Brown, Harris, Smith, Davidson, Kerswill, Crowley and Rose2007; Perez et al., Reference Perez, Gremillet, Koenig, Baton, Audebert, Chahid, Rousseaux, Drouin, Lefebvre, Vinci, Rassuchine, Cowan, Gaillard, Flippo and Shepherd2010; Nishimura et al., Reference Nishimura, Mishra, Ohshima, Nakamura, Tanabe, Fujiwara, Yamamoto, Fujioka, Batani, Veltcheva, Desai, Jafer, Kawamura, Sentoku, Mancini, Hakel, Koike and Mima2011), laboratory astrophysics, and stellar plasmas (Fujioka et al., Reference Fujioka, Takabe, Yamamoto, Salzmann, Wang, Nishimura, Li, Dong, Wang, Zhang, Rhee, Lee, Han, Tanabe, Fujiwara, Nakabayashi, Zhao, Zhang and Mima2009a, Reference Fujioka, Yamamoto, Salzmann, Wang, Li, Dong, Wang, Zhang, Rhee, Lee, Han, Kwon, Zhong, Zhao, Tanabe, Fujiwara, Nakabayashi, Zhang, Nishimura, Takabe and Mimab; Badziak et al., Reference Badziak, Pisarczyk, Chodukowski, Kasperczuk, Parys, Rosiński, Wołowski, Krousky, Krasa, Mašk, Pfeifer, Skala, Ullschmied, Velyhan, Dhareshwar, Gupta, Rhee, Torrisi and Pisarczyk2009, Reference Badziak, Borodziuk, Pisarczyk, Chodukowski, Krousky, Masek, Skala, Ullschmied and Rhee2010), and so on. Among them, Bremsstrahlung X-rays (BXs) emitted from plasmas are very important in probing the electron-related properties of the plasma. BX is the electro-magnetic radiation generated in the process of acceleration (or deceleration) of a charged particle and the energy spectrum is accordingly continuous. On the other hand characteristic X-rays are generated in the process of the electronic transitions between bound levels of an atom, causing discrete specific peaks in the spectrum called as K, L, M … transition lines depending on the final lower states.
Since the initial report by Chen et al. (Reference Chen, King, Key, Akli, Beg, Chen, Freeman, Link, Mackinnon, MacPhee, Patel, Porkolab, Stephens and Van Woerkom2008) on the stack type spectrometer, there have been several reports on the investigation of the BX in conjunction with plasma characteristics (Chen et al., Reference Chen, Patel, Hey, Mackinnon, Key, Akli, Bartal, Beg, Chawla, Chen, Freeman, Higginson, Link, Ma, MacPhee, Stephens, Van Woerkom, Westover and Porkolab2009; Scott et al., Reference Scott, Clark, Pérez, Streeter, Davies, Schlenvoigt, Santos, Hulin, Lancaster, Baton, Rose and Norreys2013; Fujioka et al., Reference Fujioka, Johzaki, Arikawa, Zhang, Morace, Ikenouchi, Ozaki, Nagai, Abe, Kojima, Sakata, Inoue, Utsugi, Hattori, Hosoda, Lee, Shigemori, Hironaka, Sunahara, Sakagami, Mima, Fujimoto, Yamanoi, Norimatsu, Tokita, Nakata, Kawanaka, Jitsuno, Miyanaga, Nakai, Nishimura, Shiraga, Nagatomo and Azechi2015). As described in those reports a filter stack spectrometer (FSS), made of several different metal filters producing different responses of incoming BX on imaging plates (IP), is used and obtained data is analyzed by applying a matrix algorithm combined with Monte Carlo simulations. Responses of IPs to the electrons incident on a target have been investigated in two steps, with a concept of SRM (spectrometer response matrix) and TRM (target response matrix) (Chen et al., Reference Chen, King, Key, Akli, Beg, Chen, Freeman, Link, Mackinnon, MacPhee, Patel, Porkolab, Stephens and Van Woerkom2008), in which the parameters relating electron energy distributions to the generated X-rays with a two-temperature model may not be uniquely determined (Chen et al., Reference Chen, Patel, Hey, Mackinnon, Key, Akli, Bartal, Beg, Chawla, Chen, Freeman, Higginson, Link, Ma, MacPhee, Stephens, Van Woerkom, Westover and Porkolab2009), due to lack of proper optimization. A detector with one kind of material (Pb) of different thicknesses for filters has been used to measure the BX in relativistic laser–solid interactions (Scott et al., Reference Scott, Clark, Pérez, Streeter, Davies, Schlenvoigt, Santos, Hulin, Lancaster, Baton, Rose and Norreys2013). Electronic slope temperatures with two-temperature model in the study of integrated fast-ignition reaction are sought by the analysis of BX data recorded on IP, with separate treatment of high and low temperature parts in conjunction with electron energy analyzer and hard X-ray spectrum (Fujioka et al., Reference Fujioka, Johzaki, Arikawa, Zhang, Morace, Ikenouchi, Ozaki, Nagai, Abe, Kojima, Sakata, Inoue, Utsugi, Hattori, Hosoda, Lee, Shigemori, Hironaka, Sunahara, Sakagami, Mima, Fujimoto, Yamanoi, Norimatsu, Tokita, Nakata, Kawanaka, Jitsuno, Miyanaga, Nakai, Nishimura, Shiraga, Nagatomo and Azechi2015). In those studies mainly electronic properties are pursued, leading to the efforts to get the electron energy distribution by fitting the electron temperatures to the measured X-ray data. However, the parameter spaces spanned in those analysis are not large enough, resulting in that it is not probable to get the optimized parameters for the temperatures of electrons or it is not possible to determine the slope temperatures of X-rays. In other words those approaches are not proper to give the direct spectral characteristics of the X-rays emerging from the plasmas, if not through the analysis of electronic properties together. Furthermore, with a limited number of energy bins in those analyses the details of spectral characteristics of filter materials such as Kα absorption edges cannot be well reflected in the derivation. Or fine grid of energy bins is necessary since the larger the number of energy bins the better response characteristics can be obtained, implying that unrealistic amount of Mote Carlo calculation is necessary.
In this paper we present an alternative new method to analyze BX data in a direct way, which may be called as spectral tomographic reconstruction (STR). In this method, rather than pursuing to get the electronic properties of the target material emitting X-rays and using matrix algorithm with small number of energy bins, we employ the variational principle applied to about 1,000,000 parameter sets with 30,000 energy bins in 1 keV interval to get the realistic functional form of the X-ray spectrum itself, not the electron temperatures of a Boltzmann distribution. This approach is applied to the analysis of BX data obtained at the TITAN laser facility of LLNL (Lawrence Livermore National Laboratory) in U.S.A. in 2011, at the SG II laser facility of SIOM (Shanghai Institute of Optics and fine Mechanics) in 2014, and at the petawatt laser facility at CoReLS (Center for Relativistic Laser Science) of IBS (Institute for Basic Science) in Korea in 2014. In TITAN laser facility we used both a long-pulse (nanosecond) laser and a short-pulse (picosecond) laser, in SG II facility we used only a long-pulse (nanosecond) laser, and in the CoReLS petawatt laser (CPW) facility only short-pulse (femtosecond) laser was used.
2. BASIC CONCEPT AND EXPERIMENTAL APPARATUS
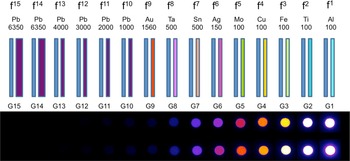
The device to measure the continuous spectrum of BX in this investigation is composed of several metal filters of different materials and different thicknesses and mating IPs behind each of the filters. The IPs record the responses caused by X-ray light impinging on the IP surfaces. The device is similar to the one described in Chen et al. (Reference Chen, King, Key, Akli, Beg, Chen, Freeman, Link, Mackinnon, MacPhee, Patel, Porkolab, Stephens and Van Woerkom2008). In other words, each IP is supposed to record the response of X-rays which have traveled through all the other filters and IPs in front of the specific IP, as shown in Figure 1. In this figure X-ray is incident from the right to the left and one IP disc is placed behind each metal filter. Imaging plate is a kind of plastic film, which contains radiation sensitive material and is capable of recording the response caused by X-ray light (or particles such as electrons or protons) and later being read-out by another light of different wavelength to give information about the amount of X-ray photons which have impinged on the IP (Medowcroft et al., Reference Medowcroft, Bentley and Stott2008; Bonnet et al., Reference Bonnet, Comet, Denis-Petit, Gobet, Hannachi, Tarisien, Versteegen and ALeonard2013).
Metal filters and imaging plates for a Bremsstrahlung spectrometer; each filter is sandwiched by two Mylar films, one in the front and another in the back. In front of the first filter (Al filter) a Teflon block is placed to keep any debris from coming into the spectrometer. The numbers below the filter material names are the thicknesses of them in micrometers. The blue rectangles behind each filter of different colors are imaging plates. The actual recorded images on IP are shown in the lower picture with pseudo-colored intensity, which is a scanned image by FLA-7000 IP scanner.

In this study we use two different FSSs. These FSSs are essentially the same and the specifications of those FSSs are shown in Table 1. From the design specification of the filters we are able to calculate the transmittance using the information of mass attenuation coefficient available at NIST X-ray attenuation database.
Filter materials and thickness: FSS #1 was used in the experiment at LLNL and FSS #2 was used in the experiments at SIOM and CoReLS/IBS (thicknesses in mm).

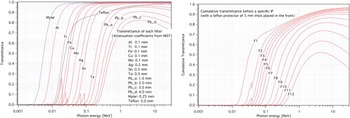
For the FSS #2 the transmittance of each filter is calculated based on the NIST X-ray attenuation coefficients data and shown in Figure 2. Here the cumulative transmittance of the filters are also shown for the case when protective Teflon block of 5 mm thickness are put in the front of FSS and PMMA acryl window of 8 mm thickness is attached to the flange of reaction chamber.
Transmittance of the second FSS detector; (left figure) transmittance of filter materials; (right figure) cumulative transmittance.

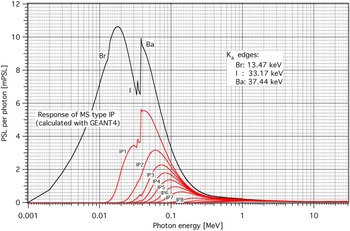
From the information about transmittance, the overall spectral responses of IPs at its own position in the barrel with all filters installed are calculated as in Figure 3. The Kα edges of the filter materials as well as those of Barium, Bromine, and Iodine peaks of BAS MS type IP are taken into account. The spectral response of bare MS-type IP has been calculated by using GEANT4 simulation code, showing the Kα edges clearly, which turned out to give a good agreement with the experimental data (Medowcroft et al., Reference Medowcroft, Bentley and Stott2008).
Cumulative spectral response curves of each IP of the FSS #2, as well as the response curve of bare IP calculated with GEANT4 simulation code, where BAS MS type of imaging plate is used.

3. SPECTRAL TOMOGRAPHIC RECONSTRUCTION PROCESS
Since the matrix inversion method is sensitive to the noise inherent in the signal as well as the fact that the dimension of the response matrix is limited according to the number of filters and IPs used in the device, it may not be appropriate to use the inverse matrix method to reconstruct the real spectrum of incident X-rays. Especially, in such cases as our experimental environments where noise or uncertainties due to arbitrary shape of X-ray sources, irregularities of detecting sensors, and geometric varieties of apparatus setups exist in addition to the insufficient treatment of Kα edges of filter materials, simple inverse filtering algorithm based on a very limited dimension of response matrix may not be appropriate. So we decide to develop an alternative new method based on the variational principle, instead, where those uncertainties can be neglected and treated as an error or negligible deviation in the end. We are concerned only in the relative spectral characteristics of incoming X-rays, with an assumption that spectral shape or characteristics are mostly uniform in space and time. In this derivation we are not concerned about electron distributions in the source plasma.
We begin with a trial function of an exponential form and calculate the response on each IP and compare it with the actual signal recorded on the IP in the experiment. Of course we can use any forms of trial function depending on the situation. Now, we start with a trial function of the following form as to the number distribution of X-ray photons,
 $$I^{{\rm trial}}\;(E) = {\rm \alpha} \exp \left( { - \displaystyle{E \over {T_{{\rm HOT}}}}} \right) + (1 - {\rm \alpha} )\exp \left( { - \displaystyle{E \over {T_{{\rm COLD}}}}} \right)$$
where α is a parameter representing relative contributions of the “hot” temperature part and the “cold” temperature part. Then we calculate the response on each IP by
 $$J_i = \int {F_i(E)I^{{\rm trial}}(E)dE}$$
where F i is the cumulative transmittance of all the prior filters and IPs in front of that specific i-th IP, combined with the sensitivity of that IP, which is given by
 $$\eqalign{F_i(E) & = {\rm Tf}(E) \times \left( {\prod\limits_{\,j = 1}^i {\,f_j(E)}} \right) \cr & \quad \times [{\rm I}{\rm P}_{{\rm TRANS}}(E)]^{i - 1} \times {\rm I}{\rm P}_{{\rm RESPONSE}}(E)}$$
where Tf (E) is the transmittance of a Teflon block in the front of the detector, IPTRANS and IPRESPONSE being the transmittance and response of imaging plate respectively, and f(E) being the transmittance of each metal filter material combined with protective Mylar films in the front and at the back of each filter;
 $${f}_i(E) = {\rm My}(E) \times f_j^{{\rm ELEMENT}} (E) \times {\rm My}(E)$$
where My(E) is the transmittance of mylar film, f ELEMENT being the transmittance of each bare metal such as Al, Ti, and so on. Since IPRESPONSE is in PSL (Photo-Stimulated Luminescence) per photon, the calculated I(E) is the photon number distribution as a function of photon energy. To get the energy fluence of the photons, we have to multiply I(E) by E.
Then the calculated response J of each IP is compared with the experimentally measured response G on the corresponding IP. Then root mean square (RMS) value of the deviation of the ratio G/J from 1.0 is calculated as
 $${\rm Ratio}\;{\rm deviation} = \displaystyle{{\sum\limits_{i = 1}^n {{(1 - G_i/J_i)}^2}} \over n}$$
where n is the number of IP used in the experiment and Js are normalized such that J 1 is the same as G 1. That is why we are not concerned about the absolute value of the response PSL value of IP. If the calculated responses with a specific set of parameters are perfect, meaning that calculation results is actually the same as experimental data, then the RMS ratio deviation would vanish.
In this analysis we are concerned more about the ratio rather than difference of the calculated and the measured values, since each filter is regarded as equally meaningful with respect to the energy of incoming X-rays. We iterate this calculation procedure for different sets of (α, T HOT, T COLD) and finally choose one set of (α, T HOT, T COLD), which gives the minimum value of RMS deviation among about one million of sets, which implies that the trial function with these values is closest to the real X-ray spectrum, up to the precision of RMS deviation, based on the variational principle for optimization.
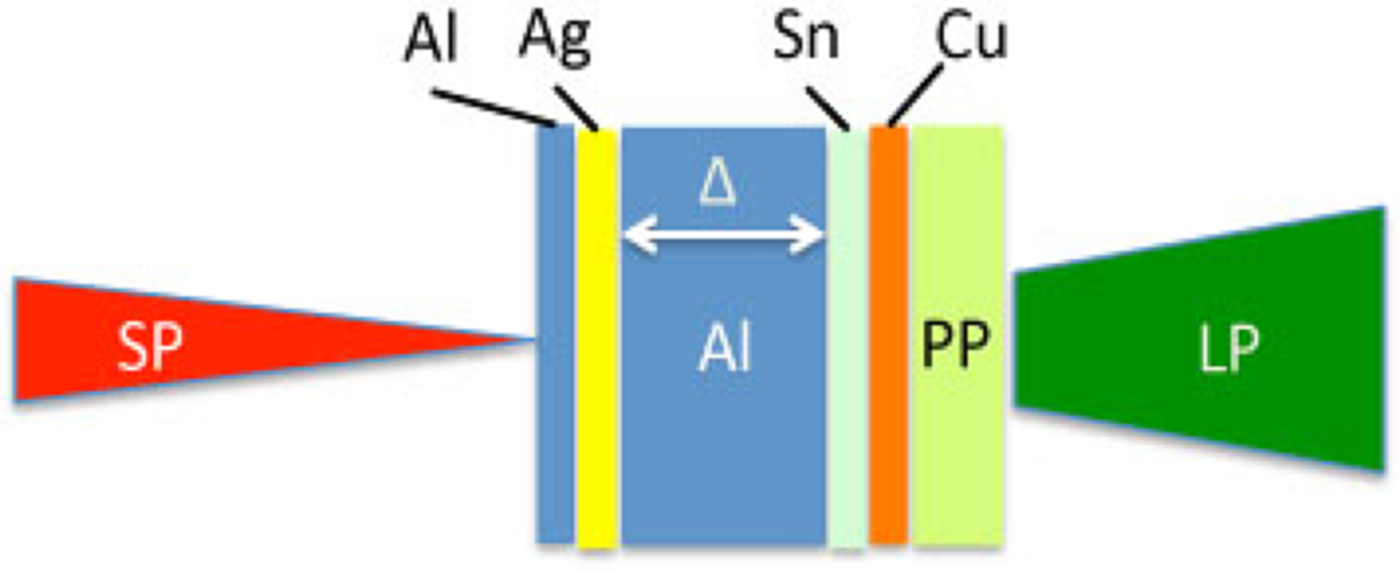
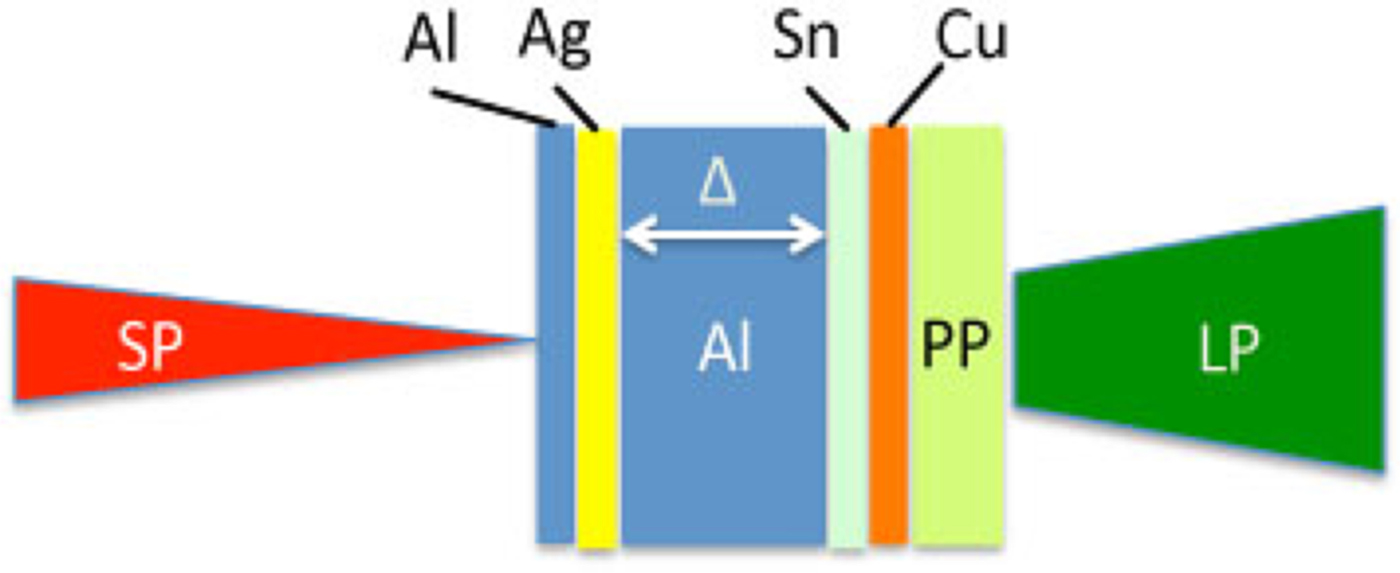
In this way we can determine the energy spectrum of BX in the form of a double exponential function of which the absolute amplitude is arbitrary. More detailed discussion about this method is given below, applied to the analysis of experimental data obtained at different major laser facilities. Figure 4 shows the geometries of target and laser beams for TITAN facility (Vaisseau et al., Reference Vaisseau, Debayle, Honrubia, Hulin, Morace, Nicolaï, Sawada, Vauzour, Batani, Beg, Davies, Fedosejevs, Gray, Kemp, Kerr, Li, Link, McKenna, McLean, Mo, Patel, Park, Peebles, Rhee, Sorokovikova, Tikhonchuk, Volpe, Wei and Santos2015) and Figure 5 for SG II facility (Zhao et al., Reference Zhao, Zhang, Yuan, Chen, Li, Fu, Rhee, Li, Zhu, Li, Liao, Zhang, Han, Liu, Huang, Ma, Li, Xiong, Huang, Fu, Zhu, Zhao and Zhang2015). The target for CoReLS CPW facility is not shown here, in which simple flat targets are used.
Targets and laser for TITAN: Thickness: Al (5μm), Ag (5 µm), Al (10, 20, 40, 60, 80 µm), Sn(10 µm), Cu(10 µm), PP(polypropylene 15 µm); Lasers: LP (long pulse): λ = 0.53 µm, τ = 5.0 ns, Φ = 875 µm, E = 410 ± 9J, SP (short pulse): λ = 1.06 µm, τ = 0.7 ps, Φ = 7 µm, E = 115 ± 30J.
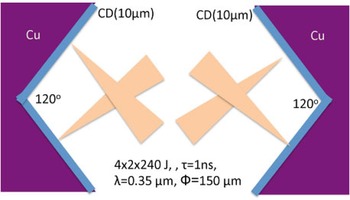
Target and laser for SG II: Target: CD (10 µm) film on a copper block; Laser: 4 groups of 2 laser beams of 8 laser beams of SG II laser system impinging on each side of target surface.

3.1. Analysis of BX Measured at TITAN Facility
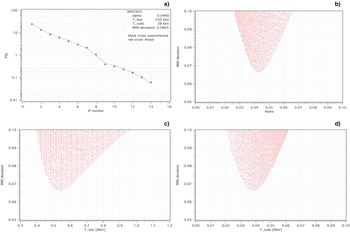
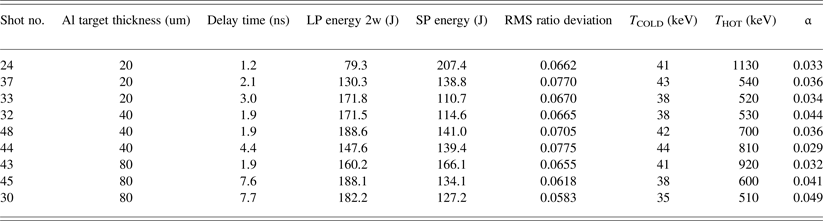
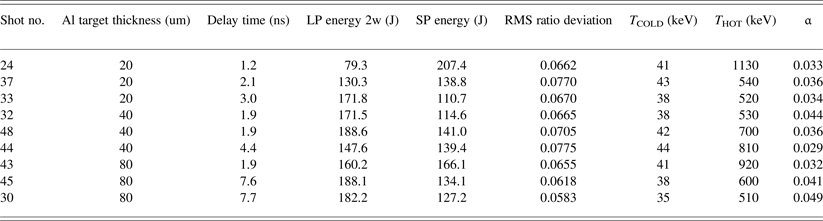
The experiment at TITAN is to investigate the hot electron transport in a compressed plasma and experimental details including targets and setup geometries as well as the results are described in Vaisseau et al. (Reference Vaisseau, Debayle, Honrubia, Hulin, Morace, Nicolaï, Sawada, Vauzour, Batani, Beg, Davies, Fedosejevs, Gray, Kemp, Kerr, Li, Link, McKenna, McLean, Mo, Patel, Park, Peebles, Rhee, Sorokovikova, Tikhonchuk, Volpe, Wei and Santos2015). As shown in Figure 4 flat target composed of Ag, Al, Sn, Cu, and CH layers are used, where Al with different thicknesses is the main material to be investigated. In the experiment, TITAN laser system with two laser beams is used; one is a long-pulse (LP) laser beam of 5 ns duration for plasma generation and compression and another one of short-pulse (SP) laser beam of about 1ps duration is for hot electron generation. This SP laser beam arrives on the target surface after some time delay following the compressing LP beam. For the analysis of these BX data, the method described above is applied, leading to the results shown in Figure 6. Table 2 shows the results of the analysis for some targets of thicknesses of 20, 40, and 80 µm. We can say that within about 7% of RMS error the BX is composed of about 3–5% of “hot” temperature photons (of 0.5–1 MeV) and remaining portion being “cold” temperature photons (of about 40 keV).
Data analysis; 14 metal filters have been used. Within 6.65% of RMS deviation (error) the values of (α, T HOT, T COLD) with two-temperature trial function are good to represent the incoming X-ray. In this case the slope hot temperature is 530 keV and slope low temperature is 38 keV. It can be said incoming X-ray is mixture of the hot temperature part of 4.4% and the low temperature part of 95.6%. (a) best fit of the PSL of each IP for an optimum set of α, T HOT, and T COLD, (b) RMS deviation versus alpha, where each red dot represents a RMS deviation corresponding to one set of α, THOT, and TCOLD, (c) RMS deviation versus T HOT, (d) RMS deviation versus T COLD.

Optimum sets of (α, T HOT, T COLD) for the BX data obtained at TITAN facility.
Since this target contains Ag and Sn materials, their characteristic peak Kα X-ray emission lines, which are in the range of 20–30 keV might have caused some effects on the cold temperature component by shifting the temperature value somewhat toward that range due to extra photons even though the effect may not be significant when the responses are integrated over the wide spectral range. That would have contributed to the systematic errors to some extents.
Since we used a short-pulse laser beam for hot electron generation we can notice that there are considerable amount of hot temperature X-rays. This is very different from the case below where even larger total energy was put into the target, less amount of hot temperature X-ray was produced (see Section 3.2).
3.2. Analysis of BX Produced at SG II Facility
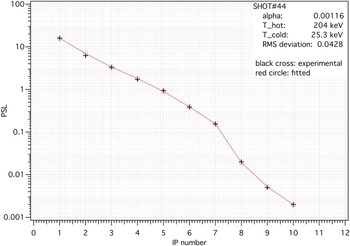
The experimental campaign is prepared in such a way that plasma jets are formed by multibeam laser system. The campaign consists of several similar topics with a common configuration of a reaction chamber but different targets and laser conditions. That is, several kinds of materials and shapes of targets are used in the experiment. Among those topics neutron generation by counter propagating plasma jets with so-called K-type targets has been published (Zhao et al., Reference Zhao, Zhang, Yuan, Chen, Li, Fu, Rhee, Li, Zhu, Li, Liao, Zhang, Han, Liu, Huang, Ma, Li, Xiong, Huang, Fu, Zhu, Zhao and Zhang2015). Hence details of experimental setup can be found in that paper and we just briefly describe the system here. In the experiment eight laser beams of long pulse (1 ns) and an additional 30 ps probe beam of 30 mJ have been used. The probe laser beam is supposed to have no effect on the BX generation and is only for measuring the shadowgram and interferogram, so that the energy level of it is maintained as low as possible. The result of analysis is shown in Table 3. The RMS deviations in this experiment are rather larger compared with those of TITAN laser. The larger error may be ascribed to irregular shapes of the targets and multiple laser beams.
Analysis of BX data obtained at SG II facility.

As is anticipated, since there is no short-pulse laser beam to generate hot electrons, there is very few (<0.1%) of hot temperature X-rays that would have been produced if for hot electrons. Figure 7 shows the result of tomographic reconstruction. From this analysis, 99.9% of the X-rays in this example (shot number 44) have the slope temperature of 25.3 keV. And the RMS error of the fit is about 4.3%.
Data corresponding to K-type target: 2 beams out of 8 beams of SG II laser system are focused onto the upper part of right hand side of K-type target and another 2 beams onto the lower half of the right hand side of K-type target. Remaining 4 beams are on the left hand side of K-type target in the same way. The surface of the K-type target (Cu) is covered with CD (deuterated polystyrene) thin film to generate the collimated plasma jet from each side of K-type target facing each other. It turned out that the yield of DD (deuterium-deuterium) fusion neutrons is enhanced by the collision of those counter propagating plasma jets. Figure shows the best fit of the PSL of each IP for the optimum set of alpha, T HOT, and T COLD.

3.3. Analysis of BX at Petawatt Laser Facility of CoReLS/IBS
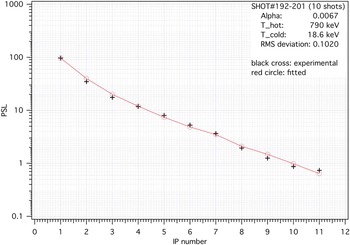
The purpose of this campaign is to investigate the acceleration of protons by using a femto-second petawatt laser beam. The laser system delivers 30 fs laser pulses with an 800 nm wavelength. A double plasma mirror (DPM) system is used to maintain the temporal contrast better than 10−11 up until 10 ps earlier than the main pulse. The laser pulse is focused with an f/3 off-axis parabolic mirror with an incidence angle of 30o with respect to the target normal. The focal spot size is 4.2 µm and the energy concentration is 25% in the full width at half maximum area. The total reflectivity of DPM system is 32%, resulting in the available energy of laser pulse on the target surface being 8.5 J and the peak intensity being 6 × 10²⁰W/cm2. Two kinds of target materials are used; the first one is a disk of TiO2 nanotubes, the diameter and length of which are roughly 100 nm and 2 µm, respectively, and the second one is a disk of porous Ag foams, with its size ranging from 0.1 to 5.0 µm. For these targets it seems that there is not enough distance for hot electrons to travel to generate BX. To measure the BX in the campaign, we use an auxiliary chamber that contains a FSS and a gate valve between the main chamber and the auxiliary chamber. We open the gate valve before the first shot of laser beam and make 10 laser shots onto the target surface successively in series in about 5 min interval each. Then we close the gate valve. Accumulated response signals for those 10-shots are analyzed for TiO2 nanotube target and for Ag porous target, respectively. The X-rays are measured in a reflection mode; that is, angle between the incident laser beam and emitted X-ray is 60° in the same side of the target plane. Figure 8 shows the spectral reconstruction results for Ag porous target.
Lead (Pb) gate valve in front of the FSS detector was open during 10 successive laser shots to accumulate the response on FSS and closed immediately after the shots. Figure shows the best fit of the PSL of each IP for the optimum set of alpha, T HOT, and T COLD.

Table 4 summarizes the results of calculation. The PSL value for the Ag porous is about 100, which is larger than that of TiO2 nanotube target, which is about 20. However the TiO2 target turned out to produce relatively more of hot temperature X-rays with lower RMS error than Ag target. The reason for this difference may be due to the different structures of targets in addition to the different material characteristics.
Optimum sets of (α, T HOT, T COLD) for the BX data obtained at CPW of CoReLS/IBS.

Similar measurements have been made for very thin conjugated polymer targets (Choi et al., Reference Choi, Kim, Pae, Nam, Lee, Yun, Kim, Lee, Yu, Sung, Pirozhkov, Ogura, Orimo, Daido and Lee2011) where the thickness is about a few tens of nanometers. In this case no hot temperature part could be determined in this method, implying that there might not have been enough collisions of electrons with plasmas to produce high-energy X-rays.
4. DISCUSSIONS
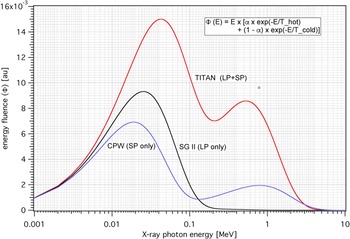
The spectral distribution we obtained in the above discussion is of the number distribution of X-ray photons based on the absorption and transmission spectral characteristics of MS type IP. To get the energy fluence of the X-rays we should multiply that number of photons with the actual energy. Figure 9 shows the actual energy spectrum of the above examples.
Energy spectra of X-rays emitted in each of the campaigns at TITAN (shot #32), SG II (shot #44), and CPW (shot #192–201). LP means long pulse with a few nanoseconds (ns) and SP means short pulse with a few picoseconds (ps) or femto seconds (fs).

It can be seen that TITAN and CPW lasers generate the hot temperature X-rays, whereas in SG II campaign no noticeable hot temperature X-ray is generated. The thickness of targets at CPW campaign is order of tens of nanometers and consequently we can think that not much of high-energy X-ray can be generated due to short travelling distance of electrons.
In order to draw proper conclusions from this tomographic reconstruction method, the number and materials of filters should be appropriate such that the response spectrum of FSS should cover the spectral range of incoming X-rays. This can be confirmed by the fact if the recorded signal on the last IP is faint enough comparable with the background signal of that imaging plate. Otherwise we have to use more filters of appropriate materials. If we want higher accuracy, we may make larger/finer tables of absorption data of filter materials. If we want more precisions then we can use finer grids of (α, T HOT, T COLD).
In the experiment we put the FSS detectors in one or two positions with an assumption that the energy spectrum of the emitted BXs from the laser-produced plasma is not much varying against the direction from the source under LTE condition, although the absolute intensity may vary. Then this method is immune to the directions or positions of the detectors. This is not fully confirmed yet and should be verified in the future, by placing more identical FSS detectors at several different directions and positions.
The rear side of the FSS detector should be properly blocked as well to prevent the stray or reflected light from ambient structures from entering into the FSS from rear side. Also it should be carefully checked if any electrons or ions from the plasma would come into FSS.
To draw any information about the other plasma properties such as electron/ion distributions and temperatures, which may strongly depend on the specific arrangements of the experimental systems such as lasers, targets, diagnostic devices, and so on, we need to take the real experimental situation into account, in addition to the analysis described above.
5. CONCLUSION
We introduce an alternative new method to analyze the BX data obtained by using FSS detectors. By determining one set of parameter values, (α, T HOT, T COLD), among about one million sets of parameters, which makes the trial exponential function with two-temperature components minimum with respect to the RMS deviation, we can reproduce the BX spectrum. In determining the values we employ the concept of tomographic reconstruction in the spectral domain and the variational principle for minimization. That is, we choose a set of parameters, which minimizes the RMS deviation of the ratios of measured values to the fitted values of the response on each imaging plate, among millions of sets of those three parameters.
We applied this method to the data obtained in three different experimental campaigns, such as those carried out at TITAN Laser facility of LLNL, at SG II Laser facility of SIOM, and at Petawatt Laser Facility of CoReLS/IBS. From the comparison we can notice that the short-pulse laser beam can generate the high-temperature component in X-rays through hot electron production, whereas with long-pulse laser beam only we just produce low temperature component in spite of far larger laser beam energies.
It can be concluded that we can apply this new method to those experimental situations where hard X-rays ranging from about 1 keV to 10 MeV are generated, to get the plasma properties where continuous spectra of BXs cannot be directly measured.
ACKNOWLEDGMENTS
The authors would like to thank all the staffs and technical persons who had taken care of the laser systems in TITAN facility of LLNL, SG II facility of SIOM, and Petawatt Laser Facility of CoReLS/IBS. This work was partly supported by the Global R&D Networking Program (NRF-2012-0004839) funded by the Republic of Korea's Ministry of Science, ICT and Future Planning.