Introduction
The distributions of macroparasite infections in populations of their final hosts are almost invariably overdispersed. With very few exceptions (e.g. Luong et al., Reference Luong, Vigliotti and Hudson2011), parasite burdens are unequally distributed such that a majority of individuals in host populations carry few or no parasites while a minority carry many parasites (e.g. Crofton, Reference Crofton1971; Anderson and May, Reference Anderson and May1978; Shaw and Dobson, Reference Shaw and Dobson1995; Shaw et al., Reference Shaw, Grenfell and Dobson1998; Wilson et al., Reference Wilson, Bjornstad, Dobson, Merler, Poglayen, Randolph, Read, Skorping, Hudson, Rizzoli, Grenfell, Hesterbeek and Dobson2002). Factors contributing to this aggregation include heterogeneity in processes affecting transmission (for instance, variations in the environment, temperature, distribution of infective stages); variation in host characteristics (sex, age, resistance, behaviour); and variation in parasite characteristics (especially infectivity/compatibility interactions with the host) (Warburton and Vonhof, Reference Warburton and Vonhof2018). The relative importance of these and related factors is difficult to assess and is likely to vary across different host–parasite associations. While major variation in invasion success can be attributed to environmental factors and chance, studies on a range of natural systems, mainly helminths in mammals, have highlighted the role of genetic factors influencing parasite susceptibility in different host individuals (Smith et al., Reference Smith, Wilson, Pilkington and Pemberton1999; Kemper et al., Reference Kemper, Palmer, Liu, Greeff, Bishop and Karlsson2010; Turner et al., Reference Turner, Begon, Jackson, Bradley and Paterson2011).
The system on which this account is based provides a means of controlling for several of the key heterogeneities inherent in most host–parasite populations. Previous studies at fish farms have documented the transmission ecology of the monogenean Discocotyle sagittata infecting rainbow trout, Oncorhynchus mykiss (Gannicott, Reference Gannicott1997; Tinsley, Reference Tinsley2004; Rubio-Godoy and Tinsley, Reference Rubio-Godoy and Tinsley2008a, Reference Rubio-Godoy and Tinsley2008b and references). The present investigation takes advantage of exceptional circumstances at one farm where fish production was reduced over successive years but the stock in a single pond was retained while other adjacent ponds became empty. By the time of our study, this cohort of fish had been maintained in isolation and without intervention relating to helminth infection for 9 years, reaching a body size and age unusual for aquaculture practice. The only source of continuing infection with D. sagittata was internal, within the single pond. All hosts were the same age and, potentially, had the same experience of infection circulating within a simple, clearly-defined habitat; all were subject to the same major environmental variables including physico-chemical characteristics, water flow and temperature. In many studies of parasite distributions, it is uncertain whether the lack of infection may reflect successful elimination of previous infection or freedom from exposure to invasion (i.e. ‘luck’). Equally, low worm burdens might reflect low infection pressure or partial host resistance. In this system, these ambiguities were removed: previous work at this farm demonstrated that all fish become infected by D. sagittata; prevalence reaches 100% during the first and second years for each host cohort with a progressive increase in intensities with time (Gannicott, Reference Gannicott1997; Rubio-Godoy and Tinsley, Reference Rubio-Godoy and Tinsley2008a, Reference Rubio-Godoy and Tinsley2008b). Transmission is focused each year into a period of about 6 months when water temperatures are above 10 °C (Gannicott and Tinsley, Reference Gannicott and Tinsley1998a; Rubio-Godoy and Tinsley, Reference Rubio-Godoy and Tinsley2008b), so a distinctive feature of this study is that all hosts will have experienced repeated annual challenges throughout life – in this case 9 years. Another attribute of the Discocotyle–Oncorhynchus system is that age post-infection (p.i.) of all parasites can be determined from the developmental stages of the attachment organ, the haptor, on which sclerotized clamps form according to a defined chronology (Gannicott, Reference Gannicott1997; Rubio-Godoy and Tinsley, Reference Rubio-Godoy and Tinsley2002). This means that analysis of worm burdens can take account of the length of time for which each worm has been established on its host.
Infection by this blood-feeding parasite has the potential for lethal pathology (Gannicott, Reference Gannicott1997; Rubio-Godoy and Tinsley, Reference Rubio-Godoy and Tinsley2008a): high worm burdens cause severe anaemia. Host death may occur during periods of elevated water temperatures (⩾20 °C) from a combination of increased blood removal by parasites, increased oxygen demand by hosts, reduced blood oxygen carrying capacity and depleted oxygen concentrations in the water. Field and laboratory studies have shown that O. mykiss develops partial immunity to D. sagitatta and a series of host factors may be involved in parasite elimination (Rubio-Godoy and Tinsley, Reference Rubio-Godoy and Tinsley2004; Rubio-Godoy et al., Reference Rubio-Godoy, Sigh, Buchmann and Tinsley2003a, Reference Rubio-Godoy, Sigh, Buchmann and Tinsley2003b, Reference Rubio-Godoy, Porter and Tinsley2004).
Fish farms provide an arena for epidemiological studies in which host populations are managed with respect to food supply, habitat and environmental needs but free-running with respect to parasite population ecology (especially at this study site because of the absence of measures to control D. sagittata). The unusual circumstances of this host population and the background of information on transmission ecology prompt a series of expectations regarding patterns of parasite distribution. Previous studies have consistently recorded a high degree of overdispersion, with aggregation increasing in each successive host age class (Gannicott, Reference Gannicott1997; Rubio-Godoy and Tinsley, Reference Rubio-Godoy and Tinsley2008a). But, several factors might predict a reduction in heterogeneity in this present dataset. Thus, density-dependent host mortality (from parasite-induced anaemia) should progressively eliminate more susceptible host individuals; the repeated annual challenges over a period of 9 years should select for a relatively uniform high level of exposure-related immune responsiveness; the single host age class should control for age-related influences (including increasing acquired immunity or, alternatively, decreasing immune competence through senescence); and the relatively simple habitat structure – a single rectangular pond – should reduce major variation in exposure. The ability to map age onto the parasite developmental cohorts also enables comparison of distributions of infection levels separately for recently-invaded worms (whose interaction with the host is limited to days or weeks) and for established adult worms (interacting over a life span potentially measured in years). It might be predicted that age-specific parasite distributions would differ: new recruits might tend towards a Poisson distribution (determined primarily by random events in invasion) while adults might be more overdispersed (influenced by variation in host control of infection). This investigation was designed to follow these and other scenarios, aiming to produce empirical data on factors that contribute to, and potentially perturb, the almost universally-observed aggregated distributions of helminths in host populations.
Materials and methods
Fieldwork
The study was based at a fish farm on the Isle of Man that reared rainbow trout for stocking a sport angling lake and commercial sale (described as Farm 1 by Rubio-Godoy and Tinsley, Reference Rubio-Godoy and Tinsley2008b and references). Infections of D. sagittata have been investigated here since the late 1980s (Ph.D. theses by Ronga, Liverpool University, 1993; Gannicott and Rubio-Godoy, both Bristol University, 1997 and 2004) with 15 publications documenting life cycle adaptations, population ecology and immune interactions (including references below). A succession of age classes of intensively-reared O. mykiss was originally maintained in a sequence of nine ponds. Overall production was progressively reduced from the early 2000s, and as stocks were removed from each pond, these were left vacant. A single cohort was retained in one pond, as described above, and experienced a standard maintenance and feeding regime. Over this period, these fish were not moved to other ponds and no fish were added to the cohort from elsewhere, so cycling of D. sagittata was entirely internal within the pond. The trout population was monitored with twice-yearly health inspections required by the Department of Agriculture, Fisheries and Forestry (Isle of Man Government).
Laboratory procedures
Sampling was carried out on 28 November 2012 with fish taken at random from the pond, anaesthetized and killed for disease surveillance unrelated to the present study. The gills were removed from 20 fish for studies on D. sagittata: gill arches were fixed intact in tubes of 10% formol saline, one arch per tube, and subsequently examined in petri-dishes of water with a stereo zoom microscope and high-intensity illumination. Worms were counted, transferred to a dish of clean water and examined at higher magnification to determine the number of pairs of clamps developed on the haptor. A series of studies (including Gannicott, Reference Gannicott1997; Rubio-Godoy, Reference Rubio-Godoy2008) and experience of many hundreds of other dissections (unpublished) have shown that there is no significant difference in the numbers of D. sagittata attached to the right and left sides of the gill apparatus. Therefore, further analysis was based on recovery of worms only from the left side of each fish with the counts multiplied by 2 to record total worm burden.
Determination of parasite population age structure
Interpretation of the chronology of parasite development and hence age structure relies on the characteristic of D. sagittata that all life cycle events are strictly regulated by temperature (Gannicott and Tinsley, Reference Gannicott and Tinsley1997, Reference Gannicott and Tinsley1998a, Reference Gannicott and Tinsley1998b; Tinsley, Reference Tinsley2004). Transmission is negligible at water temperatures below 10 °C (typically from November) and resumes in late spring/early summer as temperatures again cross the 10 °C threshold (typically early June). Worm burdens increase progressively from June to October and prevalence is typically 100% by autumn, confirming that all fish experience infection each year in the confined farm habitats (Gannicott, Reference Gannicott1997; Rubio-Godoy and Tinsley, Reference Rubio-Godoy and Tinsley2008a). Parasite life span can exceed 3 years (unpublished laboratory studies).
Parasite age was estimated from the sequence of developmental stages p.i. in which sclerotized clamps form on the haptor. Infective larvae initially attaching to host gill lamellae have one pair of clamps; during body growth, a second, third and finally a fourth pair of clamps develop; after this, worms reach sexual maturity and begin producing eggs. Laboratory experiments at 13 °C show that the most advanced worms in each cohort complete formation of the second pair of clamps after about 5 weeks, the third after about 7 weeks, the fourth after about 9 weeks and egg production by adults begins from 11 weeks p.i. (Gannicott, Reference Gannicott1997). However, the timing of these changes shows variation even at a constant temperature, probably influenced by factors including parasite density, pre-existing infection and host responses, and the median time for each developmental stage may be around 2 weeks longer. During each interval between additions of clamps, the next pair of developing clamps becomes visible alongside the previous, so greater precision can be gained by subdivision of clamp stages into 1.5, 2.5 and 3.5 (e.g. Rubio-Godoy and Tinsley, Reference Rubio-Godoy and Tinsley2002). These discrete morphological stages were used to interpret the chronology of infection.
Statistical analysis
Statistical analyses were completed in R version 3.4.2 ‘Short Summer’ (R Development Core Team, 2017).
The arithmetic mean number of parasites per host, variance and range were calculated for each parasite age class and total parasites. The corrected moment estimation method was used to estimate k, the aggregation parameter for the negative binomial distribution, and the index of dispersion. Lower values of k indicate greater aggregation. The index of dispersion was compared against a χ 2 distribution with n−1 degrees of freedom to test for significant deviation from a random distribution (Wilson et al., Reference Wilson, Bjornstad, Dobson, Merler, Poglayen, Randolph, Read, Skorping, Hudson, Rizzoli, Grenfell, Hesterbeek and Dobson2002). Zero values were excluded in calculations of mean intensity of infection.
Distributions of infection levels were compared with the statistical Pareto pattern widely observed in disease systems – the ‘20/80 rule’ – whereby 20% of the host population is responsible for 80% of the parasite population or its transmission potential (Woolhouse et al., Reference Woolhouse, Dye, Etard, Smith, Charlwood, Garnett, Hagan, Hii, Ndhlovu, Quinnell, Watts, Chandiwana and Anderson1997). For each age class of parasites and total parasites, the number of parasites recovered from the four fish with the highest intensities of infection ( = 20% of the sample) and the four fish with the lowest intensities were expressed as a percentage of the total recovered from the entire sample. Visual inspection of the data where hosts were ranked in order of burden size suggested a series of consistent sub-divisions of the overall host and parasite populations: these comprised high, low and zero worm burdens, each with 30% of the total fish sample, together with a minor category characteristic of 10% of hosts with intensities intermediate between high and low. These subdivisions were used in further assessments of heterogeneity. Pairwise Kolmogorov–Smirnoff tests were applied to the age-structured numbers of parasites per host, using the ks.test function in R, to test for significant differences between the distributions of parasites in different age classes. A Friedman test was carried out using the friedman.test function in R to compare differences in the ranked age-structured intensity of infection between individual hosts. Kendall's coefficient of concordance was calculated post hoc using the kendall function in R package irr (Gamer et al., Reference Gamer, Lemon, Fellows and Singh2012) to test the overall agreement between age-class rankings (Holmstad and Skorping, Reference Holmstad and Skorping1998). Individual hosts were ranked based on their intensity of infection with each parasite age class using the rank function in R, where rank 1 indicated the lowest intensity of infection and rank 20 indicated the highest. The average rank was used in the case of ties. Finally, pairwise Wilcoxon tests were applied to the age-structured parasite count data, using the wilcox.test function in R, to identify pairwise differences in the ranking of individuals by parasite age class.
Results
Chronology of invasion by parasite cohorts and duration of infection
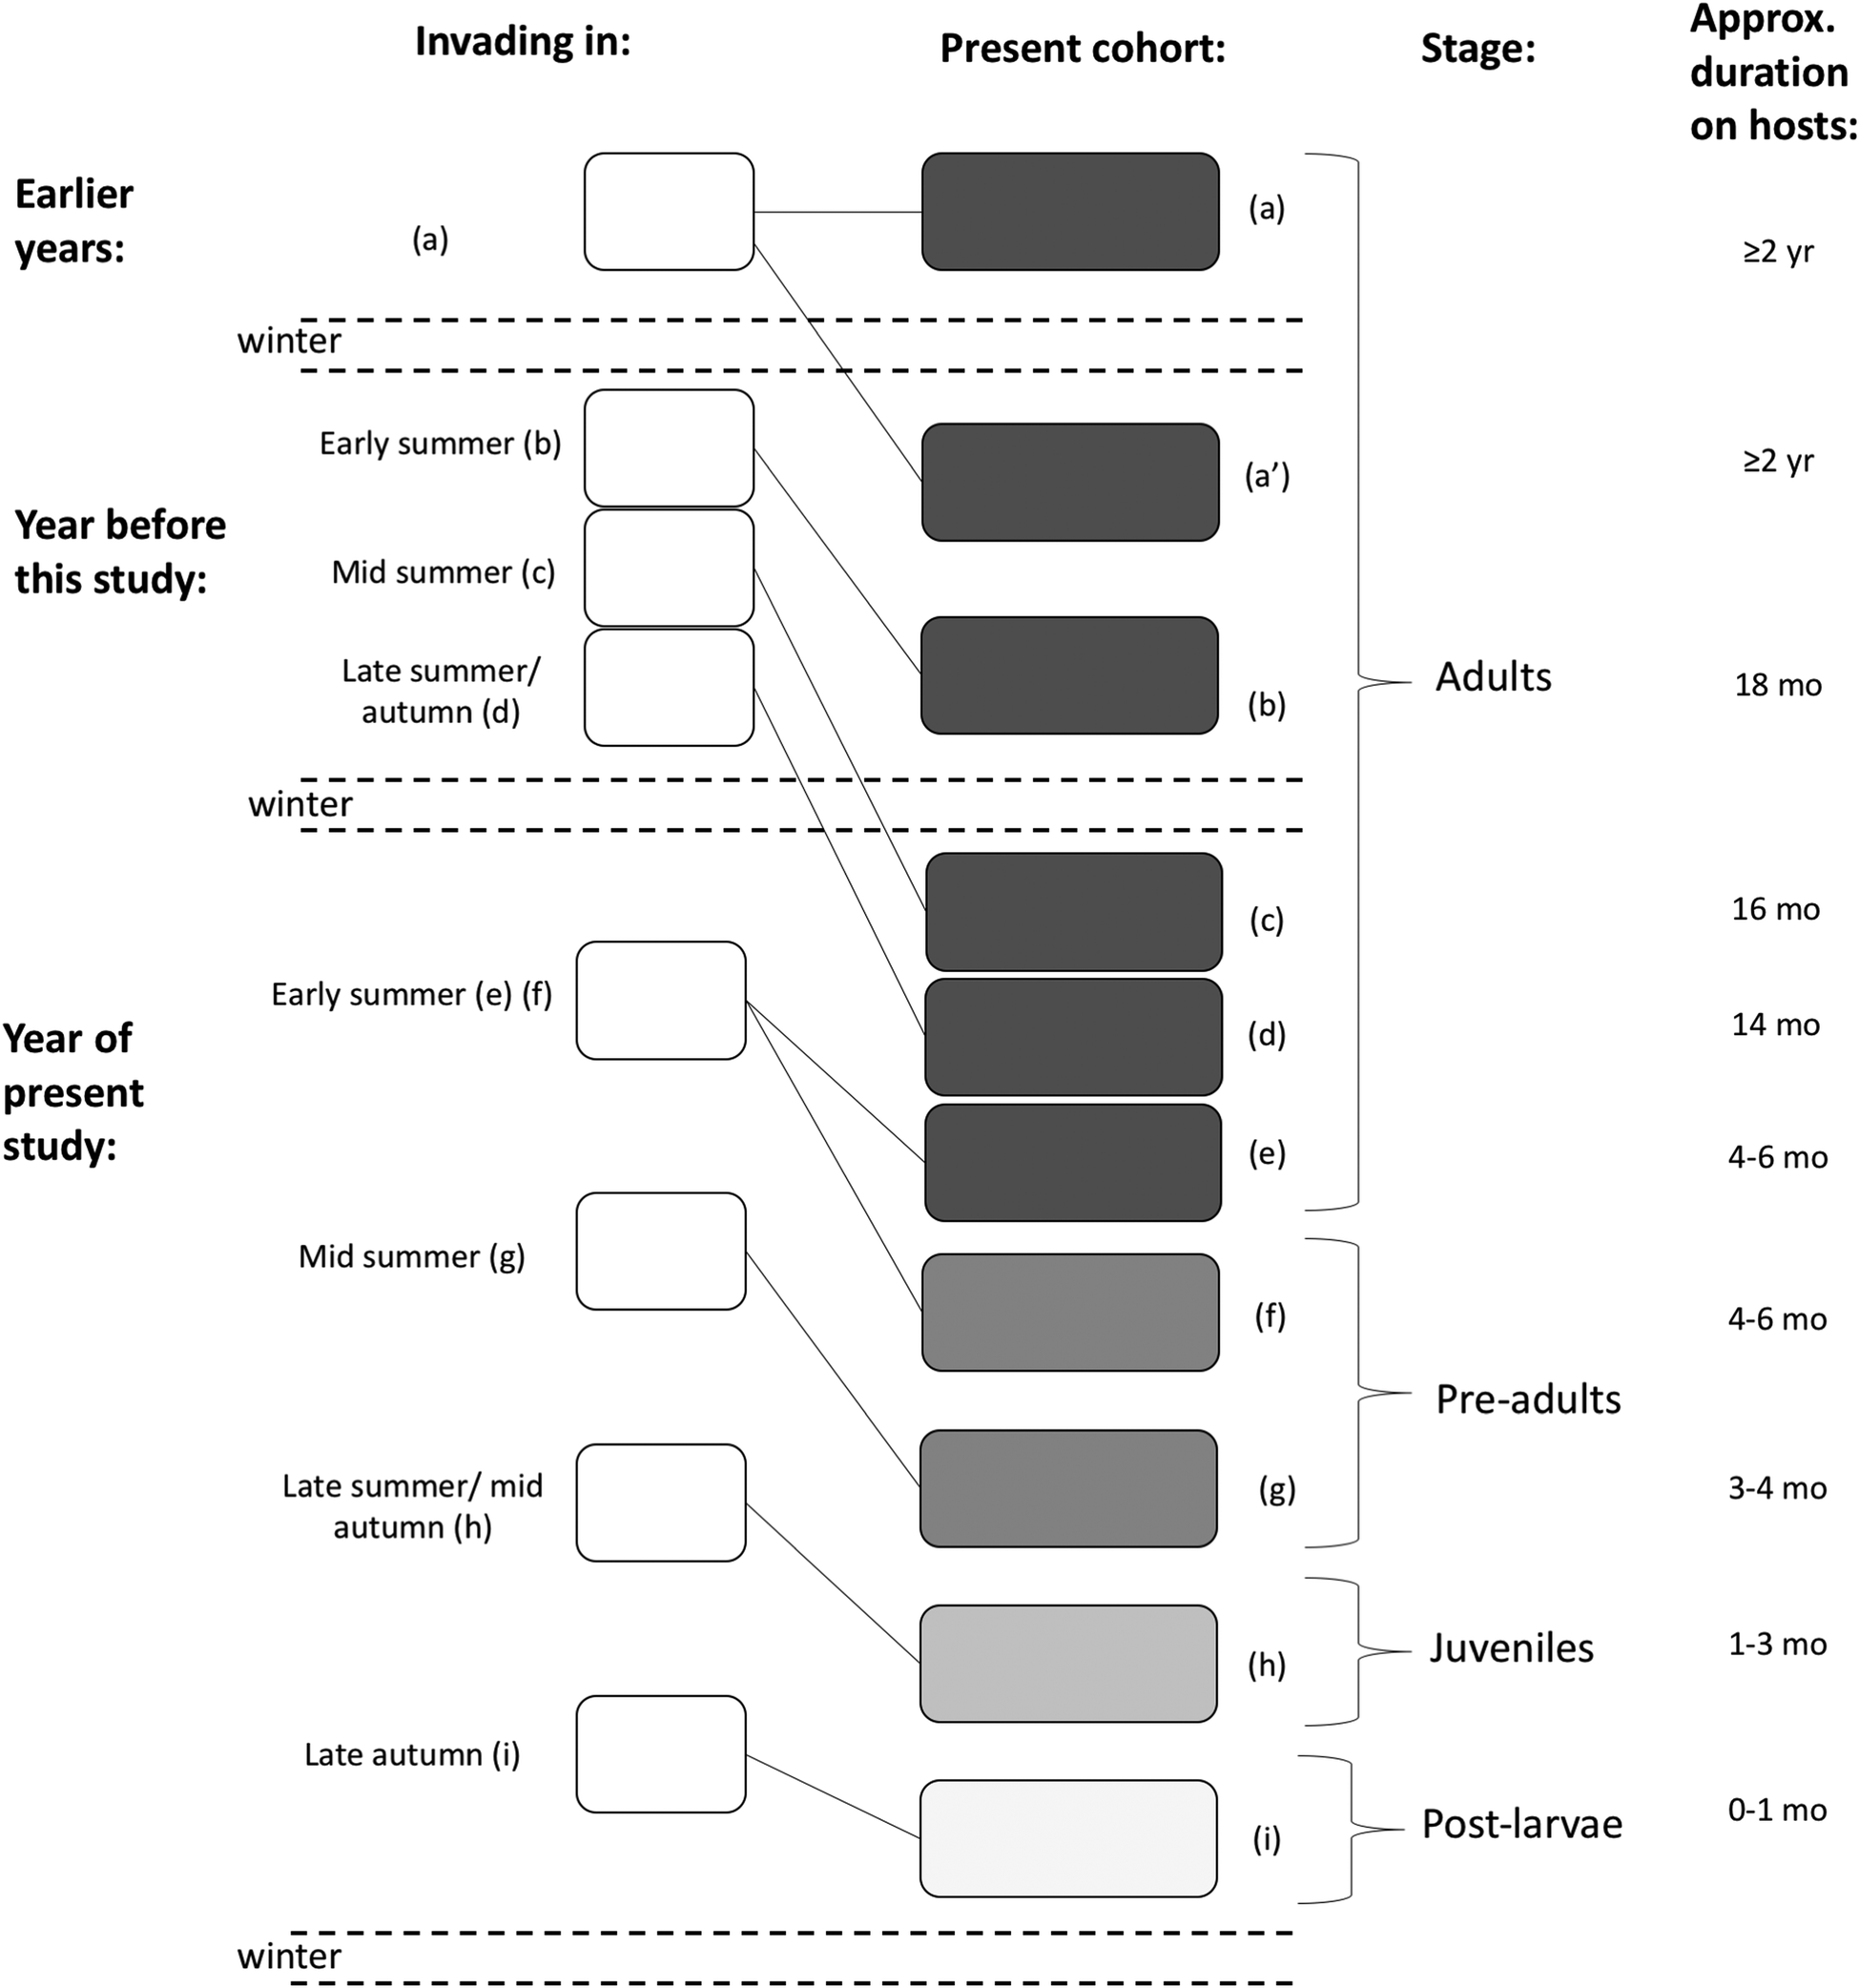
The sampling date in late November marked the end of the transmission season; further on-host parasite development would be inhibited until spring of the following year and larval invasion would be negligible until early June (occasionally late May). Therefore, this study captured the entire annual parasite recruitment, and worm burdens represented their final state for the year. The timescale for the origins of each developmental cohort (Fig. 1) is based on the rates determined in laboratory experiments, corroborated by field data from known cohorts of worms monitored during natural annual temperature cycles (Gannicott, Reference Gannicott1997; Rubio-Godoy and Tinsley, Reference Rubio-Godoy and Tinsley2008b).
Chronology of infections of Discocotyle sagitatta on rainbow trout, Oncorhynchus mykiss: schematic representation of the timeline of invasion relative to the study period, the life-cycle stages and duration of their occurrence on the hosts. Lower case letters in brackets link the parasite cohorts and their infection periods to the text (see Results).

Adult reproducing worms (Fig. 1a–e) (distinguished by four pairs of clamps on the haptor and eggs in the uterus). This cohort may have contributions from: (a, a′) worms present on the hosts for several years (potentially 3 years or more); (b) worms invading in early summer (mostly June to early July) in the year preceding this study, maturing within that year; (c) invasions in mid-summer (July to early August) in the year preceding this study, overwintering as developing pre-adults and then completing maturation in early summer of the study year; (d) invasions in late summer/autumn preceding the study year, reaching only juvenile stages (two or three pairs of clamps) before low-temperature inhibition, resuming development in spring of the study year and becoming adult in mid/late summer; (e) invasions in the first few weeks of the study year (mostly June to early July) and reaching maturity before the decline in autumn temperatures (i.e. becoming adult in September and October of the study year). Thus, component groups (a), (b), (c) and (d) comprised worms that had passed through at least one winter on the host population; group (e) will have developed on their hosts for only part of the study year without experiencing winter conditions. The period of occurrence on the host population may therefore range from a minimum of 4 months up to a maximum of several years (Fig. 1).
Pre-adult parasites (four pairs of clamps but no eggs in utero) had their origins within the summer of the study year. These include (Fig. 1f) worms invading at the start of transmission (June through July) but with slower development than those able to mature within one season (e, above); and (Fig. 1g) invasions around the peak of summer water temperatures (late July/early August) for which even fast-developing worms do not mature before November [i.e. equivalent to (c) above, but 1 year younger]. The total duration of infection by this cohort would have been about 3–6 months at the time of sampling.
Juvenile worms (1.5–3.5 pairs of clamps) (Fig. 1h) all had origins at or after the maximum summer temperatures in the study year (mid-August to early/mid-October). These worms would not complete development until mid/late summer following the study year [i.e. equivalent to (d) above, but 1 year younger]. The end of invasion was followed by a further 1 month of development until the present sampling date, hence the total duration of infection on the host population would have been about 1–3 months.
Post-larval worms (one pair of clamps) (Fig. 1i) represented recent invasions (mostly in late October but perhaps also the final hatchings of infective larvae in early November). Worms in which the second pair of clamps were beginning to develop were excluded from this category so it represents the minimum period post-invasion (p.i.) that can be pin-pointed conclusively. This stage would typically be expected to be 0–2 weeks p.i. at 13 °C (Gannicott, Reference Gannicott1997); however, declining water temperatures at the time of this study would have begun to inhibit transmission and development, so the period of interaction with the host may have been extended to 0–4 weeks.
This reconstruction of the infection history of the successive parasite age cohorts in the present sample (Fig. 1) shows wide variation in duration (i.e. the period of interaction with the host) and in environmental conditions during the infection (including temperature which has an important influence on the host immune response).
Distribution of worm burdens across the host population sample
All worms
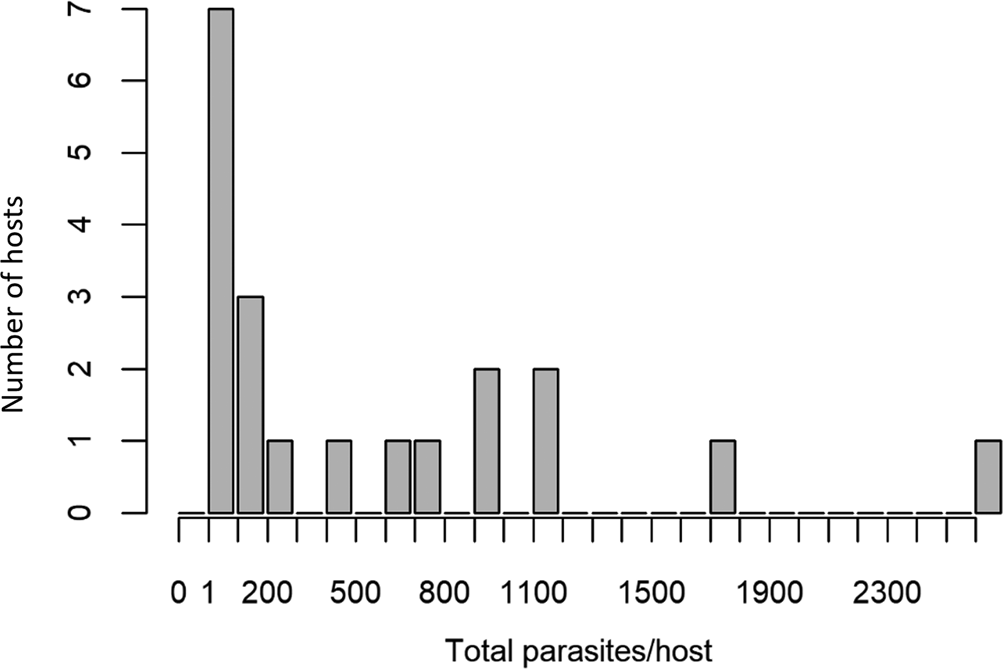
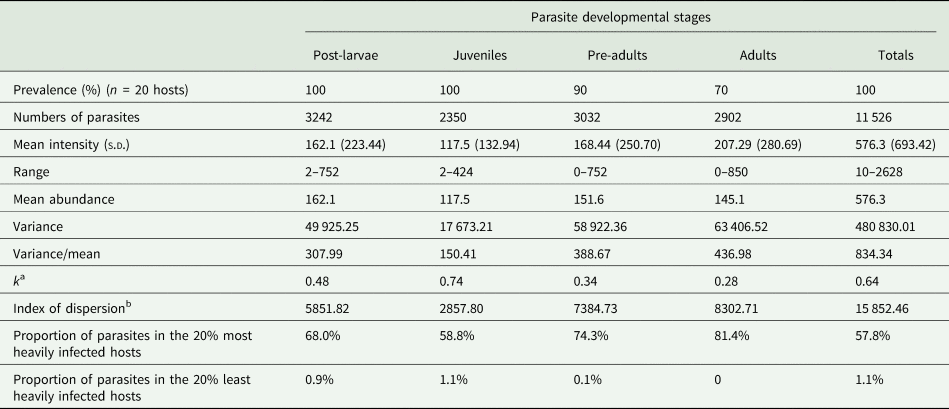
Prevalence of infection was 100%, with a range of intensities 10–2628 (mean 576) worms/host (Table 1). The frequency distribution of worm burdens was highly skewed (Table 1, Fig. 2), with k = 0.64. All indices of dispersion were significantly different from a random distribution (P < 0.005; Table 1). The 20% (n = 4) of fish with the highest intensities of infection supported 58% of the overall parasite population (i.e. 6666 worms out of the total of 11 526 worms). These four fish each carried >1000 worms/host. The 20% of fish with lowest intensities (10–58 worms/host) carried only 1% of the total observed parasite population. This pattern was consistent across parasite age classes (Table 1).
Frequency distribution of total parasites (all developmental stages) in the host population sample (n = 20 fish, n = 11 526 worms). For summary statistics and measures of aggregation see Table 1.

Infections of Discocotyle sagittata in Oncorhynchus mykiss: summary of population data

a Corrected moment estimate.
b All P < 0.005, significantly different from a random distribution.
The total worm burdens represent invasion and establishment following a life-time exposure of 9 years (Fig. 1). Sub-division of these populations into distinct developmental cohorts with known chronology provides a more dynamic view of the composition and timescale of infection. Figure 3 shows the frequency distributions of worm burdens in the four age/stage cohorts defined above and in Fig. 1.
Frequency distributions of the successive age classes of parasites in the host population sample: (A) adult parasites (n = 2902); (B) pre-adults (n = 3032); (C) juveniles (n = 2350); (D) post-larvae (n = 3242, defined in Fig. 1 and text, ⩽1 month p.i.). Prevalence of infection is 100% for post-larval and juvenile stages (bottom two panels), but pre-adult and adult parasites were absent from 10 to 30% of hosts (top two panels). For summary statistics and measures of aggregation see Table 1.

Age-specific worm burdens
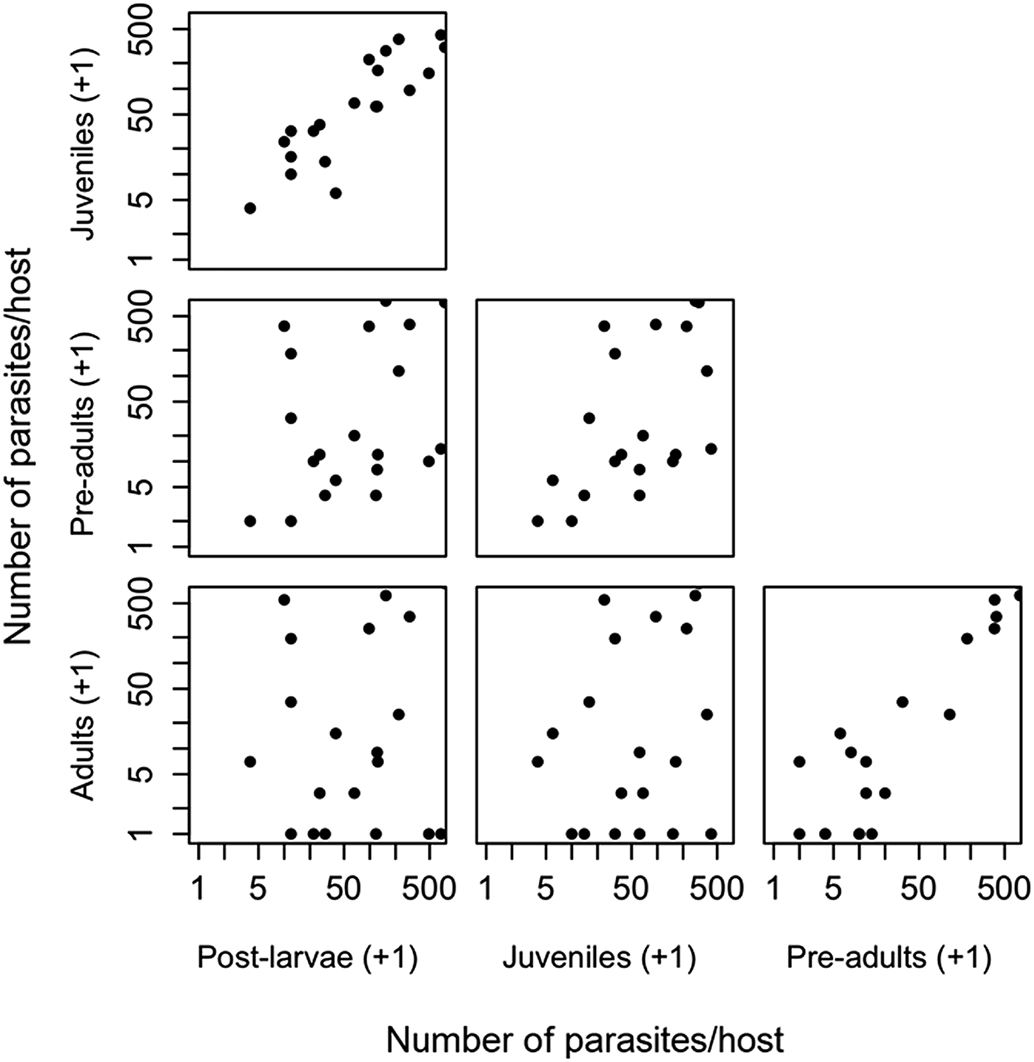
Prevalence was 100% for the two most recently-invaded parasite age classes (post-larvae and juveniles: Fig. 3D and C) and was lower for pre-adults (90%) and adults (70%) (Fig. 3B and A). Adult parasites represent infections acquired (and still surviving) during a period potentially of up to several years. Mean intensity was highest in this cohort (207 adult worms/infected fish) but worm burdens were also relatively high for post-larvae (mean 162/host), resulting from exposure for no more than 4 weeks and for pre-adults (mean 168/host) reflecting invasion during <3 months (Table 1). Worms in all four age cohorts were highly aggregated, with aggregation estimated using the k value greatest in the pre-adult and adult age classes (Table 1). The 20% most heavily-infected fish carried 59–81% of the total worms within each age class, while the 20% least heavily-infected individuals supported 0–1.1% of the worms within each age class (Table 1). Pairwise comparisons (Fig. 4) indicated that there was no significant difference in the distributions of the different age classes, with the exception of post-larvae and adults which differed significantly (D = 0.45, P = 0.03) and juveniles and adults which approached significance (D = 0.2, P = 0.08; Table 1).
Pairwise comparison of the age-structured parasite burden of individual hosts. Axes values show untransformed numbers of parasites of each age class, but the spacing of tick marks on the axes represents a logarithmic scale. The distributions of age-structured data were not significantly different, with the exception of the adults and post-larvae (P = 0.03; Table 2) and adults and juveniles (approaching significance, P = 0.08; Table 2).

Results of pairwise statistical tests on the age-structured data to test for significant differences in the distribution of each age class (D = Kolmogorov–Smirnoff test) and pairwise differences in the ranking of individuals by parasite age class (V = Wilcoxon Signed-Rank test)

Sub-divisions of the host and parasite populations
The extent of aggregation in the age-specific cohorts is illustrated by the proportions of the parasite populations carried by various fractions of the host population sample. The 20/80 division provides a conventional view of heterogeneity enabling comparison with other host–parasite systems; in addition, visual inspection of the frequency distributions indicates that the host population falls naturally into four sub-divisions defined by their worm burdens and separated by clear changes in respective levels of infection. Comparisons of these sub-divisions are informative for understanding differences in infection levels in this fish – monogenean system. The relationships that emerge in terms of relative burden sizes are highly consistent across the parasite age/stage classes (Fig. 3 and Table 1).
Adults
On the left of the frequency distribution shown in Fig. 3A, six fish (30% of the sample) carried no adult parasites and a second distinct group, also of six fish, carried <15 worms/host. Taken together, this 60% of the host population sample supported only 38 adult worms – 1.3% of the overall total of 2902 adults. Alongside these, a third sub-division of the adult cohort comprised two fish with low/intermediate burdens of 24 and 34 adults/host. A clear break in the range of intensities separated these from a fourth sub-division of heavily-infected hosts (on the right of Fig. 3A) with worm burdens of 192–850 worms/host. This also comprised six hosts, carrying a total of 2806 worms representing 96.7% of the entire adult parasite population on 30% of the host population.
Pre-adults
The distribution of pre-adult worm burdens closely paralleled the data for adults. Using the same categories, 30% of hosts on the left of the distribution (Fig. 3B) carried 0–6 pre-adult worms, 0.46% of the total population; another 30% each carried 8–18 worms, so this combined 60% of the host sample supported 2.6% of the overall total number of pre-adults. The six most-heavily-infected hosts (on the right of Fig. 3B) carried a total of 2810 worms, i.e. 92.7% of the parasite population on 30% of the host population. Between these ranges, two fish had burdens which were intermediate in the overall rank order of burden sizes with 30 and 112 pre-adults/host: these were the same two individuals that carried the intermediate burdens of adults (above).
Juveniles
The six hosts with smallest burdens carried 2–22 worms, total 62 (2.7% of the population of this stage class in 30% of hosts), the six largest burdens comprised 1762 worms (75% of the parasite population in 30% of hosts) including the three hosts at the extreme right hand of the frequency distribution (Fig. 3C) with a total of 1106 worms.
Post-larvae
In line with previous comparisons, inequality is emphasised by the six lightest burdens that comprise ⩽20 worms/host, total 60, while the six heaviest carry a total of 2574 parasites, including three with a total of 1916 parasites. These lowest and highest 30% of burdens comprise 1.9 and 79.4% of the overall total population of post-larvae.
Between-host and within-host comparisons of parasite infrapopulations
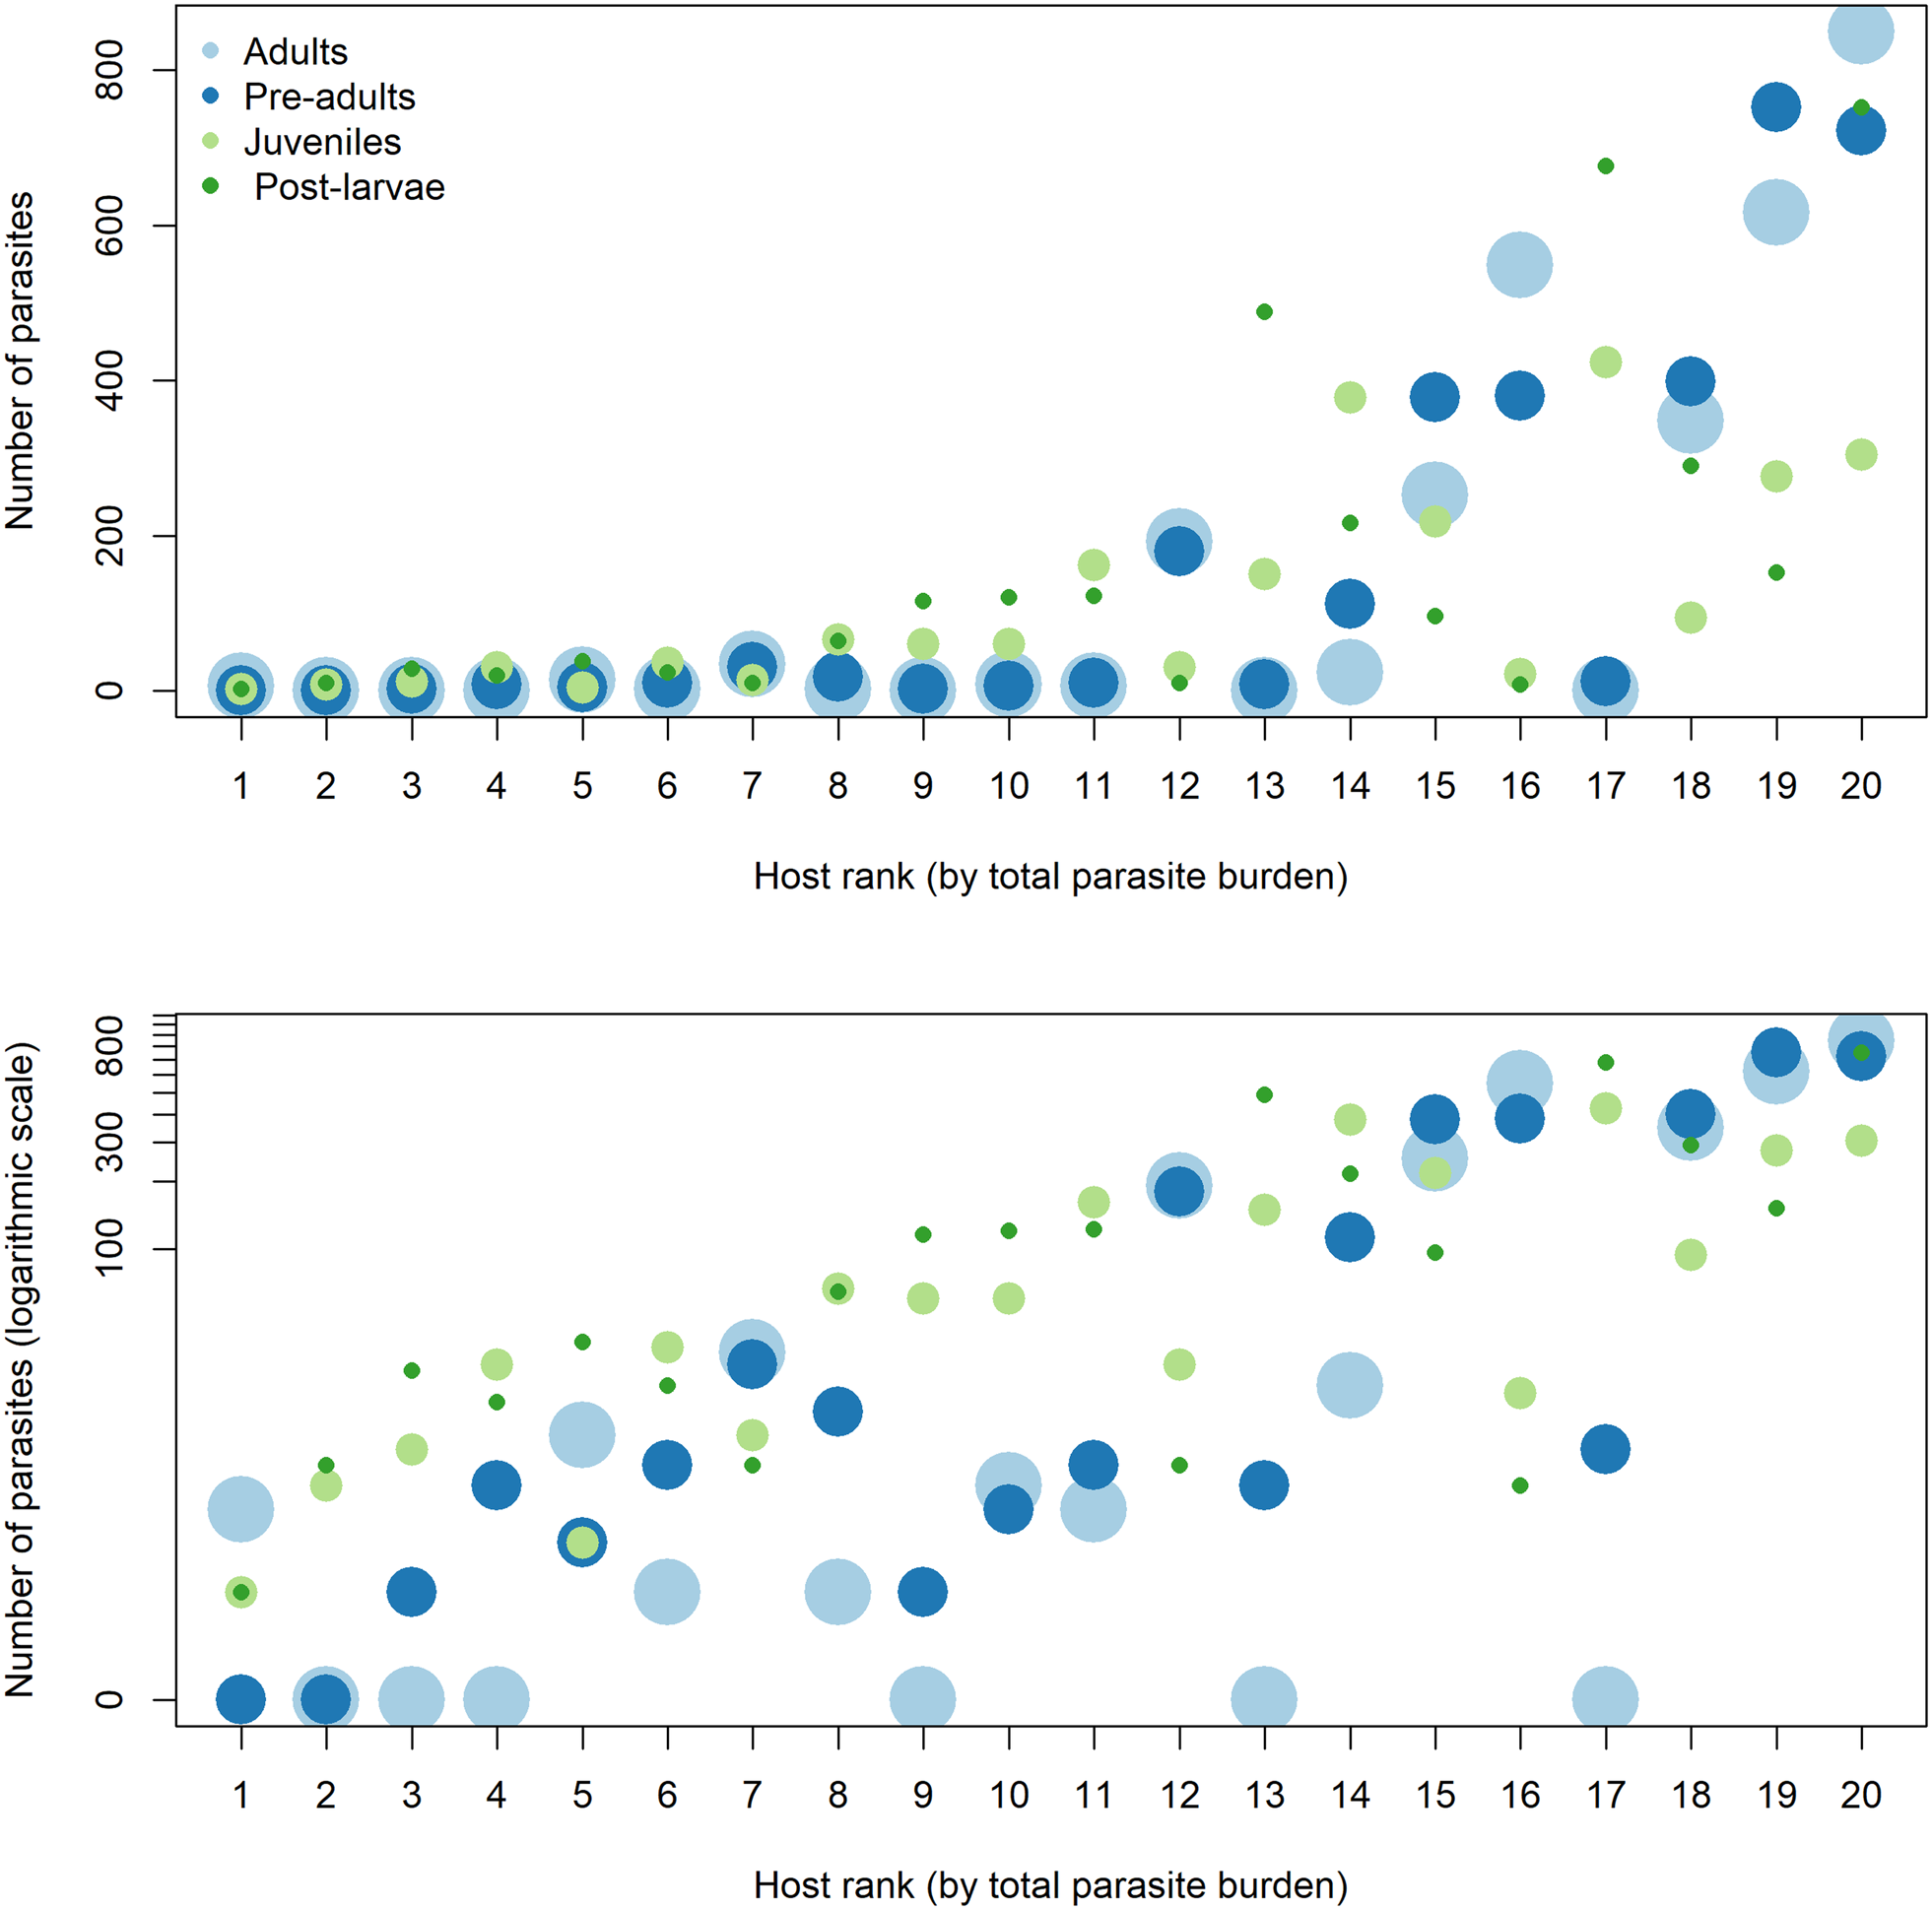
Comparing across the host population sample and across the constituent age classes of parasites within each burden, infections of D. sagittata were highly consistent for each host. Based on the sub-divisions of the host population by burden size (above), the six hosts that carried the highest intensities of adults (192–850 worms) were the same individuals that carried the highest numbers of pre-adults (180–752 worms) and the rank orders of their burden sizes were almost identical (Fig. 5; host rank 15–20). In parallel, fish comprising the 30% of the sample with low or zero intensities of adults were the same individuals with low pre-adult numbers (Fig. 5; host rank 1–6). The specific numbers of worms per host within the sub-divisions were also closely comparable between age cohorts. Thus, amongst light infections, all host individuals that had <20 adults were also infected by <20 pre-adults (ranges 0–14 and 0–18, respectively) and, with few exceptions (generally in neighbouring positions), the rank order of these worm burdens was identical.
The number of parasites of each age class harboured by the individual hosts sampled, shown on a natural (top panel) and logarithmic (bottom panel) scale. Hosts are ranked on the horizontal axis from the host with the lowest to the highest total parasite burden. The size of the points used for adult (light blue), pre-adult (dark blue), juvenile (light green) and post-larvae (dark green) parasites is for clarity only and does not reflect the number of individuals or any other numerical statistic. Hosts with the highest total parasite burden tended to have higher burdens of all age classes (and vice versa).

Overall, when the fish are ranked in order of burden size (across the range from 10 to 2628 worms/host), the intensities follow closely the same rank order for each parasite age cohort [χ 2(3) = 2.8173, P = 0.4207] and there was a significant covariance in the ranking of parasite age classes [W t = 0617, χ 2(19) = 46.9, P = <0.001]. In agreement with these consistent associations between the relative rankings of fish across the host population sample, individual hosts carried burdens of each parasite age cohort that fell more or less in the same rank order within the parasite infrapopulations (Fig. 5). There was no significant difference in the rankings when pairwise comparisons were made between age classes (Table 2; Wilcoxon tests all P > 0.3). Thus, the host individual with the highest total burden (2628 worms of all stages; rank = 20) also had the highest number of adults (850), the second highest pre-adults (722), the third highest juveniles (304) and the highest number of post-larvae (752). The fish with the lowest total burden (10 of all stages; rank = 1) had the lowest numbers of post-invasion larvae (2), juveniles (2), pre-adults (0) and adults (6).
These data suggest that the level of infection is a repeatable characteristic of individual hosts. Although there were a few exceptions to this pattern (Fig. 5), the co-variance between intensities of successive developmental cohorts on individual fish was statistically significant.
Discussion
Features of the host–parasite system
At the time of sampling – the end of the transmission season in November – four cohorts of D. sagittata could be recognized, differing in their status in population biology: adults representing successive increments in the accumulation of worms responsible for on-going transmission; pre-adults invading in early summer but failing to mature by November and not destined to transmit until the following summer; juvenile worms derived from invasions over a major part of the current transmission season but also maturing only after a delay of almost 1 year; post-larval worms representing the most recent invasions and, potentially, reflecting the force of infection during the final weeks of annual transmission (Fig. 1).
This analysis of parasite population characteristics in a controlled fish farm environment is distinctive in incorporating factors that generally have variable or unknown influence in most epidemiological studies. The hosts comprised a single age class and all had shared the same tightly-constrained environmental conditions influencing transmission. It has been established that every host individual becomes infected during each transmission season; therefore, stochastic factors affecting annual recruitment success can be excluded as an explanation for very low or zero intensities of infection. Transmission was self-contained within a single pond, cycling in the original founding host and parasite population, without distorting effects of immigration into the host population. There was no management or intervention designed to influence infection but the parasites cause high mortality when heavy burdens coincide with high temperatures. Parasite age was known and hence the timing of origin of each infection and its duration on the host individuals. The worm burdens of each host represented the endpoint of infection events accumulating over a total of 9 years.
In most studies of the dynamics of parasite distributions over time, comparing different samples from a host population, it is difficult or impossible to distinguish the effects of parasite-induced density-dependent host mortality from host-induced parasite mortality. Given the massive burdens infecting a small proportion of fish, parasite-induced host mortality may have contributed to overdispersion in the overall host population (as represented by Fig. 2). However, the main focus of this study has been a comparison of the relationships between different age cohorts of parasites across the present ‘snap-shot’ of surviving hosts.
Some logical predictions, consistent with most epidemiological experience, have not been supported. Thus, it might be expected that the unusual circumstances of this host–parasite interaction would lead towards homogeneity in infection characteristics. Pathogenicity at high intensities would eliminate the most susceptible hosts, reducing aggregation (Pacala and Dobson, Reference Pacala and Dobson1988), and direct life cycle transmission in a simple environment should reduce variation in invasion success. However, even after 9 years’ host exposure, all cohorts of worms, established over periods ranging from days up to several years, were highly aggregated. Detailed knowledge of parasite life history alongside the specific ecological conditions experienced by this cohort of relatively old fish enables potential causes of aggregation to be examined in a way rarely possible in host–parasite systems.
Causes of aggregation: potential environmental factors
Previous laboratory and field studies have shown that parasite invasion in the Discocotyle–trout system does not conform to a model involving random collisions between swimming hosts and infective stages dispersed in the water column. Instead, a major part of invasion is targeted into periods when fish are sedentary during the night (Gannicott and Tinsley, Reference Gannicott and Tinsley1997). This is achieved by a circadian rhythm of egg hatching in which most larvae emerge during the first few hours of darkness in each day/night cycle and none hatches during the later part of the night or during daytime. The focus of invasion on more-or-less stationary hosts is further enhanced because ready-to-hatch larvae also emerge in response to host mucus (Gannicott and Tinsley, Reference Gannicott and Tinsley1997). Invasion may continue when fish are active: larvae of D. sagittata swim for over 30 h (Gannicott and Tinsley, Reference Gannicott and Tinsley1998a) and remain infective for over 24 h (unpublished studies); but this contribution to infection may be relatively minor compared with nocturnal invasion synchronized with host inactivity.
The targeting of parasite infection into periods of increased host vulnerability could potentially contribute to aggregation if some fish settled at night near concentrations of ready-to-hatch eggs while others settled on sediment where eggs are absent. This could occur in natural environments, in rivers and lakes, but the artificial conditions of the present fish farm study provide a major advantage for interpreting fundamental causes of aggregation. Each pond comprised a simple rectangular arena with more-or-less uniform water depth, low water flow and no emergent vegetation. Intensively-maintained trout form dense shoals swimming en masse in a circular route around the pond, disturbing fine silt which settles over the mud substrate. Parasite eggs are released continuously (Gannicott and Tinsley, Reference Gannicott and Tinsley1998a) and are likely to be repeatedly redistributed with the sediment during the 4 weeks of development before hatching. A mechanism for generating overdispersion involving foci of egg accumulation and host selection of resting sites would require highly consistent individual host activity in both time and space. Thus, fish with very low burdens of recently-invaded worms (one-quarter of the sample carried only ⩽10 post-larvae/host) would have had to settle in virtually egg-free areas every night for a month. This seems unlikely. Fish with very low burdens of juvenile worms would have had to maintain habits that ‘avoided’ areas of hatching eggs every night during the preceding 2 months (one-quarter of the sample acquired only <15 juveniles/host). By comparison, other fish in the same confined habitat over the same time acquired many hundreds of post-larvae and juveniles per host (maxima 752 and 424, respectively). Major heterogeneity in exposure is unrealistic given the very high densities of fish, the massive output of parasite eggs distributed around the habitat by the movements of the hosts, and the limited micro-habitat diversity in the relatively featureless pond environment.
The most convincing evidence against a significant role of external factors in generating aggregation in this system is the co-variance of worm burdens of each age cohort on individual fish. The fish with very low burdens of recently-invaded post-larvae were typically the same hosts that had very low burdens of juvenile worms and, in turn, of longer-established adults and pre-adults. Variable infection pressure, hence heterogeneity in parasite invasion in different fish over time, would tend to produce highly variable numbers of successive parasite age cohorts within individuals. Given relative burden sizes that were more-or-less consistent for individual fish, the major causative agents of overdispersion are more likely to relate to differences in the hosts themselves and the micro-environment that they create for parasite survival.
Previous studies at this Isle of Man fish farm have interpreted overdispersion of worm burdens of D. sagittata as evidence of differences in host susceptibility (Rubio-Godoy and Tinsley, Reference Rubio-Godoy and Tinsley2008b). This reasoning relies on the certainty that the discrete ‘pond populations’ of trout have remained constant throughout the respective study periods without addition of fish from elsewhere with different infection characteristics. While this has generally been assured, it remains possible that some fish were translocated between ponds during farm management or during emergencies such as flooding. This study removes any possibility that heterogeneity might be influenced by mixing of fish from different sources: in the years before the sampling date, this was the only rearing pond at the farm that contained trout.
Causes of aggregation: host immunity
A series of studies has demonstrated the development of protective immunity against monogeneans. For amphibians, laboratory and long-term field studies have shown that Xenopus laevis develops strong, long-lived acquired immunity to Protopolystoma xenopodis (Jackson and Tinsley, Reference Jackson and Tinsley2001; Tinsley et al., Reference Tinsley, Stott, York, Everard, Chapple, Jackson, Viney and Tinsley2012). For fish, experimental evidence for immunity includes resistance to species of Gyrodactylus by several host species (e.g. Cable and van Oosterhout, Reference Cable and van Oosterhout2007; Zhou et al., Reference Zhou, Li, Zou, Zhang, Wu and Wang2018). Studies on the Discocotyle–trout system have concluded that immunity to D. sagittata is multifactorial, potentially including host mucus, complement and antibodies; vaccination with parasite extracts elicits partial immunity (Rubio-Godoy et al., Reference Rubio-Godoy, Sigh, Buchmann and Tinsley2003a, Reference Rubio-Godoy, Sigh, Buchmann and Tinsley2003b, Reference Rubio-Godoy, Porter and Tinsley2004; Rubio-Godoy and Tinsley, Reference Rubio-Godoy and Tinsley2004). Laboratory experiments by Rubio-Godoy and Tinsley (Reference Rubio-Godoy and Tinsley2004) showed that trout exposed to trickle infection (analogous to the continuous exposure experienced in the field) developed significant partial protection against subsequent challenge. In these trials, reduced worm burdens were recorded 5 months after the start of the infection regime. Worm burdens following challenge infection were overdispersed, suggesting developing immunity, whereas burdens in controls (previously unexposed fish) were normally-distributed. In the present field study, comparable overdispersion in all parasite cohorts further supports the conclusion that host immunity has a key role in aggregation.
Dynamics of infection: parasite recruitment
The series of developmental cohorts on each host represents a succession of inputs of infection into the established parasite infrapopulations. Quantitative assessment of recruitment might be most clearly illustrated by the intensities of post-larvae (1.0 pairs of clamps) recording the outcome of invasion and initial establishment. This phase is tightly-defined by restriction of the cohort to parasite stages that show no clamp development p.i. (i.e. to worms aged ⩽2 weeks at 13 °C or ⩽4 weeks at the declining water temperatures experienced by this sample). Prevalence was 100%, confirming other evidence that all individuals in the host population experience invasion. It might be predicted that post-larval numbers would be influenced primarily by external environmental and behavioural factors associated with exposure, reflecting independent encounters between larvae and hosts, and potentially different from those factors governing the long-term establishment of pre-adults and adults. However, these burdens showed an overdispersed distribution not significantly different from that of juveniles. Therefore, the data for post-larvae do not represent invasion alone but the outcome of invasion already modified by host control. Nevertheless, the highest intensities recorded give a conservative indication of the capacity of transmission in the D. sagittata/O. mykiss system – the three highest burdens were 488, 676 and 752 post-larvae/host. So, it is possible to conclude that exposure to invasion – even in the closing weeks of the transmission season at temperatures close to those inhibiting recruitment – can result in a force of infection exceeding 700 worms/host/month. Given this potential for intense challenge, worm numbers in the specific cohorts do not, therefore, allow quantitative assessment of infection success but, instead, provide a measure of parasite survival.
Dynamics of infection: parasite attrition
The successive cohorts of developmental stages show the effects of continuous attrition over time. Thus, while the prevalence of post-larval and juvenile stages remained at 100%, worm numbers decreased: mean 162, maximum 752 post-larvae/host and mean 118, maximum 424 juveniles/host. Actually, the relative difference is greater: the period represented by juvenile invasion (mid-August to mid-October) was twice as long as for post-larvae (mid-October to mid-November), and invasion would have been more intense in the earlier period with production, development and hatching of infective stages greater at higher temperatures. For older cohorts, the numbers of hosts whose worm burdens were lost entirely increased: 10% of the sample for pre-adults, 30% for adults. Total numbers of worms in these two cohorts were closely comparable: 3032 pre-adults and 2902 adults infecting the sample of 20 fish. However, the pre-adult cohort was recruited over a single period of only about 2 months (June to late July/early August) whereas the adults represent accumulation of different episodes during one to several years (Fig. 1).
Previous laboratory experiments on the development of acquired immunity in this system (Rubio-Godoy and Tinsley, Reference Rubio-Godoy and Tinsley2004) have been based on the exposure of naïve fish to a first infection of D. sagittata where recognition and response may take some months to develop. In the present field populations, aggregation in populations of recently-invaded post-larvae (<1 month p.i.) is not significantly different from juveniles (up to 3 months p.i.): this suggests that the host immune response begins to regulate worm numbers quickly after initial invasion. The speed of response ‘in the wild’ may be accelerated because the fish were primed by years of experience.
Dynamics of infection: parasite-induced host mortality
There are no farm records to quantify parasite-induced host mortality but it might be expected that the most susceptible individuals in the original population would have been eliminated during the 9-year period. Nevertheless, the range of worm burdens that remained extended from intensities whose effects were likely to be trivial (minimum 10 worms/host) to burdens that might be judged overwhelming (>2000 worms/host). The potential impact of infection on this study population must take account of host body size. It must be assumed that fish 9 years old may tolerate burdens that would be lethal to smaller, younger trout. Previous work over more than 20 years at the same Isle of Man fish farm included experience in several years where heavy infections of D. sagittata were responsible for the loss of entire year classes (many thousands) of rainbow trout (Rubio-Godoy and Tinsley, Reference Rubio-Godoy and Tinsley2008a).
The principal pathogenic effects of D. sagittata involving blood removal (as in other polyopisthocotylean monogeneans, e.g. Tinsley, Reference Tinsley1973) would be greatest with worms of large body size – the adults and pre-adults – in large infrapopulations. Death occurs when hosts experiencing parasite-induced anaemia encounter conditions that compromise respiratory oxygen levels (see Introduction, above). Although per capita blood removal by small recently-invaded and juvenile worms is less, the irritation and tissue damage accompanying attachment to the gills by large numbers of these would contribute significant additional pathology (Rubio-Godoy and Tinsley, Reference Rubio-Godoy and Tinsley2008a). These burdens of young worms are also aggregated within the host population and highest intensities typically occur on hosts already carrying large adult and sub-adult populations. So, the co-variance of age-specific burdens on individual fish serves further to concentrate density-dependent effects on the few ‘wormy’ hosts. Newly-attached smaller worms may have only temporary effects before their elimination from a majority of hosts; however, since all hosts experience invasion during each transmission season, these worm burdens are continuously ‘topped up’, maintaining continuous low-level pathology. This acute damage is incurred across the host population despite immune defences capable of reducing and even eliminating chronic infection by older, more pathogenic worms. In the face of the force of infection recorded in this population – with a conservative estimate of over 700 worms/host/month (see above) – the negative effects on individual fish include the costs of mounting immune responses that eliminate the abortive infections.
Parasite-induced mortality might therefore have played a role in generating the observed parasite distributions, but it would tend to reduce aggregation by removing the highest infrapopulations. It cannot be invoked as a cause of persisting levels of aggregation in this fish population, especially given the co-variance across parasite age classes that carry different costs to the host and have interacted with the hosts over very different timescales.
Host–parasite interactions: population structure
Separate lines of evidence suggest that the parasite suprapopulation is highly structured across the host population. The fish fall into defined categories with respect to each other in their support of different burden sizes with individuals either parasite-free or carrying high, intermediate or low numbers of parasites across age classes. The structuring is also evident on individual hosts where the relative size of the parasite infrapopulation in a defined age cohort (invading the host in a limited time period) is closely comparable with the relative numbers established on that host in previous or subsequent periods of invasion. So, the rank order of intensities of infection is consistent across the host population with respect to each increment of surviving parasites.
These sub-divisions of the host and parasite populations are guided by the natural breaks in the range of worm burdens evident in the frequency distributions (Fig. 3). In a relatively small sample such as this, the proportions of hosts in each sub-division must be regarded only as a general guide to their relative importance in the overall fish population. Nevertheless, the sub-divisions are sufficiently consistent that they must be assumed to reflect robust principles regarding the control of worm burdens.
There is evidence of equivalent heterogeneity in other host–parasite interactions involving fish which is also suggestive of individual differences in the capacity to mount an effective immune response. For instance, in a field experiment with the ectoparasite Lernaeocera branchialis on caged Atlantic cod, Lysne and Skorping (Reference Lysne and Skorping2002) distinguished two groups within the host population. Monitoring of individual fish showed that one group was repeatedly infected and re-infected over a 19-month period while the other had significantly lower rates of infections. The different responses of these groups were consistent through both space and time and were interpreted as evidence of natural differences in host susceptibility. Previous studies on the Discocotyle–trout system have also distinguished a dichotomy in patterns of infection at the end of the transmission season (Rubio-Godoy and Tinsley, Reference Rubio-Godoy and Tinsley2008b). Within a single pond, one group of fish with high worm burdens carried the full range of developing parasite stages reflecting continuous transmission over preceding months; the other group had low worm burdens and few developing stages indicating little recruitment in the same environment over the same period.
The evidence that host population samples carry distinct sub-divisions of overall parasite distributions, reflecting differences in susceptibility/resistance, has implications for experimental studies. Attempts to quantify experimental outcomes (for instance, reduction in worm burdens following treatment) are specific to the immune characteristics of the particular host individuals employed in the comparisons. Moreover, the level of aggregation will affect confidence bounds of estimates of parasite abundance and the sample sizes needed for robust conclusions (Shvydka et al., Reference Shvydka, Sarabeev, Estruch and Cadarso-Suarez2018).
Host–parasite interactions: implications of aggregated distributions
The data for this system provide a clear demonstration of the characteristics associated with aggregated distributions and, in particular, provide empirical evidence for the scale of the effects of overdispersion. The frequency distributions show that the contribution to parasite reproduction resided in a relatively small fraction of infected hosts. Parasites in 30% of hosts (without adult worms) made no contribution to onward transmission, while egg production from a further 30% was minor: this combined 60% of the host sample carried a total of only 38 worms (1.3%) out of the overall total of 2806 adults. Amongst the heavily-infected hosts, two fish (10% of the sample) carried over 50% of the reproducing parasites. Competitive interactions would be expected to be most intense in the minority of high worm burdens, potentially reducing per capita egg production but increasing mating opportunities and genetic diversity. Regardless of density-dependent negative effects on reproductive output, the very high worm burdens recorded here would represent a potent source of transmission. This is consistent with the notion of super-spreaders in disease transmission (Lloyd-Smith et al., Reference Lloyd-Smith, Schreiber, Kopp and Getz2005). In a typical fish farm design and management, massive egg output from very high worm burdens such as these would have significant consequences for fish in inter-connected ponds and, potentially, for wild trout downstream of the farm outflow.
This study also provides empirical data for the implications of aggregated distributions of D. sagittata on pathology. For this, the effects of heterogeneity on host blood removal would run in parallel with the effects noted for reproduction (but pre-adult numbers should be added to those of adults, reflecting almost equivalent blood removal). So, a majority of hosts would have experienced relatively minor blood loss (in the present dataset, 60% of fish with ⩽20 adults and pre-adults/host). By contrast, 20% of hosts (carrying nearly 80% of the total adult and pre-adult population with a mean of >1100 worms/host) would bear the most severe blood loss.
The structuring of infection levels of D. sagittata, involving a high level of concordance in infection characteristics across the host and parasite populations, suggests that individual fish show a consistent response to invasion relative to one another over time periods measured in years. Fish characterized by low parasite intensities following each successive challenge may be considered relatively resistant, expressing an inherent ability to control infection regardless of differences in annual, seasonal and even short-term conditions influencing invasion rates. Fish with high infection levels of each age cohort demonstrate a weaker ability to control parasite survival and correspond with the ‘wormy’ individuals distinguished in other epidemiological studies.
In other systems where a ‘wormy’ component of the host population has been identified, immune ability to control worm burdens may be heritable: for instance, in gastrointestinal infection of small ruminants (Smith et al., Reference Smith, Wilson, Pilkington and Pemberton1999) and a range of other infectious diseases (Bishop and Morris, Reference Bishop and Morris2007). There is also evidence that heritable resistance can be selected (e.g. Rose Vineer et al., Reference Rose Vineer, White, Baber and Morgan2019, for gastrointestinal nematodes in sheep). Monogenean infections on fish show equivalent characteristics of heritability of resistance (e.g. Cable and van Oosterhout, Reference Cable and van Oosterhout2007).
In contrast to the present findings, a study of ectoparasites on farmed rainbow trout found strong aggregation but lack of evidence of acquired host immunity, suggesting that aggregation was driven primarily by heterogeneity in exposure (Bandilla et al., Reference Bandilla, Hakalahti, Hudson and Valtonen2005). The relative roles of exposure heterogeneity and host immunity in driving aggregation are likely to vary between and within systems, and a meta-analysis found that consistent aggregation patterns were not found across fish and parasite taxa in the wild (Marques et al., Reference Marques, Santos and Cabral2010). While theoretical approaches have been developed to disentangle the relative roles of host and environmental forces (Wilber et al., Reference Wilber, Johnson and Briggs2016; Sarabeev et al., Reference Sarabeev, Balbuena and Morand2019), empirical evidence from systems in which one or other set of mechanisms are curtailed are needed to complement theory and advance understanding of how these forces play out in nature and in managed systems. In some contexts, for example a less uniform environment and greater behavioural freedom, it is likely that exposure and on-host factors combine to generate a wider range of aggregation patterns, as for example in bats (Warburton and Vonhof, Reference Warburton and Vonhof2018). Elucidation of the mechanisms driving aggregation, and how they vary between systems and contexts, is important as it can influence optimal control strategies, for example, in human helminths (Civitello and Rohr, Reference Civitello and Rohr2014). In livestock, drug resistance increasingly undermines parasite control and new solutions seek to target highly infected individuals for treatment (Charlier et al., Reference Charlier, Morgan, Rinaldi, Van Dijk, Demeler, Hoglund, Hetrzberg, Van Ranst, Hendrickx, Vercruysse and Kenyon2014), yet the major drivers of parasite aggregation and their interaction with such targeted control approaches remain poorly understood (Morgan et al., Reference Morgan, Aziz, Blanchard, Charlier, Charvet, Claerebout, Geldhof, Greer, Hertzberg, Hodgkinson, Höglund, Hoste, Kaplan, Martínez-Valladares, Mitchell, Ploeger, Rinaldi, Von Samson-Himmelstjerna, Sotiraki, Schnyder, Skuce, Bartley, Kenyon, Thamsborg, Rose Vineer, De Waal, Williams, Van Wyk and Vercruysse2019). A better understanding of transmission dynamics will aid control of parasites of economic importance and can benefit from insights offered by studies across a wide range of ecological systems and contexts (Cable et al., Reference Cable, Barber, Boag, Ellison, Morgan, Murray, Pascoe, Sait, Wilson and Booth2017).
Conclusions
In the present dataset, the clear-cut characteristics in between-host comparisons are remarkable given that they are evident after 9 years of repeated exposure. They imply that there are still major differences in immune competence within host populations despite the selective force of challenge by a potentially highly pathogenic parasite.
The current study took advantage of a rare opportunity to study patterns of parasite infection in a system where transmission had continued without external intervention and under conditions that reduced the influence of one source of aggregation (heterogeneity in infection pressure). The ability to determine parasite age allowed the analysis of parasite distribution (and hence the outcome of past invasions) in separate developmental cohorts that had interacted with their hosts over a succession of timescales. The pattern of age structure in the parasite population showed that the major part of the reduction in numbers of worms initially establishing is completed before each increment of invasion reaches sexual maturity. This acts to constrain future transmission. The scale of this attrition while worm burdens are still pre-patent concurs with data for other host–parasite systems. For instance, comprehensive records for the monogenean Pseudodiplorchis americanus show that 97% of worms initially establishing on the host population die before the first opportunity for transmission (Tinsley, Reference Tinsley1999). The data for the Discocotyle–trout system re-inforce the conclusion that parasite invasion success is only distantly linked with the capacity for onward transmission: the size of the reproducing parasite population is principally a product of the host–parasite interaction p.i.
The present results help to explain the mechanisms driving aggregation in this monogenean–fish interaction, and also add to the evidence base underpinning the search for a general understanding of how various mechanisms combine to drive aggregation patterns across systems. We conclude that differences between individual hosts in the expression of effective immunity are necessary and sufficient to account for aggregation in parasite burdens in this system.
Acknowledgements
We are grateful to Mr Ken Jervis for permission to undertake field studies at the Riverside farm over many years, and we thank Dr Roger Sweeting for arranging our present sample collection and Dr Matthew Tinsley for additional help.
Financial support
We thank the University of Bristol for support of this research.
Conflict of interest
None.
Ethical standards
Not applicable.