NOMENCLATURE
Symbols
 $\bar{v}^3$
cube of mean wind speed
- $\bar{v^{3}}$
mean of wind speed cubed
- $\widehat{y_{k}}$
estimated wind speed for statistical tests
- ${E_{pf}}$
energy pattern factor
- ${c_1}$
cognitive weight
- ${c_2}$
social weight
- $fi{t_{cdf}}$
objective function for cumulative density error minimisation
- $fi{t_{pdf}}$
objective function for probability density error minimisation
- ${g_t}$
best global position of swarm
- ${p_t}$
best position of particle
- ${u_1}$
uniform random number
- ${u_2}$
uniform random number
- $\bar{v}$
mean wind speed
- ${v_j}$
wind speed for
$j$th measurement- ${v_t}$
current velocity
- ${v_{t+1}}$
updated velocity
- ${x_t}$
current position
- ${x_{t+1}}$
updated position
- $\bar{y}$
mean wind speed for statistical tests
- ${y_k}$
actual wind speed for statistical tests
- $\left| \cdot \right|$
absolute value operator
- ${\rm{\Gamma }}(\cdot)$
Gamma function
- $F(v)$
cumulative density function
- $\;N$
total wind speed data
- $c$
scale factor
- $exp(\cdot)$
exponential function
- $f(v)$
probability density function
- $k$
shape factor
- $ln(\cdot)$
natural logarithm
- $n$
total number of parameters
- $v$
wind speed
- $w$
inertial weight
- $\sigma$
standard deviation


Definitions, acronyms and abbreviations
- CDF
cumulative distribution function
- GA
genetic algorithm
- GW
gigawatts
- HPA
Hasan Polatkan Airport
- J1
fitness function based on probability distribution
- J2
fitness function based on cumulative distribution
- MAE
mean absolute error
probability density function
- PSO
particle swarm optimisation
- R 2
R value squared
- RMSE
root-mean-square error
- $\chi$2
chi squared

1.0 INTRODUCTION
Wind is the fastest-growing energy source, being commercialized and developing more rapidly compared with other renewable energy resources. It has been used to supply mechanical power since the early twentieth century, but nowadays, it is often used for generating electrical power to supply energy demands(Reference Genc, Erisoglu, Pekgor, Oturanc, Hepbasli and Ulgen1). The wind industry has achieved major development in recent years in terms of installed capacity and the number of wind farms. Parallel to this progress, the total global installed capacity of wind energy was approximately 18.039GW in 2000, whereas it reached almost 591GW by the end of 2018(2). The random nature of wind gives rise to inconsistent power generation from wind energy, which leads to significant problems for electricity generation as well as the assessment and prediction of wind energy potential(Reference Alrashidi, Rahman and Pipattanasomporn3). Long-term meteorological observations are required to determine the characteristics and potential of wind energy at a particular location. A probabilistic-based model can be used to approximately assess the available wind energy potential at a location based on long-term observations(Reference Mohsin and Rao4). Knowledge of the probability density function of wind at any site is a key factor in practice. Accurate determination of the wind speed distribution from reliable wind speed data plays an important role in the assessment of the wind energy potential at any site and minimises any uncertainty or unexpected risks(Reference Alrashidi, Rahman and Pipattanasomporn3). It is widely known that the wind speed data at any site can be characterised by a statistical distribution. Different probability density functions can be used to evaluate and analyse such wind speed distributions, including the Rayleigh, Weibull, gamma, lognormal, inverse Gaussian, kappa, Burr, generalised gamma, beta, logistic, inverse Weibull, maximum-entropy principle-type, and mixture distributions(Reference Chang5–Reference Dong, Wang, Jiang and Shi14). The Weibull distribution is well known and the most commonly used method to estimate the wind energy potential in the literature because of its desirable properties, including having only limited parameters, providing a good fit to wind data, simplicity, flexibility and a simple closed-form expression(Reference Alrashidi, Rahman and Pipattanasomporn3,Reference Usta6,Reference Akdağ and Dinler15) .
The shape  $\left( k \right)$ and scale
 $\left( c \right)$ parameters in the Weibull distribution must be accurately determined since the details of the wind speed distribution are used as a benchmark when optimising the efficiency, energy production and capacity factor, as well as for minimising the costs of capital investment and electricity generation(Reference Akdağ and Dinler15). For this purpose, numerous alternative numerical methods exist and are widely used in literature. The implemented methods include graphical(Reference Jiang and Murthy16), empirical(Reference Chang17), maximum-likelihood(Reference Balakrishnan and Kateri18), energy pattern factor(Reference Costa Rocha, de Sousa, de Andrade and da Silva19), moment(Reference Akdağ and Güler20), modified maximum-likelihood(Reference Chen, Xie and Wu21) and least-squares estimator(Reference Akgül, Şenoğlu and Arslan22) approaches, as well as others(Reference Saleh, Abou El-Azm Aly and Abdel-Hady23). Numerical methods may not always be sufficient to accurately estimate the parameters of the Weibull distribution. Despite the fitting accuracy of methods available in literature, alternative methods should be further investigated in detail to improve on the accuracy of the Weibull distribution(Reference Alrashidi, Rahman and Pipattanasomporn3,Reference Silva, Alexandre, Daniel and Everaldo24) .
To increase the efficacy, accuracy and robustness of the solution, metaheuristic techniques have been proposed as alternative approaches to numerical methods. These include the genetic algorithm, particle swarm optimisation, the bat algorithm, cuckoo search, social spider optimisation, and so on(Reference Dong, Wang, Jiang and Shi14,Reference Rajabioun25–Reference Chang29) . Metaheuristic techniques have the potential to optimise any given fitness function encountered in real-life problems, such as the determination of Weibull parameters. To understand wind characterisation, as in a case study in Saudi Arabia, certain metaheuristic and numerical methods are employed to fit the wind speed data with both single and combined distributions(Reference Alrashidi, Rahman and Pipattanasomporn3). The results show that the combined probability density functions exhibit better performance than single probability density functions and that, when single probability densities are considered, the Weibull distribution is the best density function in comparison with the Rayleigh, gamma and lognormal functions. A multiverse optimisation method was also presented(Reference Kumar, Balasubramaniyan, Padmanaban and Holm-Nielsen30) to analyse wind data in the Tirumala region of India in comparison with other, metaheuristic and numerical methods. The limitations of the presented algorithm, due to its computational complexity, were underlined. The particle swarm optimisation method was employed(Reference Carneiro, Melo, Carvalho and Braga31) to estimate the Weibull parameters for the Brazilian Northeast Region. The presented method was compared with the moment method, empirical method, energy pattern factor method, maximum-likelihood method and energy equivalent method. For the considered wind sites, the particle swarm algorithm method showed the best performance in comparison with other numerical methods. An evolutionary strategy-based maximum-likelihood estimation method has been presented to estimate the three -parameters of the Weibull distribution(Reference Yang, Ren and Hu32). The proposed method was compared with least-squares regression, weighted least-squares regression, genetic algorithm and so on. According to the results, the evolutionary strategy performed better for empirical distribution functions. The non-linear least-squares estimation and particle swarm optimisation algorithms have been hybridised(Reference Lu, Dong and Zhou33). While the nonlinear least-squares estimation method was used for selecting the starting point and bounds, the particle swarm method was used to search for the optimal values of the parameters in the Weibull distribution. The method was compared with a genetic algorithm-based method and maximum-likelihood estimation method. The results showed that the proposed method was advantageous in terms of efficiency.
Other than the Weibull distribution, metaheuristic-based algorithms can be employed and are widely used in aviation, including the neuro-evolution algorithm(Reference Baklacioglu, Aydin and Turan34), evolutionary algorithm(Reference Kaba and Kyak35), genetic algorithm(Reference Baklacioglu, Turan and Aydin36), particle swarm optimisation algorithm(Reference Kiyak37,Reference Wang and Liu38) , neuro-fuzzy algorithm(Reference Yazar, Kiyak, Caliskan and Karakoc39) and ant colony optimisation(Reference Piskin, Baklacioglu, Turan and Aydin40).
The capacity of a runway is an important factor for coping with the exponentially growing traffic demand(Reference Tee and Zhong41). Both runways and airspace must be effectively used to minimise any possible delays(Reference Sahin42). One key issue regarding runway capacity is wind speed. Wind speed plays a major role in critical applications, such as aviation, and its effect cannot be ignored. Approach and landing are the most crucial phases for aircraft, considering that 75% of aircraft accidents occur during these flight phases(Reference Daramola43). The flight schedule is planned based on weather and wind conditions(Reference Cecen, Cetek and Kaya44). Wind is a key factor in planning the most appropriate flight schedule. Low-level wind disturbance can sometimes cause go-arounds or other operational disruption(Reference Iijima, Matayoshi and Ueda45). Crosswind has a challenging impact on aircraft during take-off and landing. Aircraft have a set of restrictions for take-off and landing in crosswinds. They are not allowed to attempt take-off and landing in cases where the crosswind passes these limits. If the magnitude of this effect is high, then aircraft may not properly perform correct procedures for take-off and landing, which may endanger flight safety and security, resulting in flight delays and additional cost. This is undesirable for passengers, aircraft companies and airport traffic. Therefore, the wind effect has to be taken into consideration with regard to in-flight safety, security and airport design. An airport must be constructed in a location where wind has the least negative impact on flights inasmuch as it affects runway length and width. For this purpose, detailed wind analysis of an airport location must be precisely performed.
As can be understood from a literature survey, most research papers offer numerical methods to estimate Weibull parameters. However, parameters of the Weibull distribution estimated by numerical methods may generally be unable to adjust to a histogram of the wind speed distribution(Reference Kumar, Balasubramaniyan, Padmanaban and Holm-Nielsen30). Since researchers have mainly focused on numerical methods to determine the parameters of the Weibull distribution, studies based on metaheuristic approaches remain limited, and as yet there is no consensus regarding the most accurate estimation algorithm(Reference Usta6). In addition, most of the proposed metaheuristic methods are based on the RMSE of the probability density function of the wind histogram. However, the cumulative distribution function, which is neglected in the proposed methods, is as important as the probability density function. Furthermore, it can also be seen that comparisons of proposed algorithms lack the computational time factor, which is a key metric since metaheuristic algorithms demand a significant amount of time.
One key issue regarding airport design is the orientation of the runway. Runways are oriented according to the historical properties of wind. The orientation of a runway (such as 9–27) is aligned with the prevailing wind direction to prevent crosswind components during landing and take-off. According to authorities(46–48), the wind coverage of a runway must be greater than 95%. Such a wind coverage (also called the usability factor of the runway) means that, for 95% of the time, crosswinds must be lower than the allowed threshold value. According to literature(Reference Es and Karwal49,Reference Es, Geest and Nieuwpoort50) , if the wind speed exceeds the safety limits during the take-off or landing phase, the probability of an accident increases exponentially. Not only crosswinds endanger flight safety; tailwinds are also important factors. If the tailwind exceeds the allowable limits, overrun accidents may occur on landing. For these reasons, airports are equipped with wind measurement and recording systems to prevent delays and accidents through the use of wind speed and direction histograms, respectively.
In light of the literature survey and discussion above, the original contributions of this paper are as follows:
• to propose metaheuristic-based methods as powerful and better alternatives to numerical approaches
• to propose a novel objective function based on the cumulative distribution function of the Weibull distribution
• to apply wind energy and wind power determination methods to the wind distribution histogram of a runway
• to extend statistical tests to conduct a time consumption analysis, which fills a gap in the comparison of the computational demand of metaheuristic algorithms;
• to determine the wind speed profile of HPA as an original case study, which can contribute to the determination of wind coverage and wind distribution of the considered runway
In summary, this work focuses on more accurate methods for the estimation of the parameters of the Weibull distribution, thereby filling a research gap for metaheuristic methods by employing a novel objective function as the cumulative distribution function. Within this framework, the proposed methods provide a new perspective on determining the parameters. Carrying out research in a specific region, the efficiency and performance of the proposed methods are compared with numerical methods and the performance of the methods is validated by the results.
The rest of this paper is organized as follows: Section 2 presents the preliminaries of the Weibull distribution, while the numerical methods are covered in Section 3. The proposed methods are introduced in Section 4, and statistical analysis methods are given in Section 5. The results are covered and discussed in Section 6, while concluding remarks are given in Section 7.
2.0 PRELIMINARIES ON MATHEMATICAL BACKGROUND
2.1 Weibull distribution
The statistical distribution of wind speed varies from region to region worldwide. These changes result from local climatic conditions, soil structure, terrain and surface topography. They can be statistically represented by a probability density and cumulative function. A probability density function may be described as a probability distribution which corresponds to the relative possibility for a random variable  $v$ to take on a given value(Reference Kiran and Kiran51). The Weibull distribution, which was created by the Swedish physicist Waloddi Weibull in the 1930s, provides information regarding the wind speed distribution resulting from these changes. Since the Weibull distribution is a good fit to represent the wind speed distribution at a location, it is widely used in literature to estimate, model and analyse both the potential of wind energy and the wind speed at a specific location(Reference Akdağ and Dinler15). The probability density function of the Weibull distribution can be described as Equation (1):
 \begin{equation}f(v) = {\rm{\;}}\left( {\frac{k}{c}} \right){\left( {\frac{v}{c}} \right)^{k - 1}}\exp \left( { - {{\left( {\frac{v}{c}} \right)}^k}} \right),{\rm{\;}}\end{equation}
where  $f(v)$ is the probability of occurrence of a wind speed
 $v$,
 $k$ represents the shape parameter and
 $c$ denotes the scale parameter. The cumulative distribution function corresponding to this probability density can be easily derived from Equation (2):
 \begin{equation}F(v) = \int\limits_{ - \infty }^v f(x){\rm{\;d}}x.{\rm{\;\;}}\end{equation}
Therefore, the cumulative distribution function of the Weibull distribution can be written as Equation (3):
 \begin{equation}F{\rm{\;}}(v) = {\rm{\;\;}}1 - \exp \left( { - {{\left( {\frac{v}{c}} \right)}^k}} \right),{\rm{\;\;\;}}\end{equation}
where  $F(v)$ denotes the cumulative distribution function of the wind speed
 $v$.
The shape and scale parameters of the Weibull distribution play a crucial role in the wind distribution of a region. The shape parameter, which is an important parameter for the Weibull distribution, helps to calculate the frequency of the difference between the measured speed and wind speed(Reference Siddiqui52). The value of the shape parameter describes the variation in mean wind speed for a given sample(Reference Siddiqui52,Reference Rinne53) . When the value of the shape parameter is high, the stability of the wind speed is also high. If the wind speed in a region varies little, the  $k$ parameter is high, indicating that the wind speed is approximately constant (which may be low or high). High values of the shape parameter signify that the Weibull distribution is intensified around a given value and that the peak value of the distribution is higher. Meanwhile, low values of the shape parameter imply that a broad range of values are included in the distribution and that the peak value of the distribution is lower(Reference Chang17,Reference Dagdougui, Ouammi and Sacile54) . The scale parameter directly indicates the wind potential at a location(Reference Siddiqui52,Reference Rinne53) . The main function of the scale parameter is to fix the position of the curve. For a location with strong wind, it takes higher values, whereas it has lower values for locations with weak wind(Reference Dagdougui, Ouammi and Sacile54). This means that the
 $c$ parameter varies depending on the mean wind speed. If the mean wind speed is high, then the
 $c$ parameter is also high.
2.2 Geographic information
Eskişehir is located in the north-western part of Turkey. It has an area of 13,960km2, representing approximately 1.75% of the territory of Turkey, and measures about 80km from north to south. Its population is 887,475 according to the Turkish Statistical Institute(55). It has its own climatic features. Like other cities in the Central Anatolian region, it has a terrestrial climate. The annual average temperature at Eskişehir, which is one of the coldest regions in Turkey, is 10.9°C. The mean wind speed at Eskişehir is approximately 3.355m/s. The proposed methods were applied to HPA, which is 5km from Eskişehir. The wind speed data were sampled hourly in the period between 1 January 2012 and 31 December 2014, at a height of 10m above ground level owing to operational conditions. A total of over 27,000 measurements were taken from the Turkish State Meteorological Service.
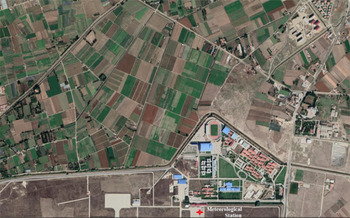
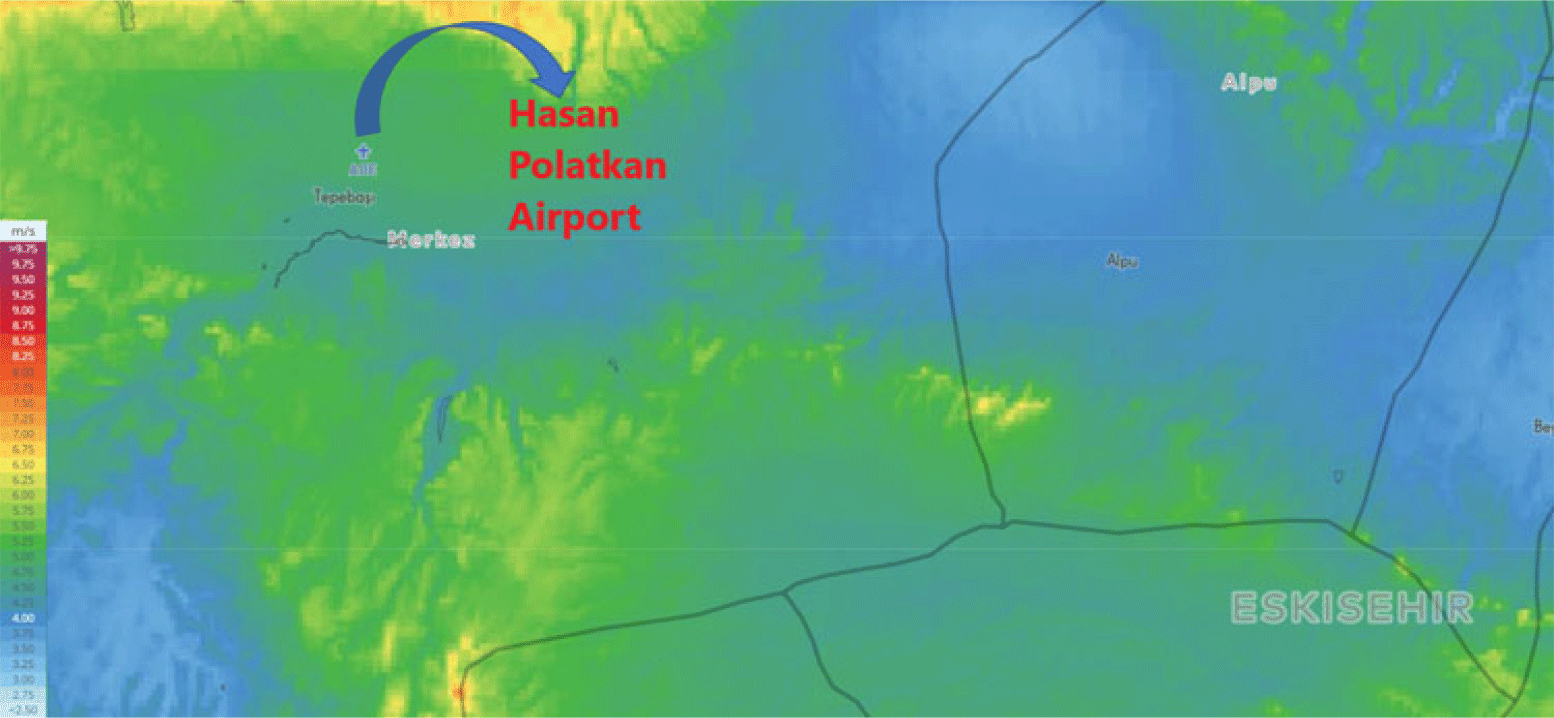
The geographical location of the site is shown in Fig. 1. The diamond symbol indicates the exact location of the meteorological station at the site. In addition to its geographical position, the location of HPA on the Wind Atlas is shown in Fig. 2. A detailed description of the site, including latitude and longitude as geographical coordinates, the elevation corresponding to the meteorological station and the period of the measured data, is presented in Table 1.
The geographical location of the study site on the map (revised from Google Earth).

Description of the meteorological station and wind speed data

The location of HPA at Wind Atlas(56).

3.0 NUMERICAL METHODS
The Weibull distribution is widely used in literature to estimate and analyse both the potential of wind energy and the wind speed in a specific region(Reference Akdağ and Dinler15). It includes two parameters: the shape factor  $k$ and the scale factor
 $\;c$. To estimate the wind energy potential and the wind speed in a given region, these two important parameters must be determined. Various numerical methods can be used to determine the
 $k$ and
 $c$ parameters of the Weibull distribution(Reference Costa Rocha, de Sousa, de Andrade and da Silva19). In this section, four widely used numerical methods are presented: the graphical method, the empirical method, the maximum-likelihood method and the energy pattern factor, also known as the power density method.
3.1 Graphical method
The graphical method, introduced by Deaves et al. in 1997, is directly based on the cumulative distribution function(Reference Deaves and Lines57). The Weibull parameters can be calculated by using the cumulative distribution function(Reference Akdağ and Dinler15,Reference Costa Rocha, de Sousa, de Andrade and da Silva19) . Applying a logarithmic transform twice, the cumulative distribution function of the Weibull distribution, given in Equation (3), becomes Equation (4):
 \begin{equation}\ln\!\left( { - {\rm{ln}}\!\left( {1 - F(v)} \right)} \right) = k\ln(v) - k\ln(c).{\rm{\;}}\end{equation}
Note that there is a special relationship between  $\ln \left( { - {\rm{ln}}\left( {1 - F(v)} \right)} \right)$ and
 $k\ln (v) - k{\rm{ln}}\left( c \right)$. By plotting
 $\ln \left( { - {\rm{ln}}\left( {1 - F\left( {{v_i}} \right)} \right)} \right)$ on the y-axis versus
 ${\rm{ln}}\left( {{v_i}} \right)$ on the x-axis for
 $i = 1,\;2, \ldots N$, an approximately straight line is obtained(Reference Mathew58). The slope of the straight line gives us the
 $k$ parameter, while the
 $c$ parameter is simply determined from the intersection with the y-ordinate(Reference Akdağ and Dinler15,Reference Kang, Ko and Huh59) .
A second approach to determine the  $k$ and
 $c$ parameters is the least-squares method. As can be seen, Equation (4) adopts the linear form
 $y = ax + b$ with respect to
 $\ln \left( { - \ln \left( {1 - F(v)} \right)} \right)$ and
 ${\rm{\;ln}}(v)$. If the straight line fits best to
 $\ln \left( { - {\rm{ln}}\left( {1 - F\left( {{v_i}} \right)} \right)} \right)$ against
 ${\rm{ln}}\left( {{v_i}} \right)$ for
 $i = 1,2, \ldots N$ which is obtained using the least-squares method, the coefficients of the straight line,
 $a$ and
 $b$, can easily be calculated(Reference Akdağ and Dinler15,Reference Chang17) . In such a case,
 \begin{equation}k = a \& c={\rm{exp}}\left( { - \frac{b}{a}} \right)\!.\end{equation}
It can be clearly seen that the slope of the straight line fitted to the data gives us the  $k$ parameter while the
 $c$ parameter is simply determined from the y-intercept of the straight line in Equation (5)(Reference Akdağ and Dinler15,Reference Chang17,Reference Kang, Ko and Huh59) .
3.2 Empirical method
The empirical method was proposed by Justus et al. in 1978(Reference Justus, Hargraves, Mikhail and Graber60). It is a simple approach that can be used to determine the Weibull parameters. For this purpose, it makes use of the standard deviation and mean wind speed. In this method, the shape and scale parameters can be obtained using Equations (6) and (7):
 \begin{equation}k = {\left( {\frac{\sigma }{{\mathop v\limits}}} \right)^{ - 1.086}},\end{equation}
 \begin{equation}c = \frac{{\bar{v}}}{{{\rm{\Gamma }}\!\left( {1 + \frac{1}{k}} \right)}},\end{equation}
where  $\sigma $ represents the standard deviation,
 $\bar{v}$ denotes the mean wind speed and
 ${\rm{\Gamma }}$ indicates the gamma function given in Equation (8):
 \begin{equation}{\rm{\Gamma }}({\rm{z}}) = {\rm{\;}}\int\limits_0^\infty {t^{z - 1}}{e^{ - t}}dt\end{equation}
3.3 Maximum-likelihood method
The maximum-likelihood method, proposed by Stevens and Smulders in 1979, has a high computational load since the parameters of the Weibull distribution are determined iteratively(Reference Akdağ and Dinler15,Reference Chang17,Reference Stevens and Smulders61) . For this reason, it is more difficult and complicated to apply this method compared with other methods. The shape and scale parameters can be calculated from Equations (9) and (10):
 \begin{equation}k = {\left( {\frac{{\mathop \sum \nolimits_{j = 1}^N {v_{}}^k\ln\!\left({{v_j}} \right)}}{{\mathop \sum \nolimits_{j = 1}^N {v_j}^k}} - \frac{{\mathop \sum \nolimits_{j = 1}^N \ln\!\left( {{v_j}} \right)}}{N}} \right)^{ - 1}},\end{equation}
 \begin{equation}c = {\left( {\frac{{\mathop \sum \nolimits_{j = 1}^N {v_j}^k}}{N}} \right)^{\frac{1}{k}}},\end{equation}
Iterative methods, such as the Newton–Raphson algorithm, can be used to find the  $k$ and
 $c$ parameters. However, it should not be forgotten that zero velocities are excluded from the wind data due to the fact that there is no solution for zero velocity values.
3.4 Energy pattern factor method
The energy pattern factor method, also commonly known as the power density method, was proposed by Akdağ and Dinler in 2009(Reference Akdağ and Dinler15). This method is based on the energy pattern factor, a ratio that is often used in the aerodynamic design of turbine blades(Reference Singh, Bule, Khan and Ahmed62). Edward William Golding described it as the total power of the wind divided by the power computed by taking the cube of the mean wind speed, which is determined from sample measurements as shown in Equations (11) and (12)(Reference Haack63,Reference Mani and Mooley64) :
 \begin{equation}{E_{pf}} = \frac{{{\rm{Total\;power\;of\;wind}}}}{{{\rm{Power\;computed\;by\;cubing\;the\;mean\;wind\;speed}}}},\end{equation}
 \begin{equation}{E_{pf}} = \frac{{\left( {\frac{1}{N}\mathop \sum \nolimits_{j = 1}^N {v_j}^3} \right)}}{{{{\left( {\frac{1}{N}\mathop \sum \nolimits_{j = 1}^N {v_j}} \right)}^3}}} = \frac{{\overline{{v^3}}}}{{{{( \bar{v} )}^3}}} = \frac{{{\rm{\Gamma }}\left( {1 + \frac{3}{k}} \right)}}{{{{\rm{\Gamma }}^3}\left( {1 + \frac{1}{k}} \right)}},\end{equation}
where  ${\left( {\bar{v}} \right)^3}$ is the cube of the mean wind speed,
 $\mathop {{\overline{v^3}}}\limits$ is the mean of the wind speed cubed and
 $\frac{{\mathop {{\overline{v^3}}}\limits}}{{{{\left( \bar{v} \right)}^3}}}$ is defined as the energy pattern factor.
 ${E_{pf}}$ is always greater than 1 and, generally, its range is from 1.44 to 4.4 for most wind distributions(Reference Akdağ and Dinler15). After the energy pattern factor
 ${E_{pf}}$ has been calculated, the
 $k$ and
 $c$ parameters can be easily computed using Equations (13) and (14):
 \begin{equation}k = 1 + \frac{{3.69}}{{{{\left( {{E_{pf}}} \right)}^2}}},{\rm{\;\;\;}}\left( {13} \right)\end{equation}
 \begin{equation}c = \frac{\bar{v}}{{{\rm{\Gamma }}\left( {1 + \frac{1}{k}} \right)}}.\end{equation}
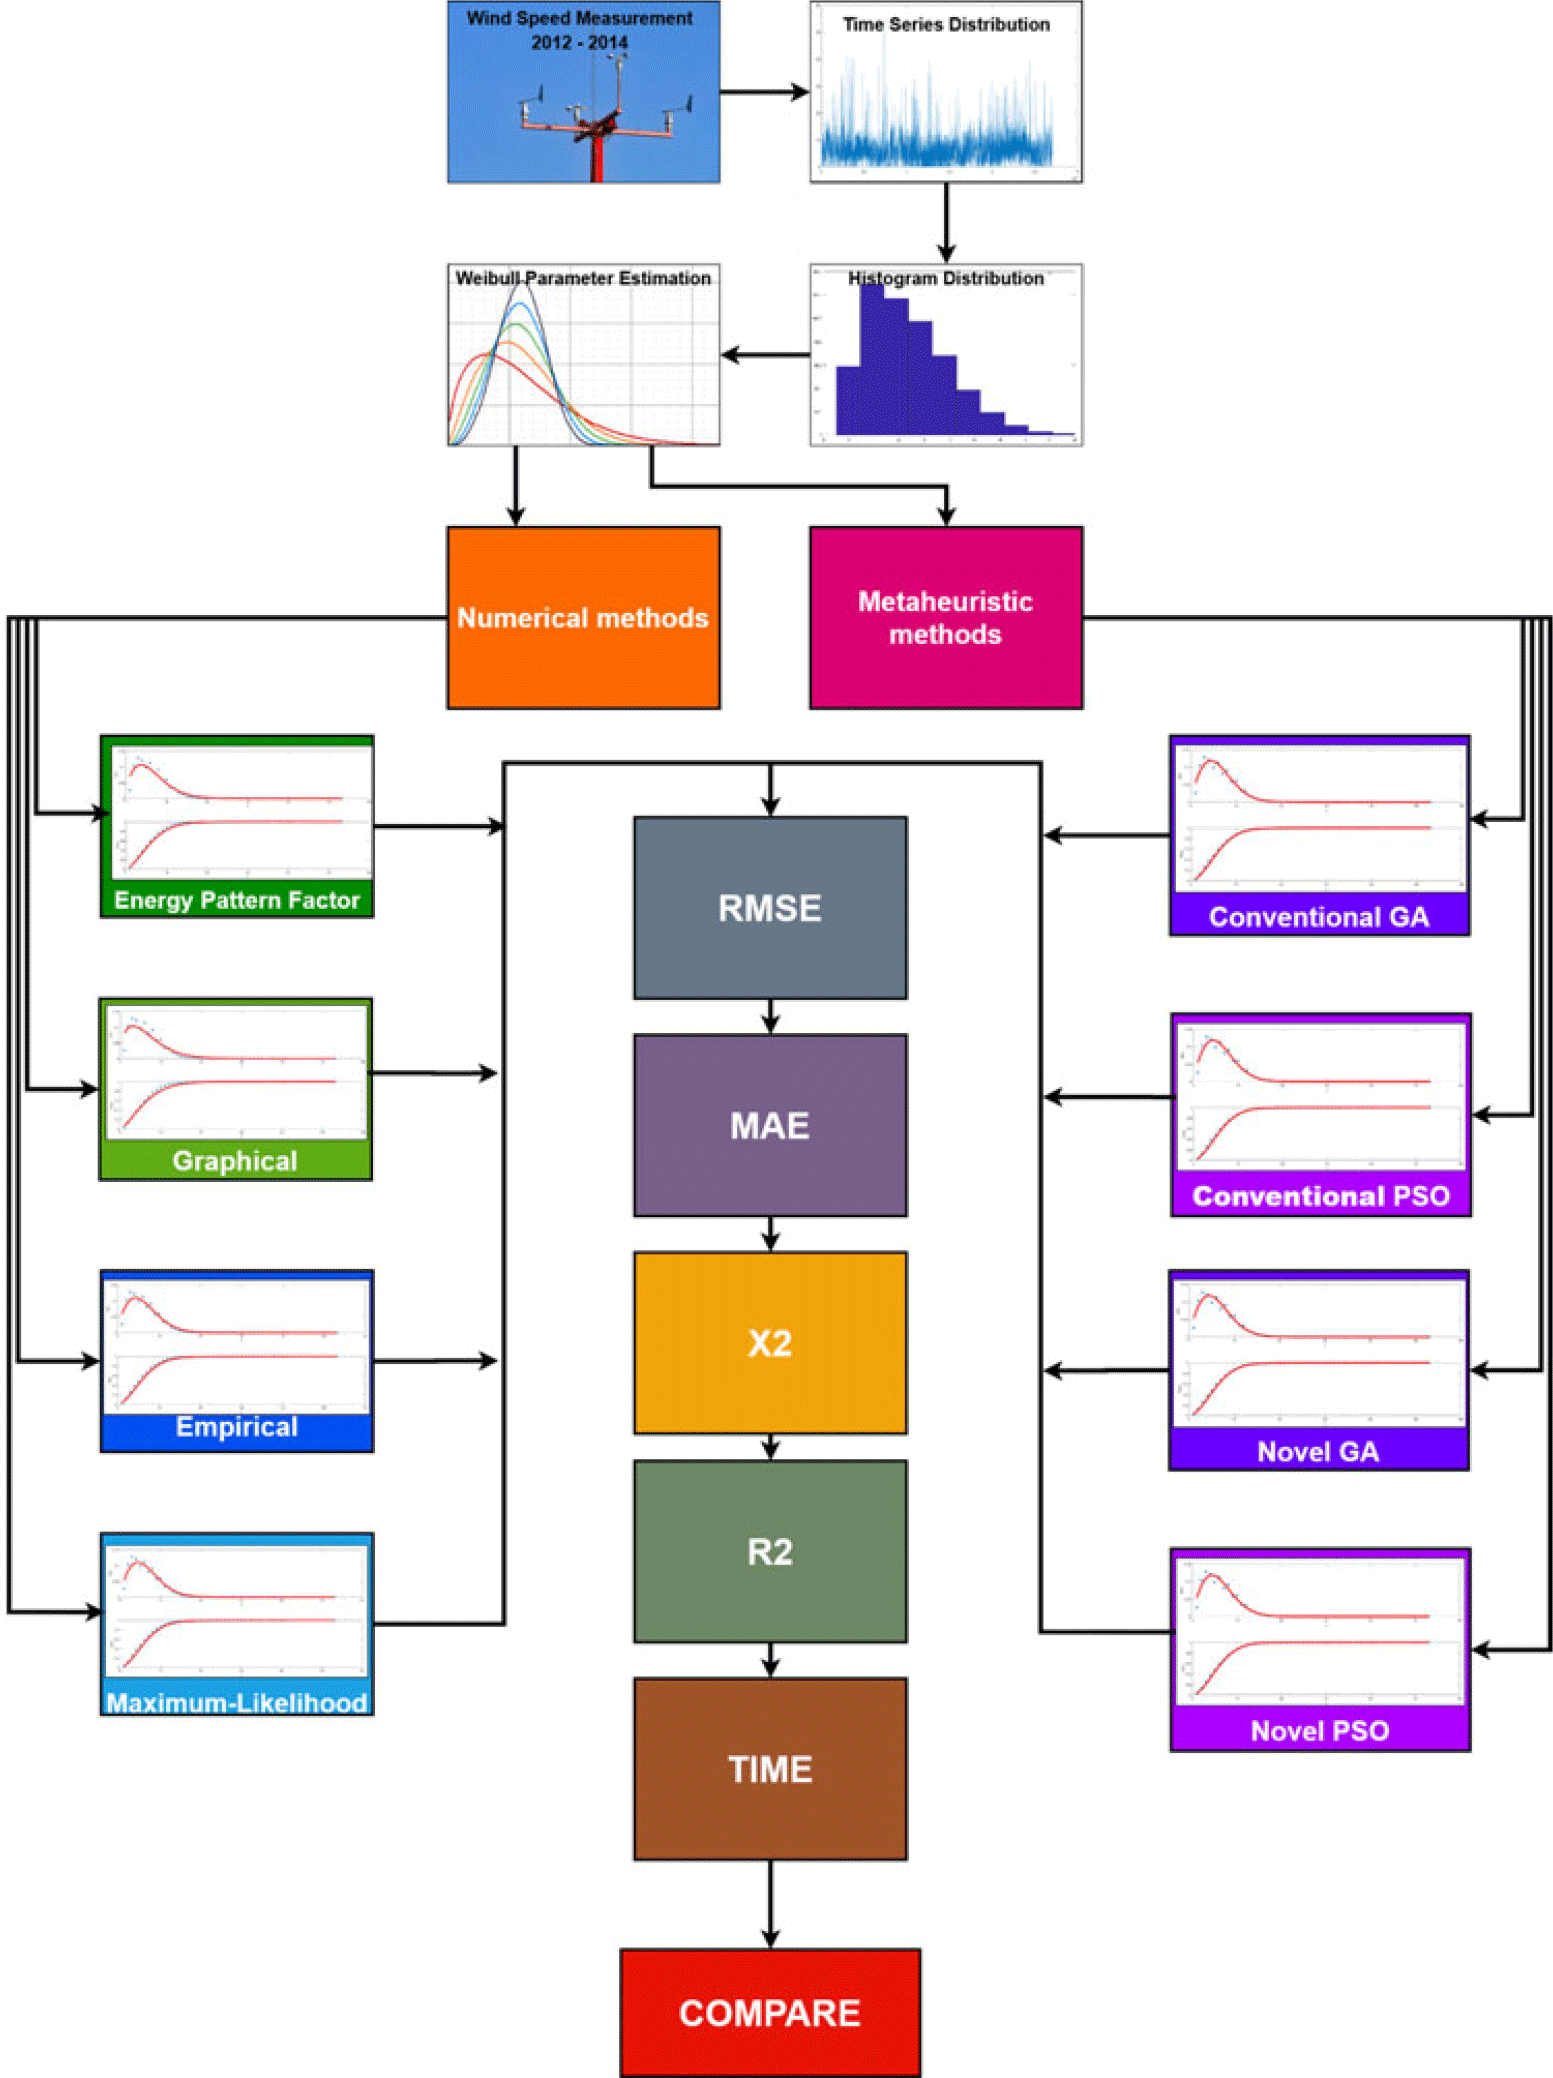
The framework of the study with numerical and metaheuristic methods.

4.0 METAHEURISTIC DATA FITTING
The framework of this study is shown in Fig. 3. As shown in Fig. 3, the first step is to collect the wind speed measurements between 2012 and 2014. Then the time-series distribution is obtained from the observation matrix. The next step is to determine the histogram of the measured wind speed frequencies. From the histogram distribution, the shape and scale parameters of the Weibull distribution are estimated by employing the four widely used numerical methods, viz. the graphical, empirical, maximum-likelihood and energy pattern factor approaches, and also by employing four metaheuristic methods. The metaheuristic methods can be divided into two types: conventional methods and novel methods. Next, these two parameters are estimated using the genetic algorithm and particle swarm optimisation. A detailed explanation of the proposed methods is given in the following sections. After determining the parameters, the probability density and cumulative distribution functions are built, and the RMSE, MAE, R squared (R 2) and chi-squared ( $\chi$2) tests are applied to compare the performance of the proposed method with that of the numerical methods. The results are ranked on the basis of the statistical analysis and elapsed time; thereafter the optimal method is selected to characterise the wind at the site.
4.1 Genetic algorithm-based data fitting method
Genetic algorithms are population-based, stochastic optimisation methods that are inspired by the phenomenon of natural selection. Genetic algorithms do not need any gradients or Hessians to operate in the search space, which most numerical methods would need. The crossover, mutation and selection operations are important phases of genetic algorithms. While crossover remains the main variation operator, mutation serves as a random perturbation. The selection of the next generation is based on the survival-of-the-fittest rule; that is, individuals with the highest probabilities will be transferred into offspring(Reference Ahn65,Reference Chong and Żak66) .
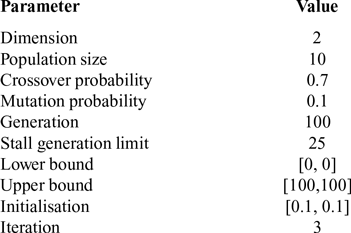
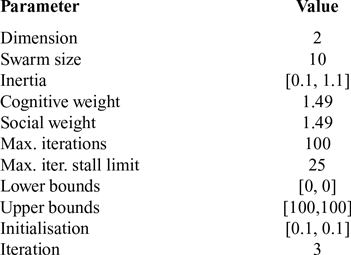
The parameters of the genetic algorithms are presented in Table 2. The lower and upper bounds for the shape and scale parameters are chosen as [0, 100], which generously extends the search space. The initial values of the population are chosen as [0.1, 0.1], which are close to the lower bound to prevent any bias in the results. The population size is chosen as ten, which reduces the time demands of the proposed method at the cost of decreasing the chance of converging to the global optimal solution. The algorithm is run three times, and the mean value is taken as the final solution.
Parameters of genetic algorithm

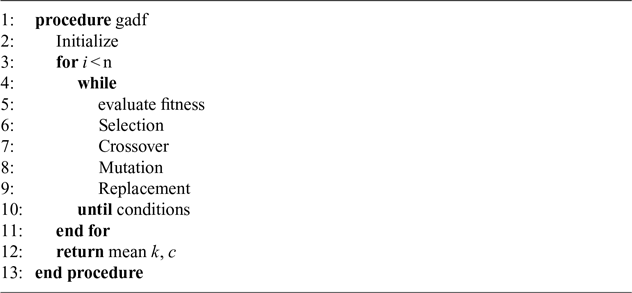
The pseudo-code of the proposed genetic algorithm-based data fitting method is given in Algorithm 1. The proposed algorithm starts with the initialisation of the parameters given in Table 2. Next, the counter i is reset and the for loop is started. After this, the while loop is created to evaluate the fitness of the population and also to apply the genetic operators for selection, crossover, mutation and replacement. When predefined conditions are met, for example on the generation number or a stall limit, the optimised variables are saved and the algorithm is restarted with the increased counter value until the run number n is reached. Next, the mean values of the optimised parameters are calculated and returned to the main program. Two separate fitness steps are evaluated, since two different objective functions are proposed. The roulette wheel selection method is used in the proposed algorithm, in which individuals with the highest probabilities will likely survive in the next generation. In the crossover phase, the weighted arithmetic means of the parents are used to create the offspring. In the mutation phase, randomly generated direction and steps are applied to the population to ensure exploration of the search space.
Genetic algorithm-based data fitting method

4.2 Particle swarm optimisation-based data fitting method
Particle swarm optimisation is an intelligent method which was introduced in Ref. Reference Kennedy and Eberhart26 as a tool to optimise continuous nonlinear functions. The algorithm is inspired by the social and cognitive behaviour of flocks of birds, which is computationally inexpensive due to the primitive mathematical operators used(Reference Kennedy and Eberhart26). Each individual in the swarm is called a particle. A particle is a candidate for a global solution which has:
• a tendency for randomness in the search space
• a tendency to return to the best location visited by itself and
• a tendency to go where most particles in the neighborhood go(Reference Gümüşboğa and İftar67).
The equations to update the position and velocity of the particles are given in Equations (15) and (16).
 \begin{equation}{v_{t + 1}} = {\rm{\;}}w\,{\rm{*}}\,{v_t} + {\rm{\;}}{c_1}\,{\rm{*}}\,{u_1}\left( {{p_t} - {\rm{\;}}{x_t}} \right) + {\rm{\;}}{c_2}\,{\rm{*}}\,{u_2}\,{\rm{*}}\,\left( {{g_t} - {x_t}} \right),\end{equation}
 \begin{equation}{x_{t + 1}} = {\rm{\;}}{x_t} + {\rm{\;}}{v_{t + 1}},\end{equation}
where  ${v_t}$ is the current velocity,
 ${v_{t + 1}}$ is the updated velocity,
 $w$ is the inertial weight,
 ${c_1}$ is the cognitive weight,
 ${u_1}$ and
 ${u_2}$ are uniform random numbers
 $\; \in \left[ {0,1} \right]$,
 ${p_t}$ is the best position of the particle,
 ${c_2}$ is the social weight,
 ${g_t}$ is the best global position of the swarm,
 ${x_t}$ is the current position and
 ${x_{t + 1}}$ is the updated position(Reference Carneiro, Melo, Carvalho and Braga31).
The parameters for the particle swarm optimisation method are presented in Table 3. It can be seen from Tables 2 and 3 that all the common parameters are chosen the same to achieve a fair comparison between the metaheuristic algorithms. These parameters are swarm size, iteration number, stall limit, lower and upper bounds, initialisation values and the total number of runs of the proposed algorithms. The inertial weight in the particle swarm algorithm lies in the range of 0.1–1.1, and its value is assigned adaptively. The cognitive and social weights are chosen as 1.49, whereas in literature they are generally taken in the range of 1–2(Reference Li, Cui, Li and Cui68).
Parameters of particle swarm optimisation

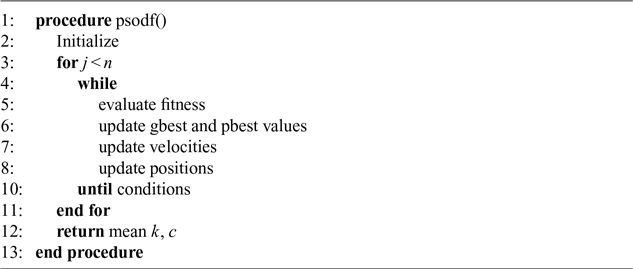
The pseudo-code for the proposed particle swarm optimisation-based data fitting method is given in Algorithm 2. The initialisation step is conducted according to Table 3. The counter j is set to zero, and the for loop is started. Next, a while loop is created to assess the fitness measures of the particles and also implement the exploration as well as cognitive and social behaviour of the particles. When the maximum number of iterations is reached or a stall occurs, the gbest value is stored and the proposed method is restarted until the run number n is reached. Finally, the average values of the gbest values are calculated and returned to the main program as optimal solutions. The algorithm is evaluated twice, since two different fitness functions are proposed.
PSO algorithm-based data fitting method

4.3 Fitness functions
The objective function is an important part of the metaheuristic methods, since their optimisation performance is directly related to the fitness measure. The definition of the objective function clearly determines how close an individual is to the global minimum. Therefore, two different objective functions are proposed in this paper to achieve a higher performance standard according to the different figures of merit. While the first objective function deals with minimisation of the probability density error, the second deals with minimisation of the cumulative distribution error. The proposed objective functions are given in Equations (17) and (18), respectively.
 \begin{equation}fi{t_{pdf}} = {\rm{\;}}\sqrt {\frac{1}{{n}}\mathop \sum \limits_{i = 0}^n {{\left( {{\rm{\;}}{f_{measPdf}}\!\left( {{v_i}} \right) - {\rm{\;\;}}{f_{calcPdf}}\!\left( {{v_i}} \right)} \right)}^2}},\end{equation}
 \begin{equation}fi{t_{cdf}} = {\rm{\;}}\sqrt {\frac{1}{n}\sum\limits_{i = 0}^n {{\left( {{\rm{\;}}{f_{measCdf}}\left( {{v_i}} \right) - {\rm{\;\;}}{f_{calcCdf}}\left( {{v_i}} \right){\rm{\;}}} \right)}^2}{\rm{\;}}} {\rm{\;}},\end{equation}
where  $fi{t_{pdf}}$ is the first proposed objective function dependent on the RMSE of the probability density,
 $fi{t_{cdf}}$ is the second proposed objective function dependent on the RMSE of the cumulative distribution,
 $n$ is the number of unique wind speed values,
 $\;{f_{measPdf}}$ and
 $\;{f_{measCdf}}$ are the measured probability and cumulative functions and, lastly,
 $\;{f_{calcPdf}}$ and
 $\;{f_{calcCdf}}$ are the calculated probability and cumulative functions based on the
 $k$ and
 $c$ values obtained from the proposed methods, respectively.
5.0 STATISTICAL ANALYSIS
Various statistical analysis methods exist to assess the performance or fit of a model(Reference Costa Rocha, de Sousa, de Andrade and da Silva19,Reference Liu, Shi, Li, Li, Lang and Gu69) . The common statistical analysis methods used as metrics are the Mean Absolute Error (MAE), Mean Square Error (MSE), Root-Mean-Square Error (RMSE), R squared (R 2) and chi squared ( $\chi$2). Different criteria to assess the fit of the model can also be found in Refs Reference Sürücü70 and Reference Sürücü71. In this section, the statistical methods to measure the performance of the different numerical methods used for determining the Weibull distribution parameters are briefly explained.
5.1 Root-mean-square error
The Root-Mean-Square Error (RMSE) is a statistic that is often used for evaluating the performance of a model. The RMSE of a model, with regard to a given dataset, is the square root of the mean of the square of each estimation error on all the samples in the dataset. Each individual estimation error is equal to the difference between the actual observation and the estimated observation for the sample(Reference Fürnkranz72). The RMSE can be expressed mathematically as
 \begin{equation}RMSE{\rm =}\sqrt{\frac{{\rm 1}}{N}\sum^N_{k{\rm =1}}{{\left(y_k{\rm -}{\hat{y}}_k\right)}^{{\rm 2}}.}}\end{equation}
It can be seen that, the smaller the RMSE value is, the better the accuracy of the model.
5.2 R squared
R squared (R 2), which is also defined as the coefficient of determination, is another way of measuring the error between the data and model. R 2 values range from 0 to 1. As the value of R 2 converges to 1, the accuracy of the model increases. It can be defined as follows:
 \begin{equation}R^{{\rm 2}}{\rm =1-}\frac{\sum^N_{k{\rm =1}}{{\left(y_k{\rm -}{\hat{y}}_k\right)}^{{\rm 2}}}}{\sum^N_{k{\rm =1}}{{\left(y_k{\rm -}\overline{y}\right)}^{{\rm 2}}}}\end{equation}
where  $\bar{y}$ represents the mean wind speed.
5.3 Chi squared
Chi squared is used to determine the magnitude of the difference between the actual and estimated observations. If the actual observation exactly matches with the estimated observation, then the value of chi squared will be zero. As the difference between the actual and estimated observations grows, the value of chi squared will increase as well. It can be expressed as follows:
 \begin{equation}X^{{\rm 2}}{\rm =}\frac{\sum^N_{k{\rm =1}}{{\left(y_k{\rm -}{\hat{y}}_k\right)}^{{\rm 2}}}}{N{\rm -}n}\end{equation}
where  $n$ is the number of parameters used in the model.
5.4 Mean absolute error
The Mean Absolute Error (MAE) of a model, with regard to a given dataset, is the mean of the absolute values of each estimation error on all the samples in the dataset. Each individual estimation error is equal to the difference between the actual and estimated observation for the sample(Reference Fürnkranz72). The MAE can be expressed mathematically as
 \begin{equation}MAE{\rm =}\frac{{\rm 1}}{N}\sum^N_{k{\rm =1}}{{\rm |}y_k{\rm -}{\hat{y}}_k{\rm |}},\end{equation}
where  ${y_k}$ represents the actual observation,
 ${\hat{y}_k}$ depicts the estimated observation,
 $N$ denotes the number of observations and
 $\left| \cdot \right|$ is the absolute value operator.
Monthly and yearly mean and standard deviation values of the measured wind speed of HPA

6.0 RESULTS AND DISCUSSION
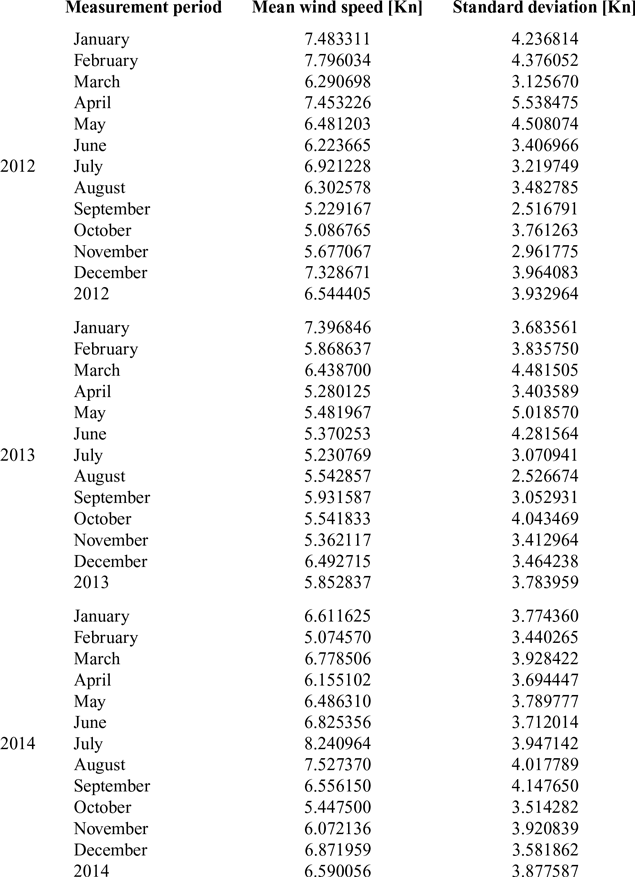
The wind speed data are based on hourly observations from 1 January 2012 to 31 December 2014, with a total of over 27,000 measurements at HPA. The scale and shape parameters of the Weibull distributions are estimated according to the 1-year period of the observations. In Table 4, the mean and standard deviation of the measured wind speed are presented on both a yearly and monthly basis.
According to Table 4, while the maximum mean wind speed peaked in July 2014 at 8.240964Kn, the minimum mean wind speed of 5.074570Kn was observed in February 2014. The maximum standard deviation peaked in April 2012 at 5.538475Kn, while the minimum standard deviation of 2.516791Kn was observed in September 2012.
The estimated scale parameter  $c$ and shape parameter
 $k$ of the yearly Weibull distributions for the mathematical and proposed methods are presented in Tables 5 and 6. In these tables, GA represents the genetic algorithm and PSO represents the particle swarm optimisation method. In addition, while J1 represents the first fitness function based on the probability distribution, J2 represents the second fitness function based on the cumulative distribution.
The estimated scale parameters lie in the range of 1.3935 to 1.9671 with an average of 1.6890. The estimated shape parameters lie in the range of 5.8536 to 7.7783 with an average value of 6.8503. The minimum, maximum and mean values are based on three years of measurements. Therefore, it can be seen that all the existing methods and proposed algorithms are more consistent in the estimation of the scale value  $c$, since the difference between the minimal and maximal estimation is 0.5736. On the other hand, the estimation of the shape value
 $k$ differs slightly in each algorithm, with a maximum difference of 1.9247.
Shape parameter (k) estimation of the yearly Weibull distributions

Scale parameter (c) estimation of the yearly Weibull distributions

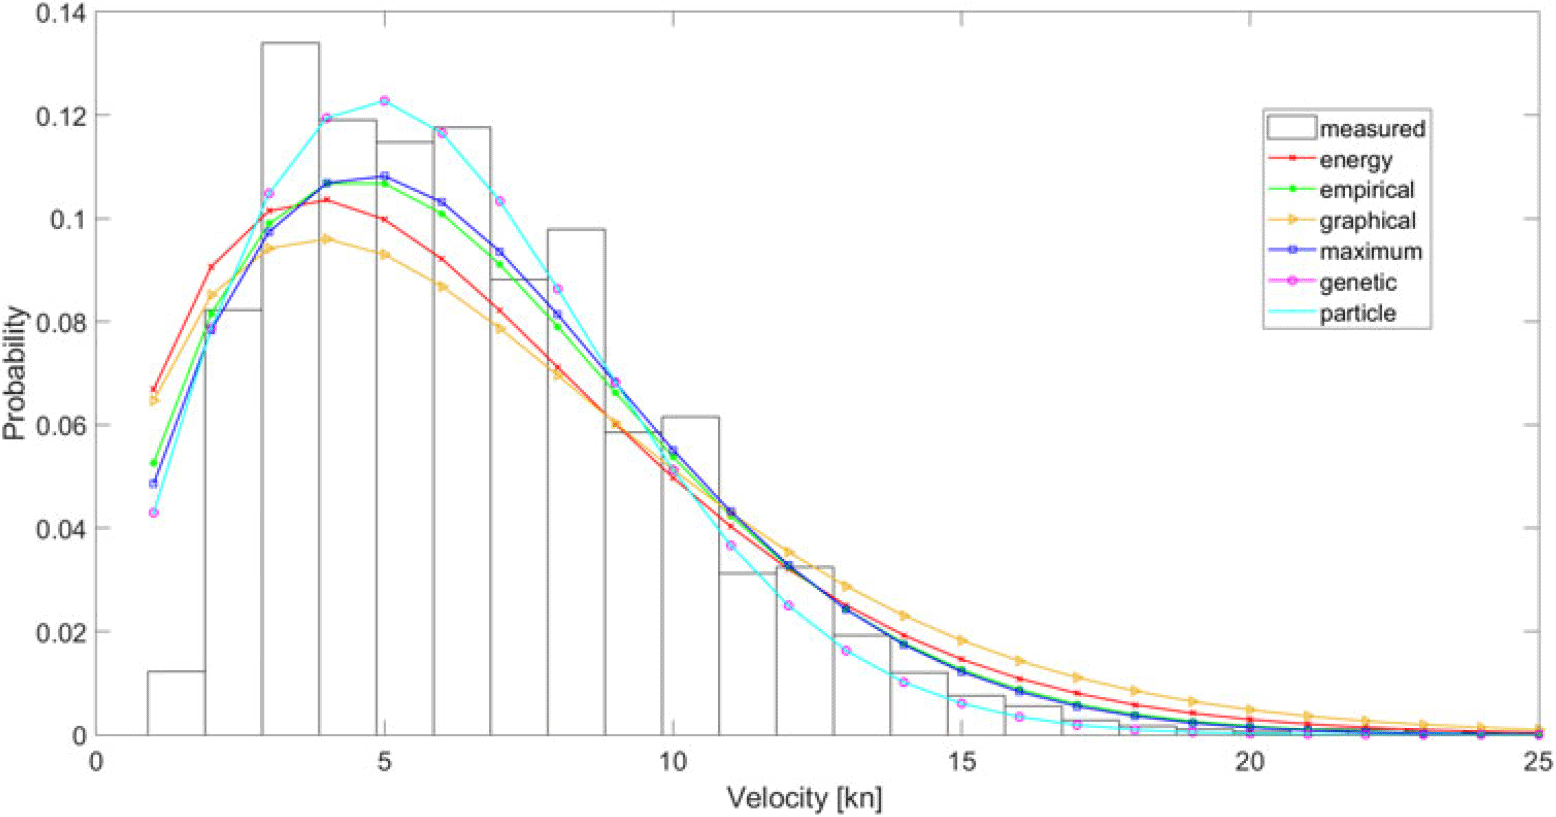
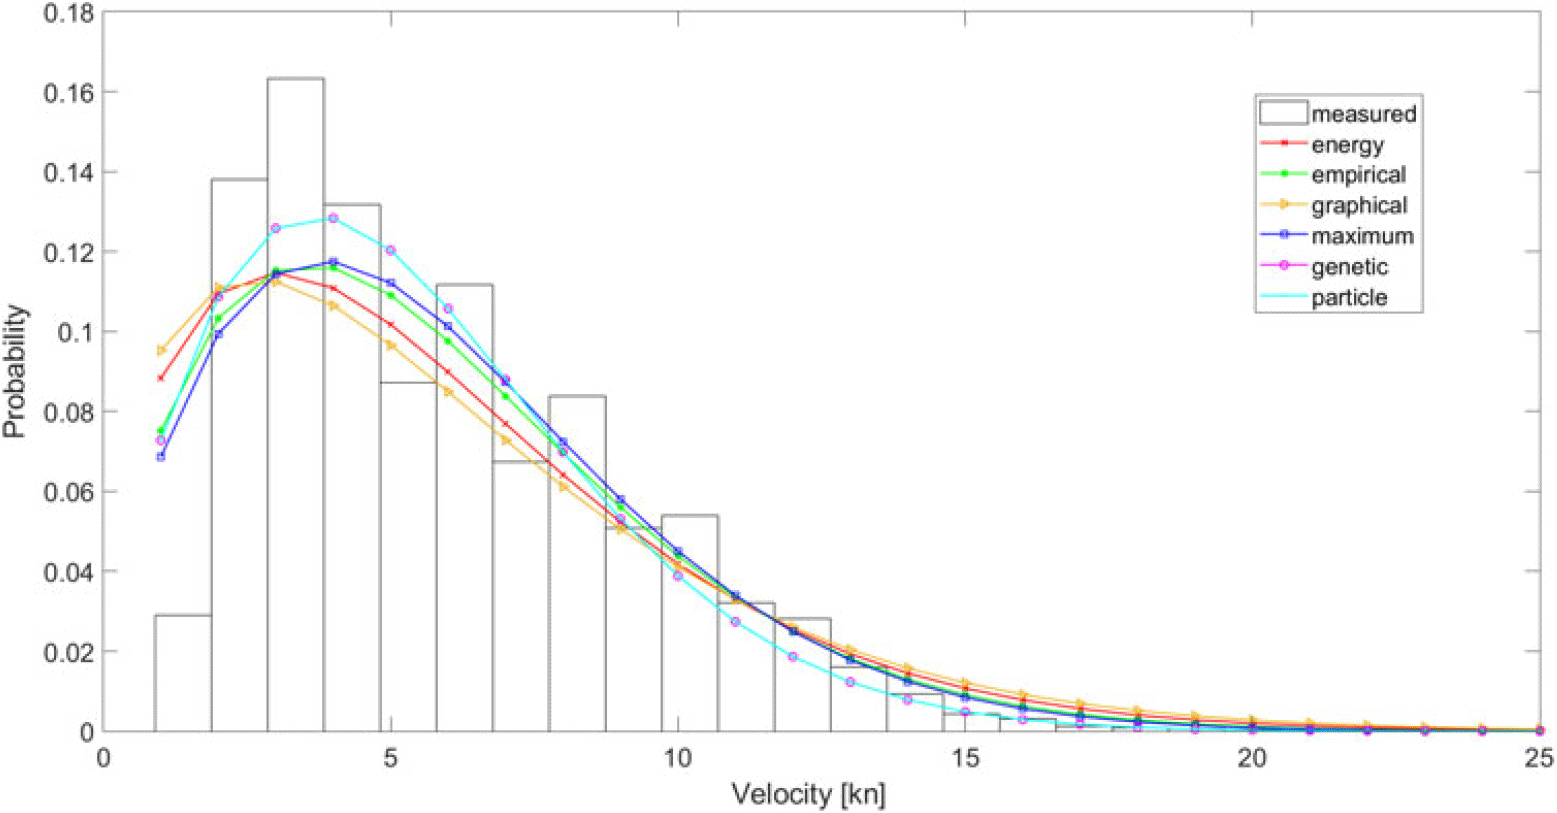
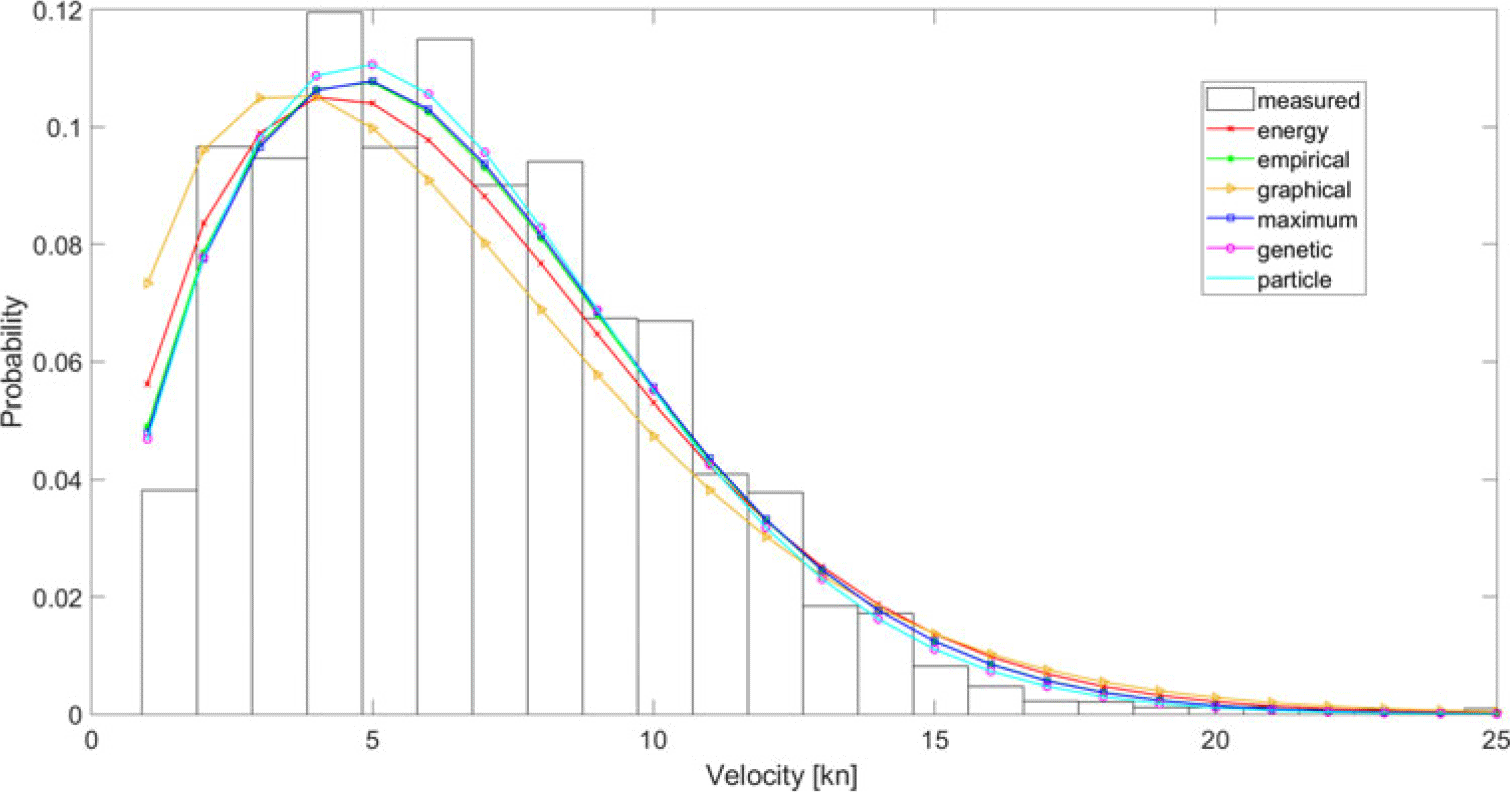
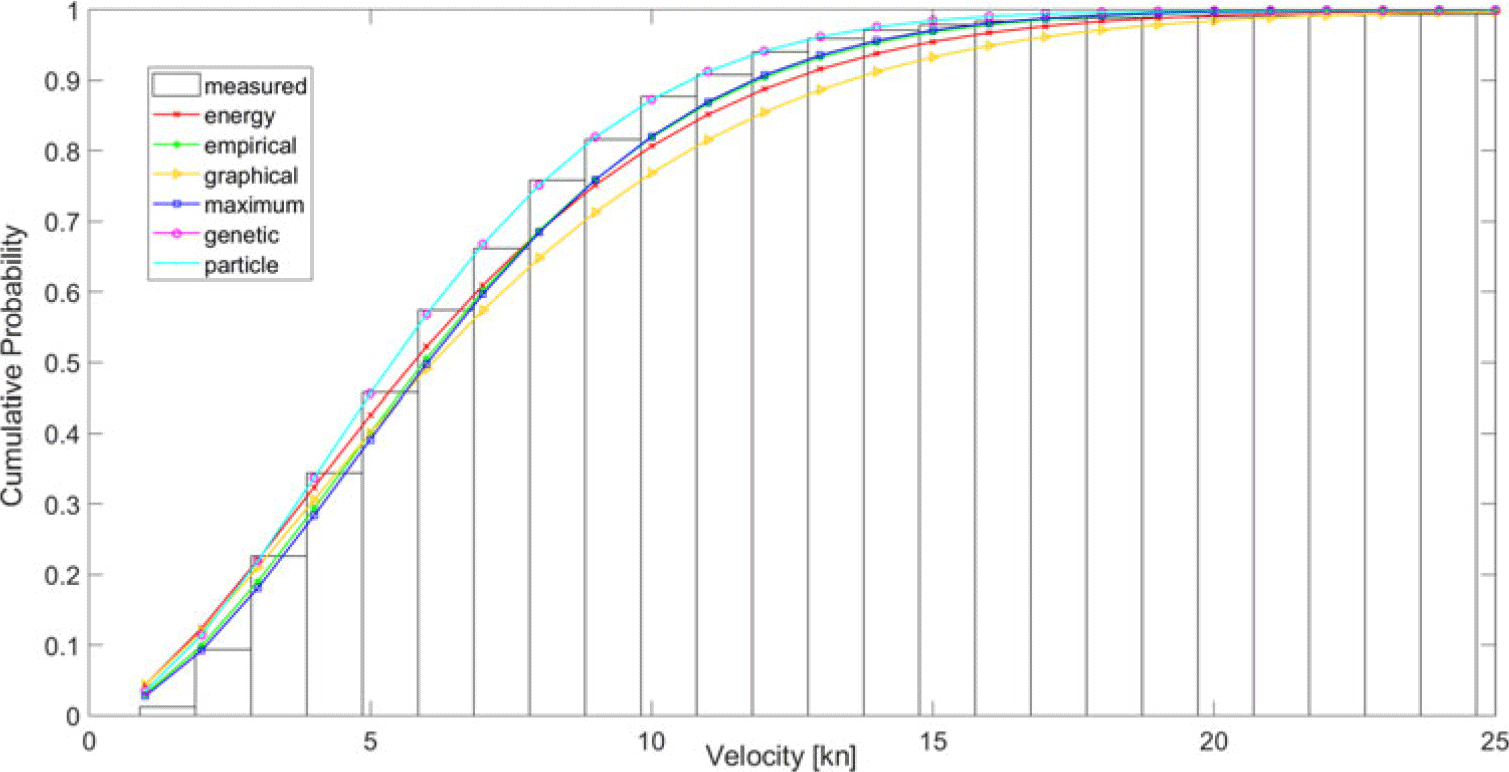
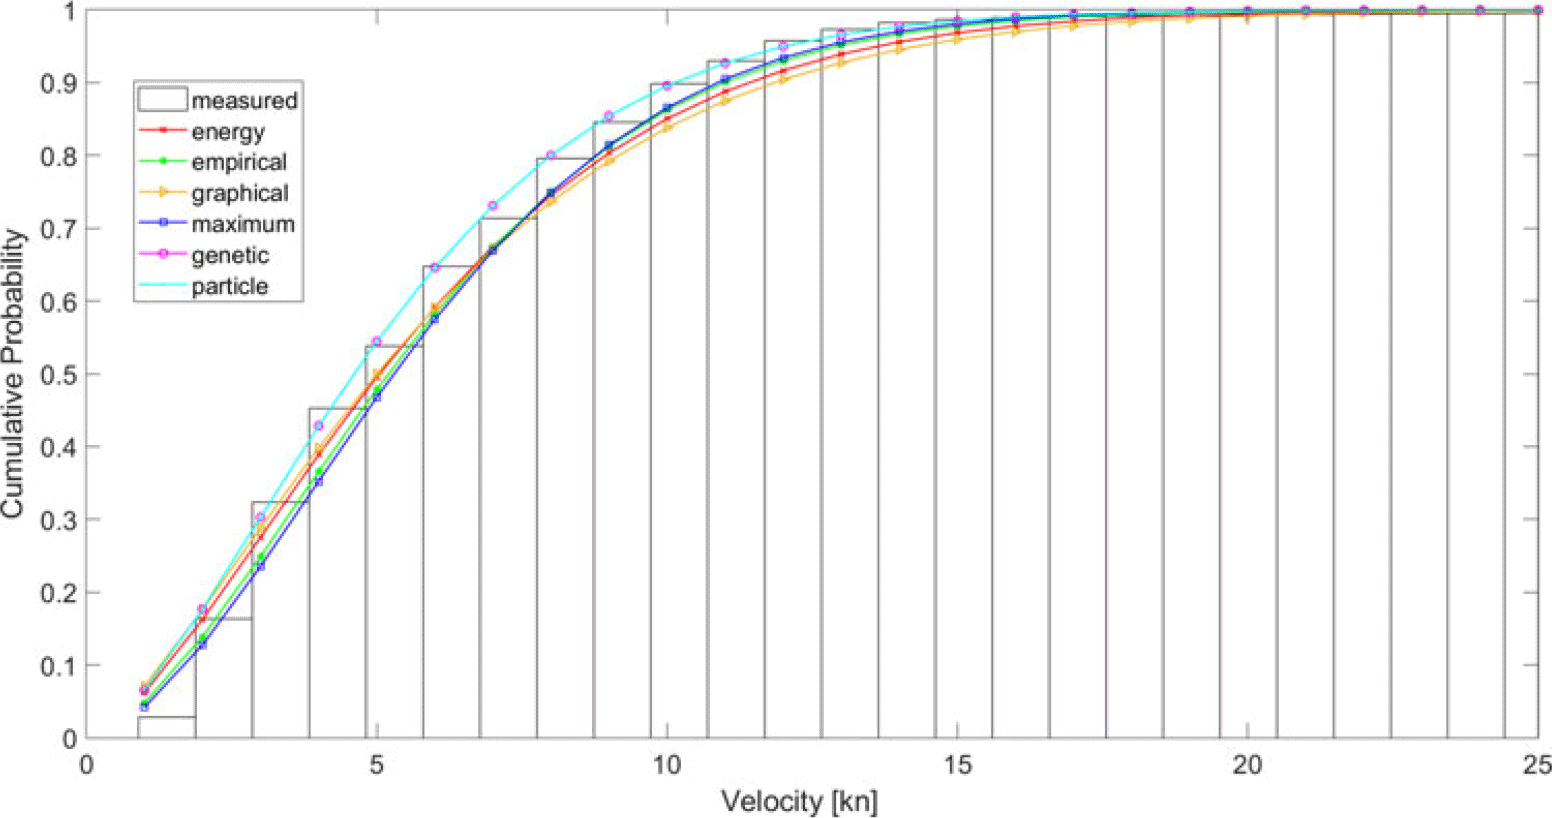
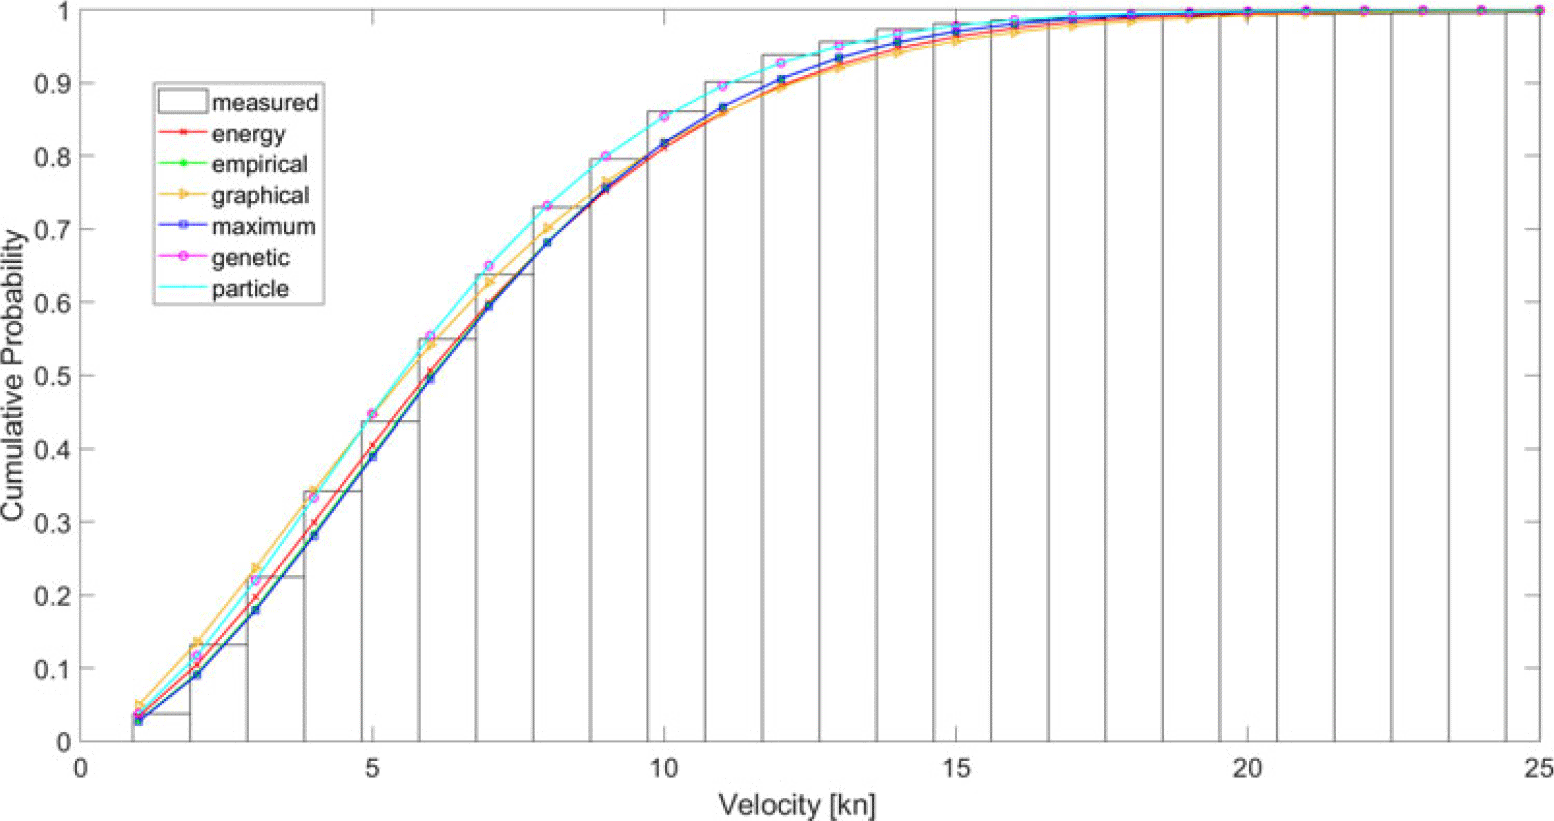
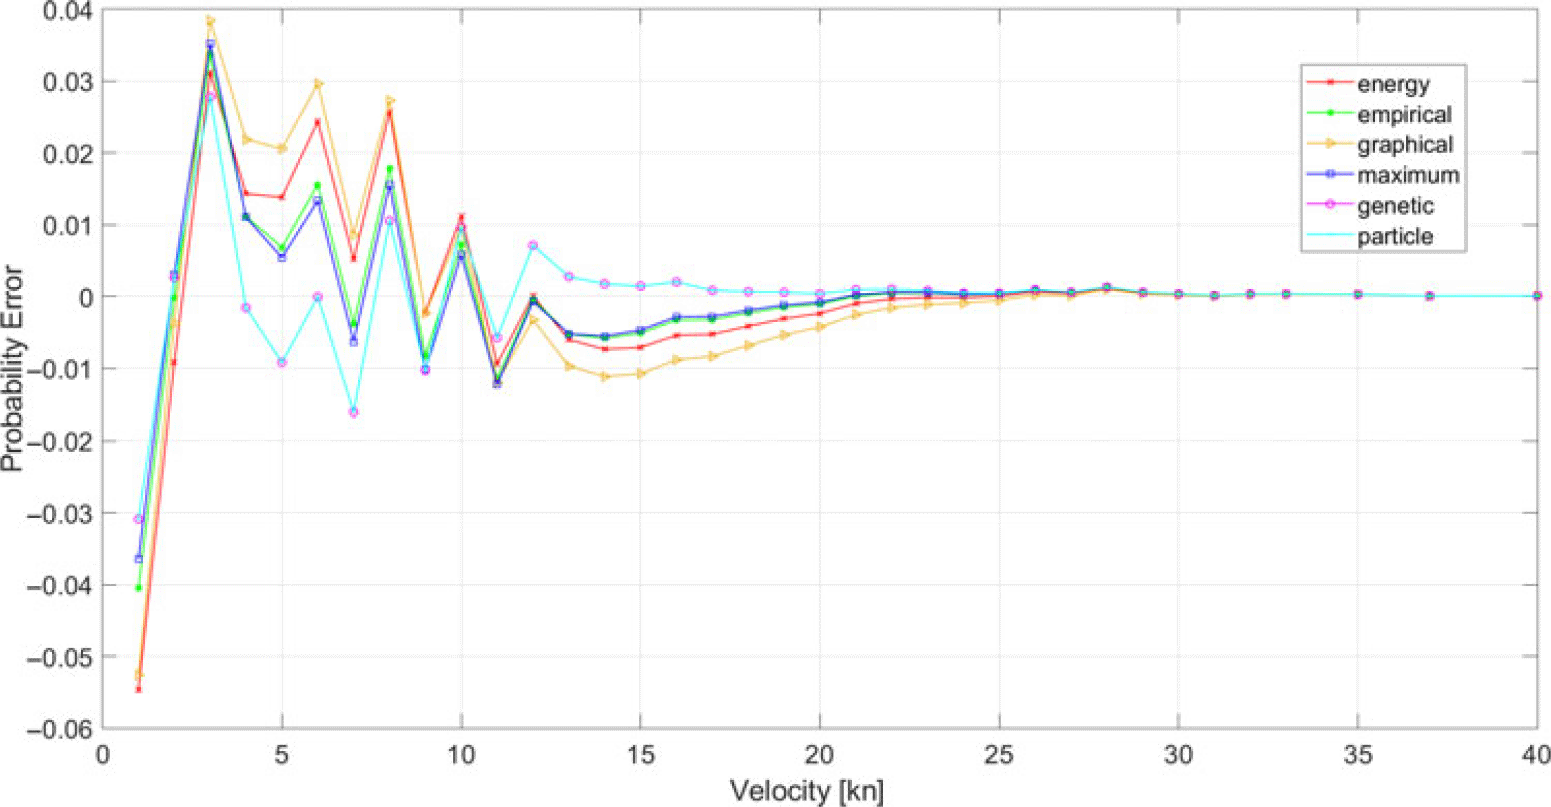
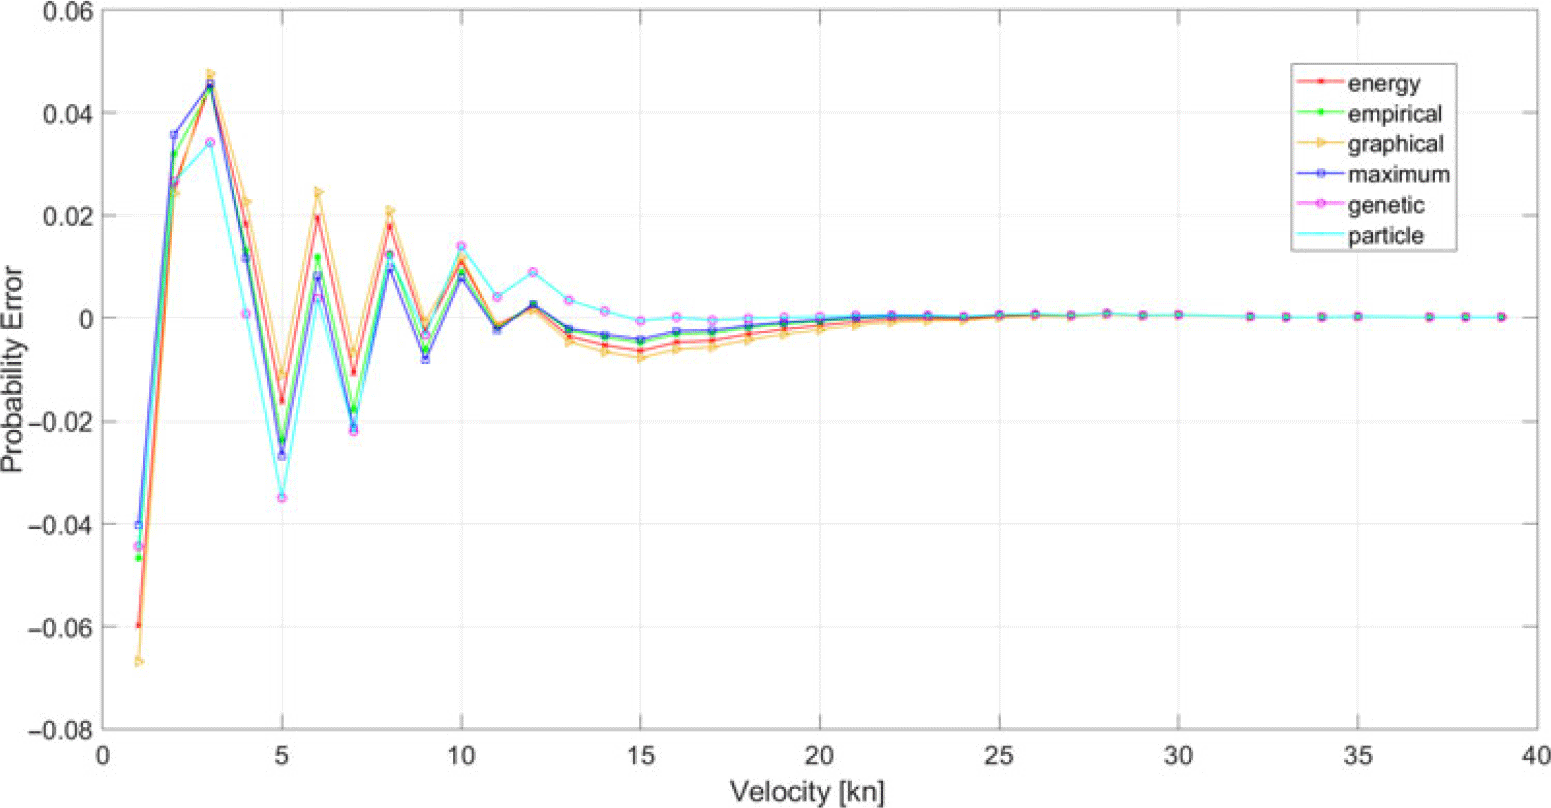
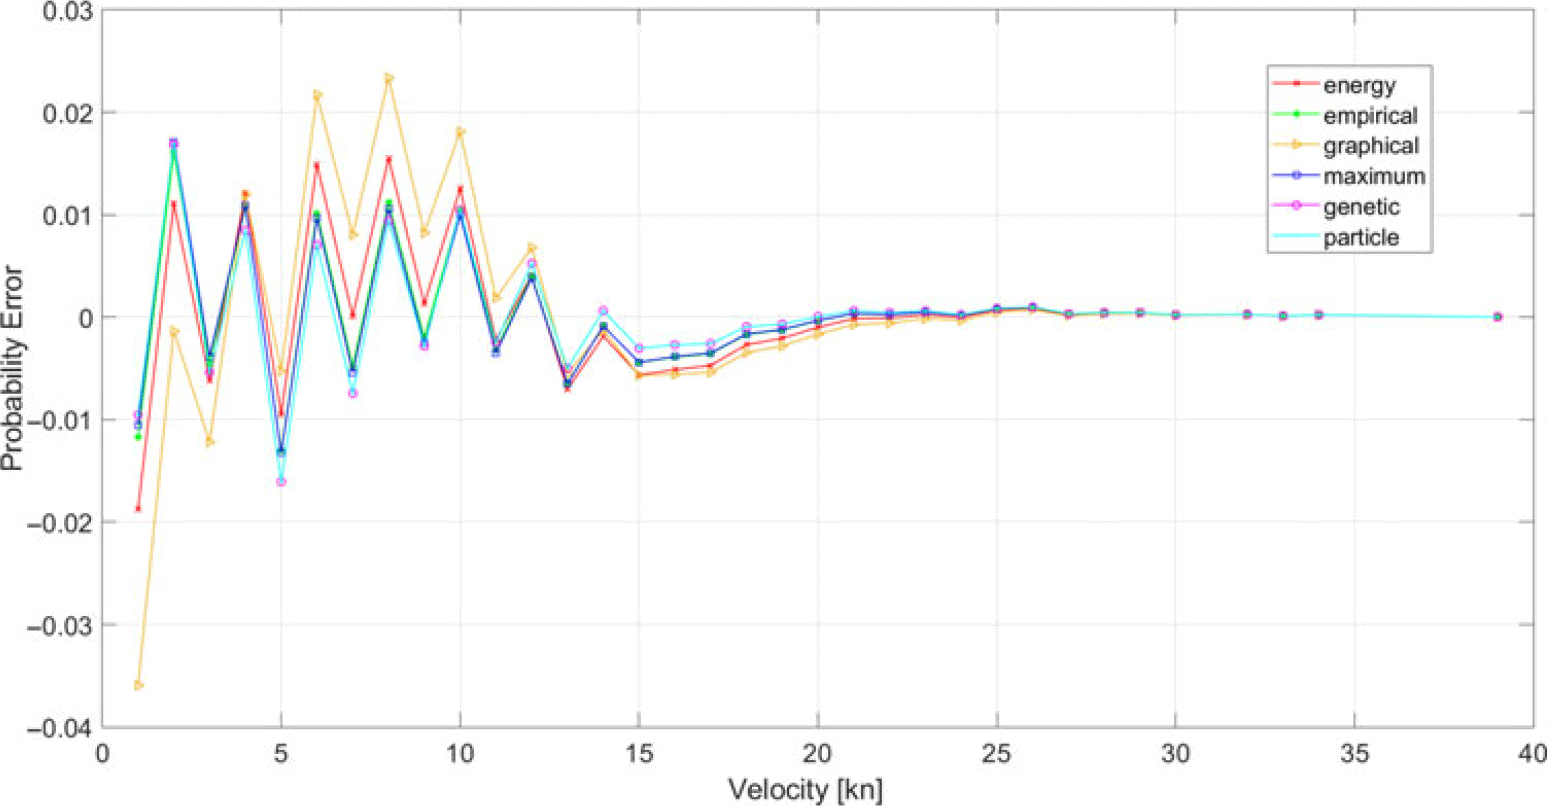
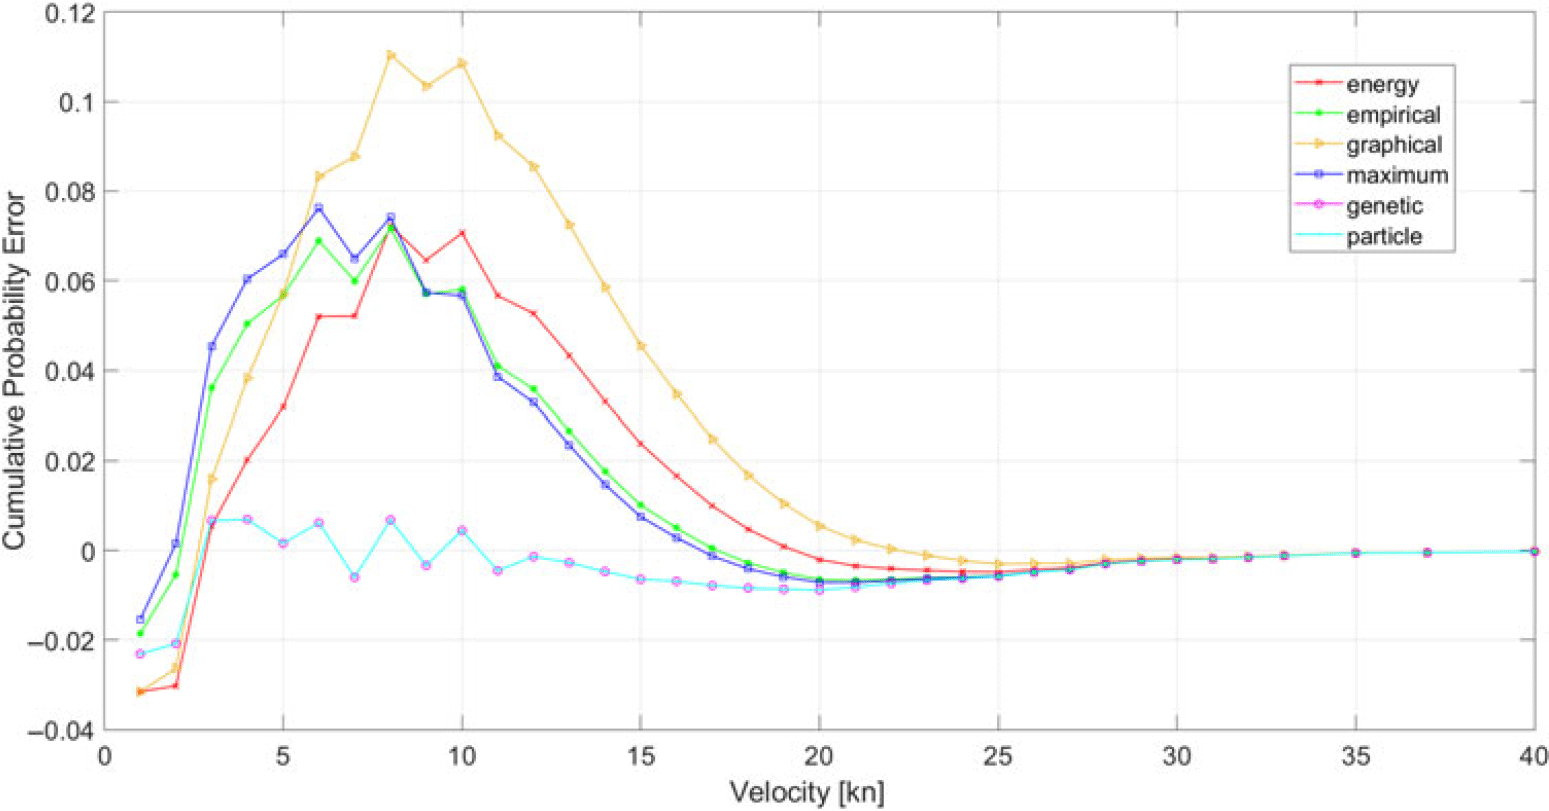
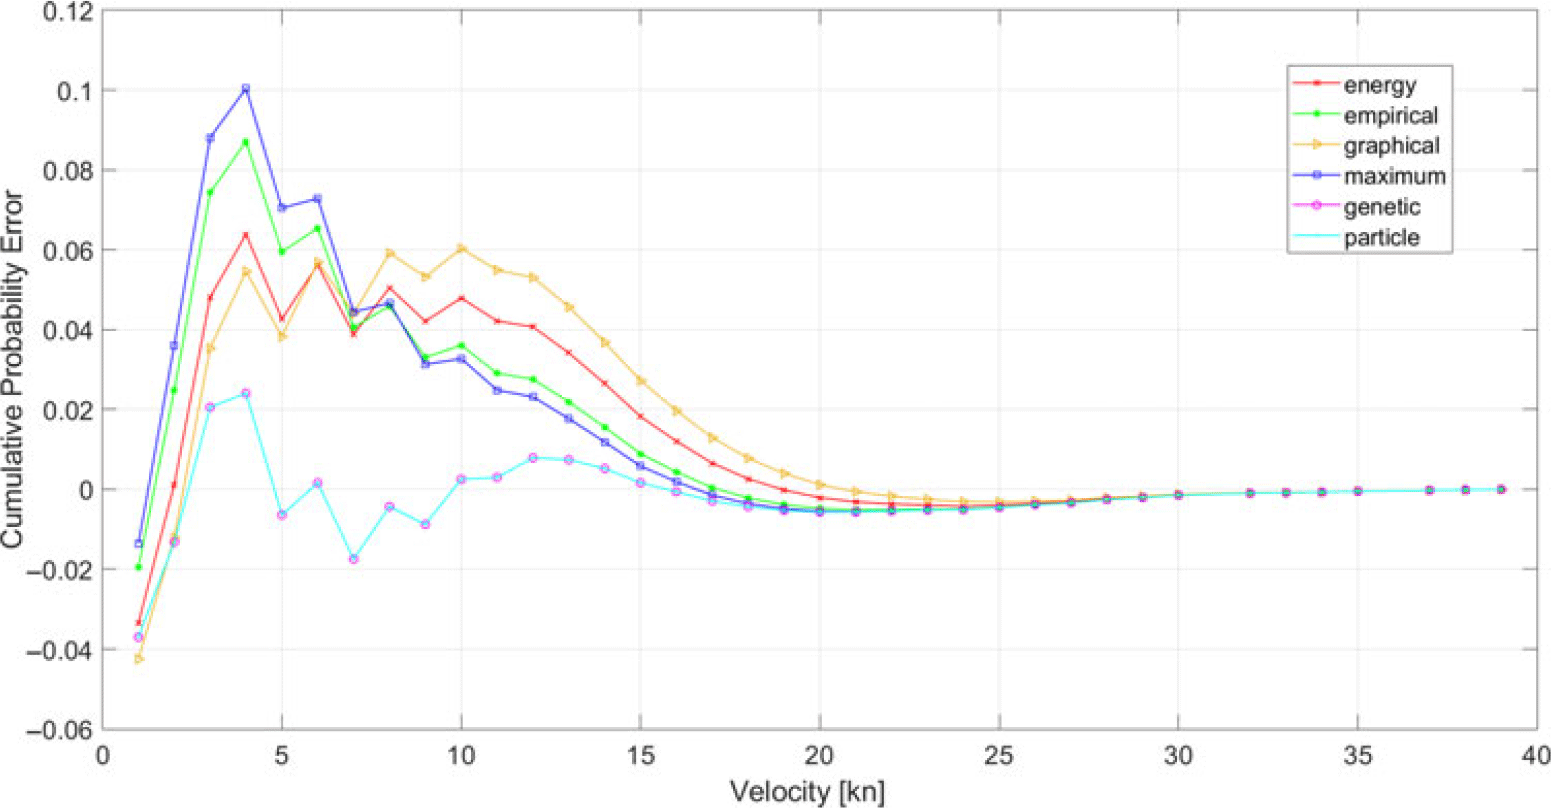
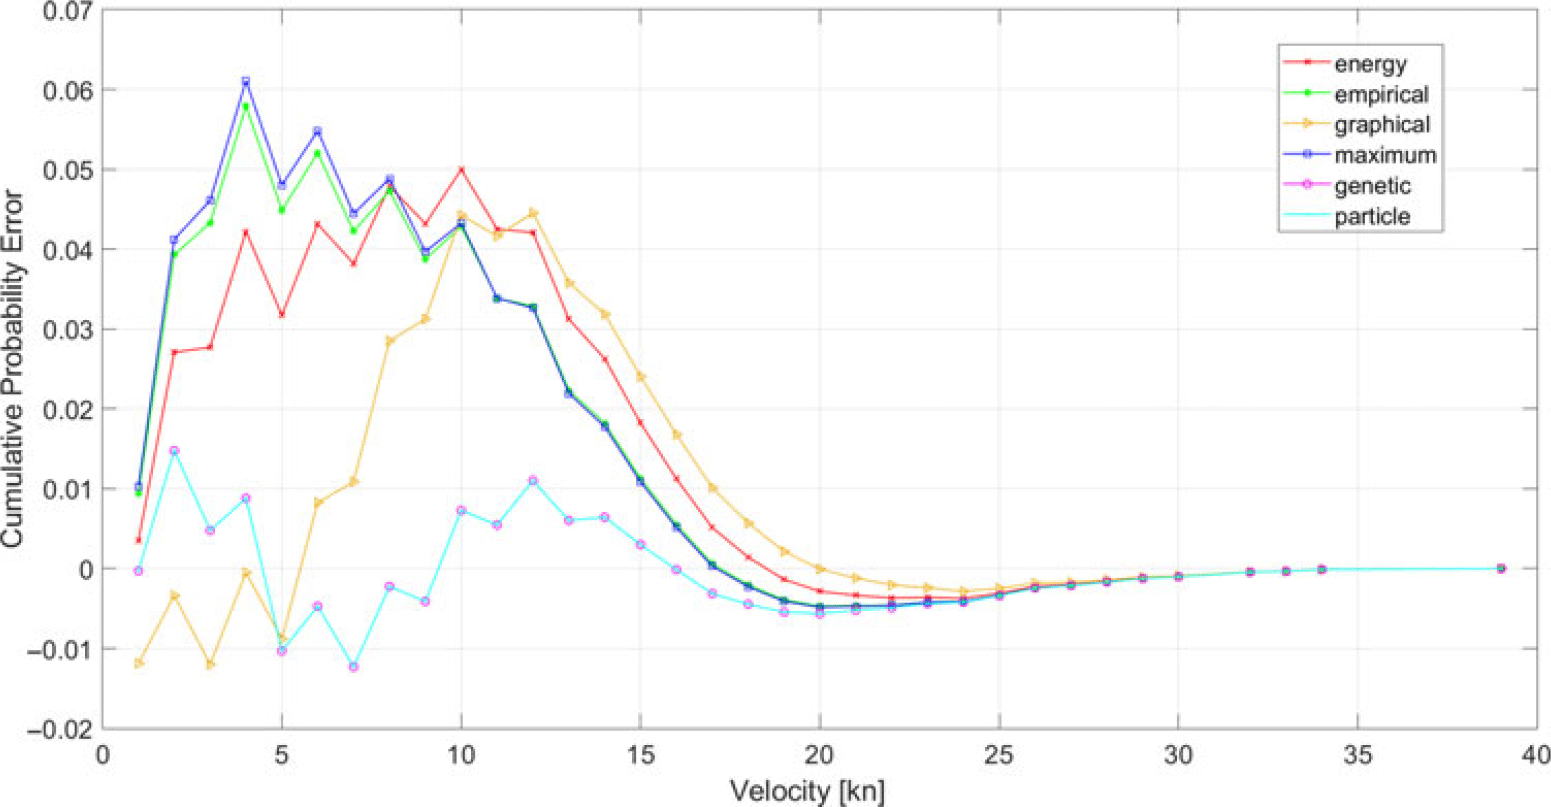
The Weibull probability density functions constructed using the estimated shape and scale parameters are shown in Figs 4–6 in comparison with the measurement histogram. All the methods for defining the Weibull cumulative distribution function are compared in Figs 7–9 with the cumulative histogram of the measurements. The errors between the measurement histograms and the estimated values are shown in Figs 10–15 for both the probability density and cumulative distribution functions. For clarity, the J1 fitness functions are used in the probability density function plots while the J2 fitness functions are used in the cumulative distribution plots. The average wind speed estimations of the algorithms are presented in Table 7.
Average wind speed estimations of the algorithms

Table 8 presents a comparison of the total elapsed time of the algorithms in seconds.
Note that all of the implemented algorithms are capable of estimating the values in milliseconds for the 1-year period of measurements. However, although they are extremely compatible, the estimations by the mathematical methods generally take less time than when using the metaheuristic approaches, except for the empirical method, which is the slowest among the algorithms for all years. While the energy method is generally the fastest algorithm compared with the others, among the metaheuristic approaches, the particle swarm algorithm is generally faster than the genetic algorithm.
Total elapsed time of the algorithms

Comparison of the estimated parameters for the Weibull probability density function (2012).

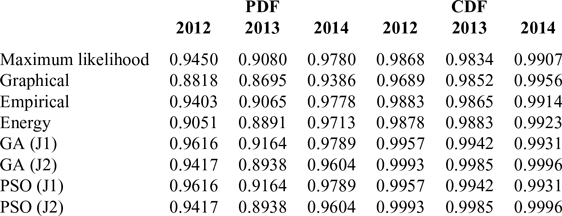
R 2 results of the algorithms

Comparison of the estimated parameters for the Weibull probability density function (2013).

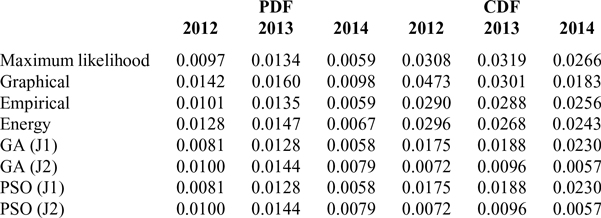
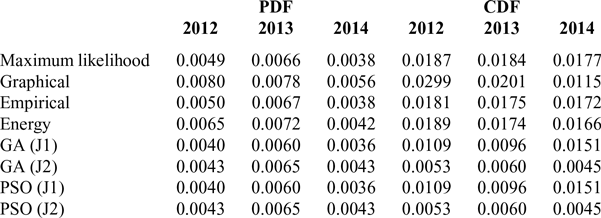
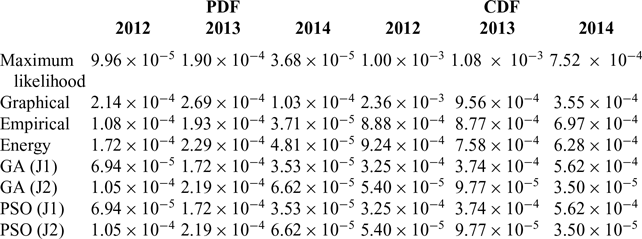
Goodness-of-fit tests for the estimation algorithms were carried out using  $\chi$2, R 2, RMSE and MAE for both the probability density and cumulative distribution functions. The results of these statistical tests are presented in Tables 9–12 for R 2, RMSE, MAE and
 $\chi$2, respectively. For the
 $\chi$2, RMSE and MAE tests, the goodness of fit increases as the value approaches zero. However, for the R 2 test, the goodness of fit increases as the value converges to one.
From these tables, it can be clearly seen that the results of the metaheuristic algorithms have better fitness values according to all of the implemented goodness-of-fit tests. The maximum achievable bound for the R 2 test is one. If the output of the method reaches the maximum bound, then it is said to be optimum fitting. From the results presented in Table 9, it can be seen that both metaheuristic algorithms achieved results as high as 0.9616 for the probability density function and 0.9996 for the cumulative distribution function. According to the results presented in Table 10, both metaheuristic algorithms achieved 0.0058 for the probability density function and 0.0057 for the cumulative distribution function, thus almost converging to the ideal value of zero. In the MAE test results presented in Table 11, metaheuristics again perform betters in comparison with existing methods, reaching values as low as 0.0036 for the probability density function and 0.0045 for the cumulative distribution function. Finally, according to Table 12, the results of the  $\chi$2 test show that all of the algorithms performed well in fitting; however, metaheuristics achieved better results, being closer to the optimum compared with the existing methods.
RMSE results of the algorithms

MAE results of the algorithms

 $\chi$2 results of the algorithms

Comparison of the estimated parameters for the Weibull probability density function (2014).

Comparison of the estimated parameters for the Weibull cumulative distribution function (2012).

Comparison of the estimated parameters for the Weibull cumulative distribution function (2013).

Comparison of the estimated parameters for the Weibull cumulative distribution function (2014).

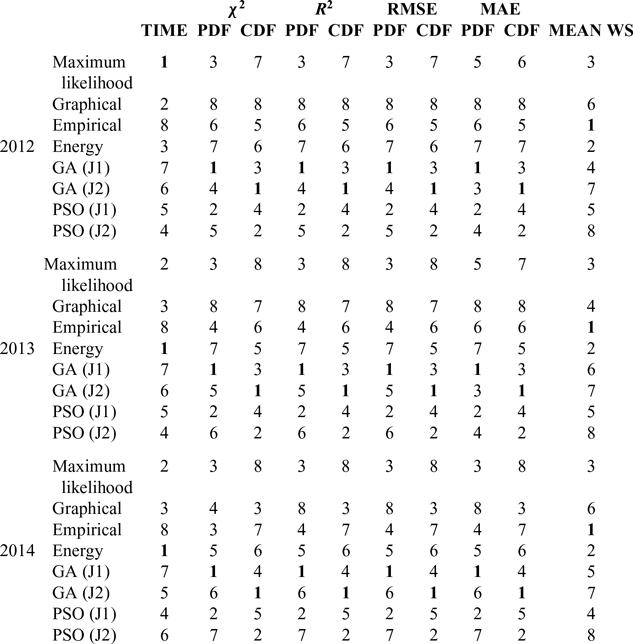
In Table 13, an optimality-based sorting procedure is implemented to compare the performance of the existing and proposed algorithms in terms of the elapsed time, mean wind speed estimation and goodness-of-fit test results. In this comparison, while ‘1’ indicates the optimal algorithm (first rank), ‘8’ denotes the one with the worst performance (last rank). In the time column, the sorting is based on the minimum elapsed time. The optimum algorithm is highlighted in bold. While in the  $\chi$2, RMSE, and MAE columns, the sorting is based on closeness to zero, in the R 2 column, the sorting is based on closeness to one. Finally, the mean wind speed sorting is based on Equation (23), which denotes the smallest distance from the measured mean wind speed.
 \begin{equation}{\min \left\{\left|\overline{y}{\rm -}\hat{y}\right|\right\}\ }\end{equation}
where  $\bar{y}$ denotes the measured mean wind speed,
 $\hat{y}$ denotes the estimated mean wind speed and
 $\left| \cdot \right|$ denotes the absolute value of the difference. It is clear from Table 13 that, according to the
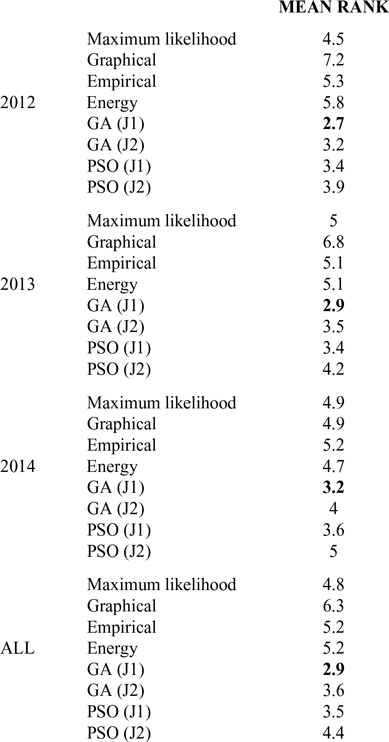
 $\chi$2, RMSE, MAE and R 2 tests, the genetic algorithm with the first objective function always ranks first for the probability density function fitting whereas the genetic algorithm with the second objective function also always ranks first for the cumulative distribution function fitting. The energy method is the fastest of all the algorithms, while the empirical method always ranks first for the estimation of mean wind speed. Table 14 is constructed from the results of Table 13 to provide a global ranking based on the average values of all the comparison methods. Moreover, the average value of the years is calculated for a final comparison of the estimated performance of the algorithms throughout the whole available measurement period.
Weibull probability density function errors of the estimated parameters (2012).

Weibull probability density function errors of the estimated parameters (2013).

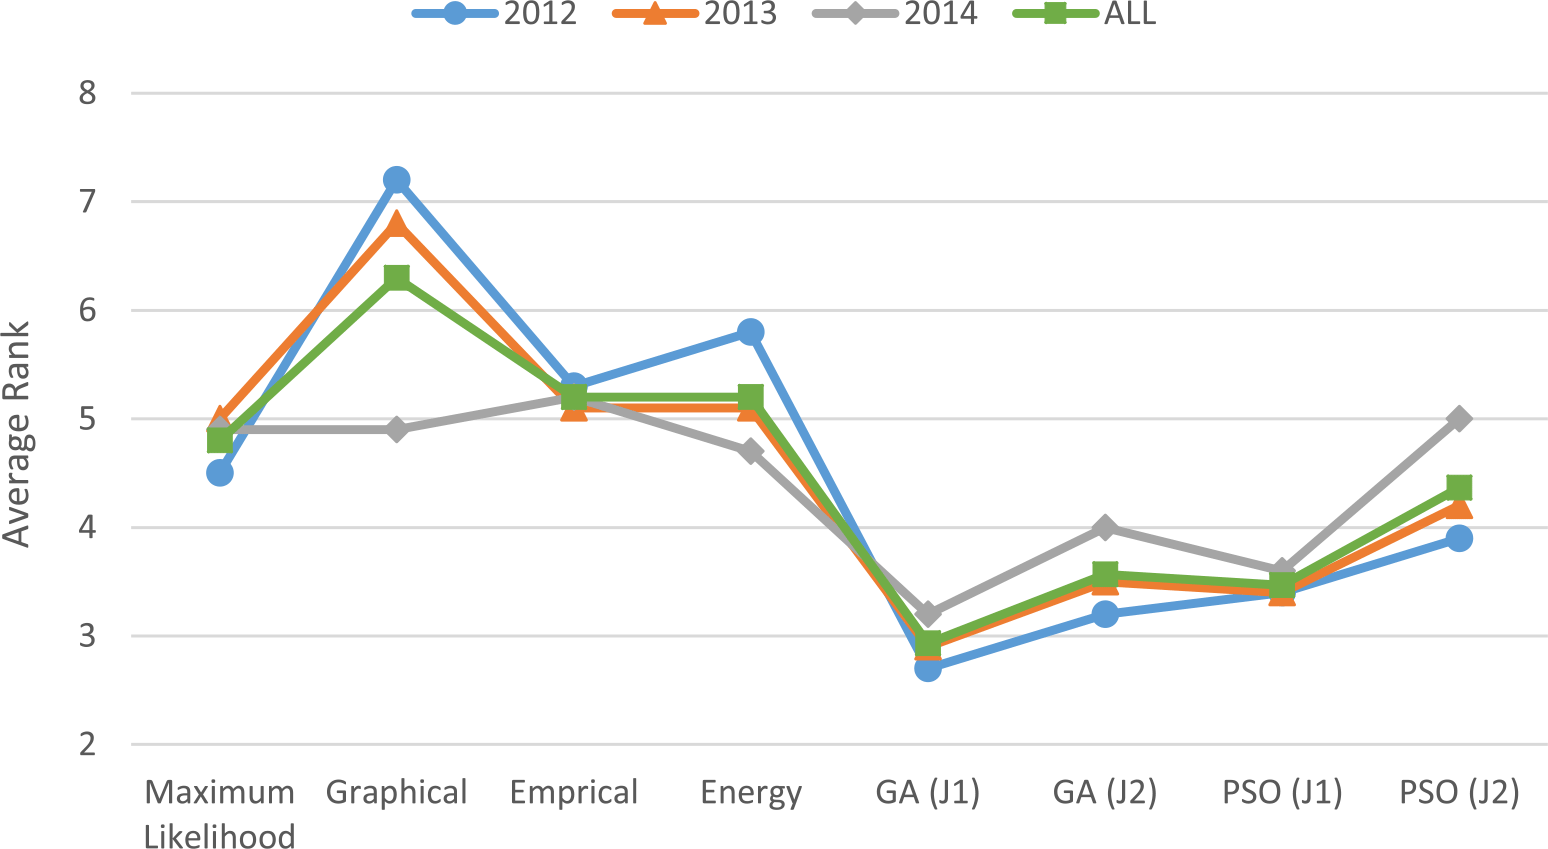
The results presented in Table 14 show that the proposed metaheuristic methods are more suitable for fitting the measured wind speed using both the probability density and cumulative distribution functions. Boldfaces show the minimum mean rank. A graphical distribution of the average ranking over the algorithms is shown in Fig. 16 for all years.
Weibull probability density function errors of the estimated parameters (2014).

Weibull cumulative distribution function errors of the estimated parameters (2012)

Weibull cumulative distribution function errors of the estimated parameters (2013).

Weibull cumulative distribution function errors of the estimated parameters (2014).

7.0 CONCLUDING REMARKS
Two metaheuristic-based algorithms are proposed to estimate the parameters of the Weibull distribution, viz. genetic algorithm-based and particle swarm-based data fitting methods. An objective function is introduced based on the cumulative distribution function. The introduced objective function is based on the minimum RMSE between the measured and estimated parameters of the Weibull distribution. The proposed methods are compared with well-known numerical estimation methods, viz. maximum-likelihood estimation, the graphical method, the empirical method and the equivalent energy method, as well as the existing objective function.  $\chi$2, RMSE, MAE and R 2 statistical tests are conducted to assess the performance of the implemented algorithms based on the goodness of fit. The total time consumption of the algorithms is also analysed and introduced as a secondary performance assessment tool.
According to the results of the statistical tests, the proposed algorithms outrank the numerical methods as well as the existing objective function. In the R 2 test, the proposed algorithms achieve values as high as 0.9616, 0.9164 and 0.9789 for the probability density and 0.9993, 0.9985 and 0.9996 for the cumulative distribution function for the years 2012, 2013 and 2014, respectively. In the RMSE test, the proposed algorithms achieve values as low as 0.0081, 0.00128 and 0.0058 for the probability density and 0.0072, 0.0096 and 0.0057 for the cumulative distribution function for the years 2012, 2013 and 2014, respectively. In the MAE test, the proposed algorithms achieve values as low as 0.0040, 0.0060 and 0.0036 for the probability density and 0.0053, 0.0060 and 0.0045 for the cumulative distribution function for the years 2012, 2013 and 2014, respectively. In the  $\chi$2 test, the proposed algorithms achieve values as low as 6.94 × 10⁻⁵, 1.72 × 10⁻⁴ and 3.53 × 10⁻⁵ for the probability density and 5.40 × 10⁻⁵, 9.77 × 10⁻⁵ and 3.50 × 10⁻⁵ for the cumulative distribution function for the years 2012, 2013 and 2014, respectively.
Mean rank values of the implemented algorithms.

Performance comparison of the algorithms

Mean rank values of the implemented algorithms

The main conclusions drawn from this study can be summarised as follows:
• The proposed metaheuristic-based algorithms outperform the numerical methods for all of the conducted statistical tests, namely
$\chi$2, RMSE, MAE and R 2.• The genetic algorithm-based data fitting method ranked first and the graphical method ranked last out of all the implemented algorithms for all years.
• All of the implemented algorithms are more consistent in estimating the scale parameter in comparison with the shape parameter.
• All of the implemented algorithms are capable of estimating the Weibull parameters in milliseconds for one year of measurement.
• The equivalent energy method is generally the fastest algorithm, while the empirical method is generally the slowest among all the implemented algorithms.
• Numerical estimation methods are more capable of estimating the average wind speed in comparison with metaheuristic methods with the introduced objective functions.
• The particle swarm-based data fitting method is observed to be faster than the genetic algorithm-based data fitting method.
• The genetic algorithm-based data fitting method is observed to be more stable in comparison with the particle swarm-based data fitting method in terms of converging to the global optimum.
• The findings of this paper may cast light on establishing the correct orientation of new runways in the design stage, based on wind data analysis, minimising crosswind components and enhancing the safety and utility of the airport. It can be seen that HPA does not appear to have high enough wind potential to generate power and electricity. This supports the fact that it is a suitable location for the airport.

On the basis of the significant results presented in this study, a general outlook on future research studies can be provided as follows:
• Stochastic distribution models other than the Weibull distribution may be used.
• New metaheuristic algorithms may be employed.
• Wind speed data may be expanded into several regions.