Introduction
Vanadium's main industrial importance is as a ferroalloy, a component of specialised light, highly corrosion-resistant alloys and as a catalyst in polymerising processes. However, it also has increasing use in superconducting magnets and as a dopant that can be used to tune the magnetic and electrical properties of technologically important ferrite spinels [(Fe,Me)3O4] and other oxides, such as TiO2 (Heiba et al., Reference Heiba, Mohamed, Wahba and Almalowi2018; Safarik and Safarikova, Reference Safarik and Safarikova2002; Jolivet et al., Reference Jolivet, Tronc and Chaneac2002). In particular, vanadium substituted magnetites, Fe3–xVxO4, have a specific potential as catalysts in organic reactions, due to their facilitation of electron transfer processes (Liang et al., Reference Liang, Zhu, Zhong, Zhu, Yuan, He and Zhang2010).
Vanadium is an environmental toxin and is bioavailable in the toxic, oxidised forms V(IV) as vanadyl (VO2+) and (the most soluble, toxic form) V(V) as vanadate (HVO22–) (Evans and Barabash Reference Evans and Barabash2010, Taylor et al., Reference Taylor, Keith, Cseh, Chappell, Rhoades and Hueber2012, Ortiz-Bernad et al., Reference Ortiz-Bernad, Anderson, Vrionis and Lovley2004). As V(V) and V(IV) are either used in, or produced as, residua from industrial processes, both are found in soils associated with the extractive industries, including mining and petroleum (Ortiz-Bernad et al., Reference Ortiz-Bernad, Anderson, Vrionis and Lovley2004, Bredberg et al., Reference Bredberg, Karlsson and Holst2004). The least toxic and stable form of vanadium is V(III). These variable oxidation states (V(II)–V(V)) with different toxicities and mobilities, and its potential in tunable spintronic materials makes the study of the environmental and technological behaviour of vanadium both intriguing and important.
In this study we focus on the bacterial reduction of V(V) and its incorporation into the ferrite spinel magnetite, Fe3–xVxO4, relevant to environmental cycling and bio-production of V-doped bionanoparticles. Anaerobic, Fe(III)-reducing bacteria are able to respire many oxidised metal species such as Fe(III), Mn(VI) and V(V) by coupling metal reduction to oxidation of naturally occurring organic compounds (Ortiz-Bernad et al., Reference Ortiz-Bernad, Anderson, Vrionis and Lovley2004; Lloyd, Reference Lloyd2003; Carpentier et al., Reference Carpentier, Sandra, De Smet, Brige, De Smet and Van Beeumen2003, Lovley, Reference Lovley1993). Reduction of amorphous Fe(III)-oxyhydroxides, for example using Geobacter sulfurreducens (Caccavo et al., Reference Caccavo, Lonergan, Lovley, Davis, Stolz and McInerney1994), can lead to the formation of nano-sized particles of magnetite (Fe2+Fe3+2O4). The significant technological potential of this process has been demonstrated by the production of bionanomagnetites containing Co, Ni, Mn and Zn by the controlled doping of the Fe(III)-hydroxide precursor; these bionanomagnetites have different physical and superior electrical and magnetic properties to their inorganic equivalents (Byrne et al., Reference Byrne, Telling, Coker, Pattrick, van der Laan, Arenholz, Tuna and Lloyd2011; Byrne et al., Reference Byrne, Coker, Moise, Wincott, Vaughan, Tuna, Arenholz, van der Laan, Pattrick, Lloyd and Telling2013; Coker et al., Reference Coker, Telling, van der Laan, Pattrick, Pearce, Arenholz, Tuna, Winpenny and Lloyd2009; Moon et al., Reference Moon, Yeary, Rondinone, Rawn, Kirkham, Roh, Love and Phelps2007). The production of vanadium doped, spinel ferrite bionanoparticles has not been examined in detail. Previous work on the interaction of metal-reducing bacteria with vanadium has, however, found that G. metallireducens and S. oneidensis MR-1 were both able to couple growth to the direct enzymatic reduction of V(V), subsequently precipitating V(IV) compounds (Ortiz-Bernad et al., Reference Ortiz-Bernad, Anderson, Vrionis and Lovley2004; Carpentier et al., Reference Carpentier, Sandra, De Smet, Brige, De Smet and Van Beeumen2003). In addition, Pseudomonas sp. is thought to be able to reduce V(V) to V(III) during extended incubation (Lovley, Reference Lovley1993; Yurkova and Lyalikova, Reference Yurkova and Lyalikova1991). Recently a mixed anaerobic culture was identified as being able to reduce V(V) to V(IV), with Enterobacter and Lactococcus species implicated in this process (Zhang et al., Reference Zhang, Hao, Tian, Tuan, Feng, Ni and Borthwick2015).
Using a combination of infrared, Mössbauer and X-ray spectroscopies, Nivoix and Gillot (Reference Nivoix and Gillot2000) and Nohair et al. (Reference Nohair, Aymes, Perriat and Gillot1995) determined that abiotically produced vanadium-substituted magnetite predominantly contains V(III) in octahedral sites replacing Fe(III). Other studies have presumed mixtures of either V(III) + V(II) or V(III) + V(IV) present in spinel structure minerals (Kim et al., Reference Kim, Choi, Lee, Lee and Park2007a, Reference Kim, Choi, Park, Lee, Park and Kimb; Bordage et al., Reference Bordage, Balan, Villiers, Cromarty, Juhin, Carvallo, Calas, Sunder Raju and Glatzel2011). In the natural environment, vanadium is present at economic concentrations in igneous intrusions containing titaniferous magnetites (Cawthorn and Molyneaux, Reference Cawthorn, Molyneaux, Anhaeusser and Maske1986; Zhou et al., Reference Zhou, Robinson, Lesher, Keays, Zhang and Malpas2005); in this case the oxidation state in the magnetites has been found to be predominantly V(III) with minor amounts of V(IV), both residing in octahedral sites within the spinel structure (Balan et al., Reference Balan, De Villiers, Eeckhout, Glatzel, Toplis, Fritsch, Allard, Galoisy and Calas2006). In the current study we also examined V-magnetite from the Bushveld complex using our X-ray absorption spectroscopy – X-ray magnetic circular dichroism (XAS–XMCD) methodology to provide a direct comparison with existing information (on abiotic) magnetite.
Materials and methods
Fe/V-hydroxyoxide formation
Synthetic amorphous Fe(III)/V-oxyhydroxide was produced using the method of Lovley and Phillips (Reference Lovley and Phillips1986), where a 0.4 M solution of FeCl3 is neutralised by 10 N NaOH to pH 7, and the solid then washed in deionised water until no Cl– ions remain. In this study 1, 5 and 10 wt.% sodium metavanadate (V(V)) was added, so that precipitates of Fe/V-oxyhydroxides formed. Concentrations of the cations in the Fe/V-hydroxyoxides were determined after extraction in concentrated nitric acid using inductively coupled plasma atomic emission spectroscopy (ICP-AES) (VG Elemental, Winsford, UK) with a 1m Czerny-Turner spectrometer with a 2400 lines/mm diffraction grating. Structural information was provided by X-ray diffraction (XRD) analysis, conducted on a Bruker D8Advance instrument using CuKα1 radiation.
Metal reduction
G. sulfurreducens was obtained from our laboratory culture collection in Earth and Environmental Sciences at The University of Manchester and grown under strictly anaerobic conditions at 30°C in modified fresh water medium as described previously (Lloyd et al., Reference Lloyd, Leang, Hodges Myerson, Coppi, Cuifo, Methe, Sandler and Lovley2003). Sodium acetate (20 mM) and fumarate (40 mM) were provided as the electron donor and acceptor, respectively. All manipulations were done under an atmosphere of N2–CO2 (80:20). Late log-phase cultures of G. sulfurreducens were harvested by centrifugation at 4920 g for 20 min. and washed twice in bicarbonate buffer (NaHCO3, 30 mM and pH 7.1) under N2–CO2 (80:20) gas prior to use. Aliquots of the washed cell suspension (0.2 mL) were added to sealed anaerobic bottles containing 9.8 ml bicarbonate buffer. The final concentration of bacteria was ~0.2 mg protein per mL. The following additions were made from anaerobic stocks as required; a Fe(III)-oxyhydroxide suspension (50 mmol. L–1) and sodium acetate (20 mM). Bottles were incubated in the dark at 30°C. Samples were monitored for Fe(III) reduction using the ferrozine method (Stookey, Reference Stookey1970).
Transmission electron microscopy
Samples were washed twice in deionised water to remove cells and buffer solution. Aliquots of the sample suspension were then dropped on carbon coated copper grids and left to dry prior to introduction to the microscope. Imaging of the samples was undertaken using a Tecnai F30 transmission electron microscope (TEM).
X-ray absorption spectroscopy
To determine the coordination environment, oxidation state and site occupancy of Fe and V in starting compounds and products in the bioreduction processes, L 2,3-edge XAS was employed. In the case of the ferrimagnetic magnetite nanoparticles produced, the element- and site-specific technique XMCD was used (Pattrick et al., Reference Pattrick, van der Laan, Henderson, Kuiper, Dudzik and Vaughan2002). The XAS spectra were collected on beamline I06 at the Diamond Light Source (DLS), Didcot, UK, using the portable octupole magnet system (van der Laan and Figueroa, Reference van der Laan and Figueroa2014) and on beamline 4.0.2 at the Advanced Light Source (ALS), Berkeley, CA, using the vector magnet endstation (Arenholz and Prestemon, Reference Arenholz and Prestemon2005). Samples were prepared by washing aliquots of starting materials and products in deionised water before drying under anaerobic conditions. The powders were then mounted in an anaerobic cabinet on carbon tape attached to the sample manipulator. Samples were kept anaerobic throughout insertion into the endstation vacuum. The specimen was positioned central to the magnetic pole pieces, with the surface perpendicular to the beam direction, which was along the magnetic field direction. The beam size used for these ‘powdered’ samples was ~1.0 mm × 0.5 mm. The XAS was monitored in total-electron yield (TEY) mode, which gives an effective probing depth of ~4 nm. To obtain XMCD spectra, at each energy point the XAS was measured for the two opposite magnetisation directions by reversing an applied field of 0.6 T (van der Laan and Figueroa, Reference van der Laan and Figueroa2014). The XAS spectra of the two magnetisation directions were normalised to the incident beam intensity and subtracted from each other to give an XMCD spectrum (Pattrick et al., Reference Pattrick, van der Laan, Henderson, Kuiper, Dudzik and Vaughan2002). Energy calibration was monitored continuously during data collection, using the main Fe L 3 peak energy of 709.0 eV for natural (Kiruna) magnetite; energy resolution is in the order of 0.3 eV at the Fe L 2,3-edge and spot size 1 mm × 0.5 mm.
X-ray magnetic circular dichroism has proved particularly useful in understanding oxidation states and site occupancy in dopedmagnetites. End-member magnetite, [Fe(II)Oh][Fe(III)Oh][Fe(III)Td]O4 has a cubic inverse spinel structure with one quarter of the tetrahedral (Td) and one half of the octahedral (Oh) sites filled by iron with the Fe(III) equally split between Td and Oh sites and Fe(II) occupies only Oh sites. Thus, in pure stoichiometric magnetite the Fe can be described as being distributed in a 1:1:1 ratio as d 6Oh, d 5Td and d 5Oh. At the transition metal L 2,3 edge, X-rays excite 2p core electrons by electric-dipole transitions into (partially) localised unoccupied 3d states such that XAS and XMCD provide information about the local electronic and magnetic structure of the absorbing atom (van der Laan and Thole, Reference van der Laan and Thole1991). The spectrum is split by the 2p spin-orbit interaction into two structures: the L 3 and L 2 edge. For magnetite, the Fe L 3 XMCD spectrum consists of three main peaks with negative, positive and negative intensity, which are proportional to the Fe occupation of the Fe d 6Oh, d 5Td and d 5Oh sites, respectively (Pattrick et al., Reference Pattrick, van der Laan, Henderson, Kuiper, Dudzik and Vaughan2002). To obtain the relative occupancy of these three Fe sites, the experimental spectra were fitted by means of a non-linear least-squares analysis, using calculated spectra for each of the Fe sites (see Fig. 3c). In these calculations, as described in van der Laan and Thole (Reference van der Laan and Thole1991), the Hartree-Fock Slater integrals for the 3d–3d and 2p–3d Coulomb and exchange interactions were scaled to 70% and 80%, respectively, and the crystal field strengths for the Oh and Td sites were taken to be 10Dq = 1.2 eV and –0.6 eV, respectively. The calculated Fe L 2,3-edge spectra were convoluted by a Lorentzian of half-width half-maximum σ = 0.3 (0.5) eV for the L 3 (L 2) edge to account for intrinsic core-hole lifetime broadening and by a Gaussian of standard deviation Γ = 0.2 eV to account for instrumental broadening. Although a cation site occupancy ratio of 1:1:1 is expected, in practice, comparative XMCD analysis of extracellular biogenic magnetite and natural magnetite, showed the former to be oxygen deficient and to have excess Fe2+ (d 6Oh component ≈ 1.06), while natural magnetites are cation/Fe2+ deficient (d 6Oh ≈ 0.88) (Coker et al., Reference Coker, Pearce, Lang, van der Laan, Pattrick, Telling, Schüler, Arenholz and Lloyd2007). Vanadium L 2,3-edge spectra derived from ferrimagnetic phases also provide XMCD spectra and for their analysis, calculations were optimised by scaling the Coulomb and exchange interactions to 65% of the atomic values, the Oh crystal field was taken to be 10Dq = 2.0 eV, and the spectra were convoluted by Γ = 0.2 (0.4) eV for L 3 (L 2) and σ = 0.3 eV. In all cases, the 3d and 2p spin-orbit interactions were taken at 100% and 95%, respectively, of their calculated atomic values, which are tabulated in van der Laan and Kirkman (Reference van der Laan and Kirkman1992).
It is important to note that the L-edge XAS data provide information on all the phases containing either Fe or V in the samples which in some cases comes from 2 phases. Crucially XMCD only produces V and Fe spectra from the ferrimagnetic phases present and therefore is able to extract information exclusively from the biomagnetite present, with no contribution from goethite, siderite and ferrihydrite.
Results and discussion
The vanadium content, derived from ICP–AES analyses, of the Fe/V-hydroxyoxides produced was 0.8±0.2 wt.%, 4.2±0.6 wt.% and 7.4±0.4 wt.% V, close to the initial amounts of V(V) added to the starting solutions. Subsequent to addition of the Fe(III)-reducing bacterium G. sulfurreducens to experiments, Fe(III) reduction was observed in all samples containing bacteria, with larger quantities of Fe(II) found in those samples that contained anthraquinone-2,6-disulfonate (AQDS) (Fig. 1), as seen previously by Coker et al. (Reference Coker, Pearce, Pattrick, van der Laan, Telling, Charnock, Arenholz and Lloyd2008a). No Fe(II) formation or colour change was observed in the control samples (Fig. 1, green data). All experiments reached a steady concentration of Fe(II) within the first 24 h, with those samples containing either 4.2 wt.% or 7.4 wt.% vanadium reaching a higher final value of Fe(II) than for 0 wt.% vanadium (Fig. 1). Samples produced using AQDS as an electron shuttle were used in the remainder of this study.
Fe(II) production data collected for experiments including G. sulfurreducens and ferrihydrite containing (a) 0 wt.% V; (b) 0.8 wt.% V, (c) 4.2 wt.% V and (d) 7.4 wt.% vanadium. Data from the control with no bacteria are green, the data involving just an electron donor (sodium acetate) are blue, and experiments containing both sodium acetate and an electron shuttle (AQDS) are in red.

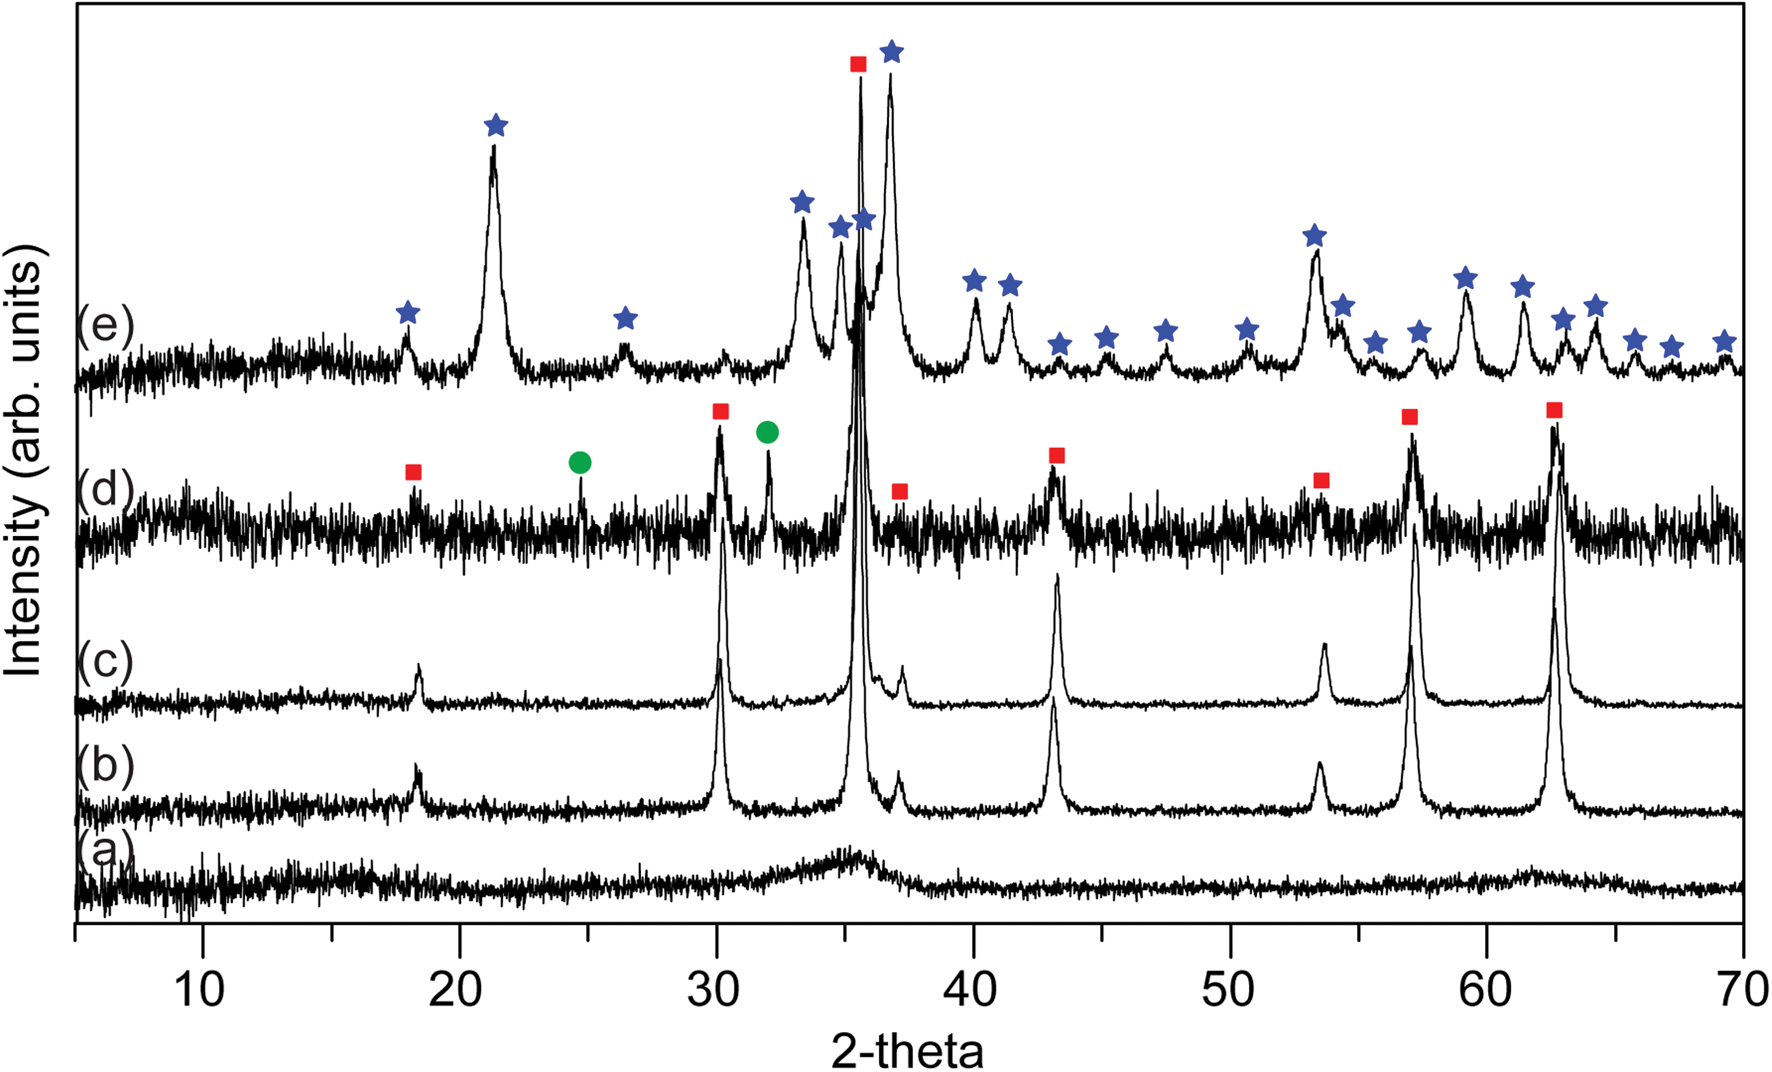
X-ray diffraction traces show the starting material has a low crystallinity, with the two characteristic diffraction intensities at 2.51 Å and 1.46 Å, consistent with the presence of 2-line ferrihydrite (Cornell and Schwertmann, Reference Cornell and Schwertmann2003) (Fig. 2a). After exposure to G. sulfurreducens for 65 h, each sample was found to contain magnetite Fig. 2b-e, formed due to the biogenic production of Fe(II) that reacted with the Fe(III)-bearing ferrihydrite (Coker et al., Reference Coker, Pearce, Pattrick, van der Laan, Telling, Charnock, Arenholz and Lloyd2008a). The sample produced from 4.2 wt.% vanadium ferrihydrite displayed overall lower crystallinity but with magnetite present, and minor quantities of siderite (Fe(II)CO3); the non-crystalline component is likely to be Fe/V-hydroxyoxides (see Coker, Reference Coker, Pearce, Pattrick, van der Laan, Telling, Charnock, Arenholz and Lloyd2008a). Only minor amounts of magnetite were found in the 7.4 wt.% vanadium sample (Fig. 2), which comprised mainly crystalline goethite, (Fe(III)OOH).
X-ray diffraction traces of the solid product from the G. sulfurreducens with AQDS experiments for (a) control with no bacteria, (b) 0 wt.% V, (c) 0.8 wt.% V, (d) 4.2 wt.% V and (e) 7.4 wt.% V-doped ferrihydrite. Major peaks are labelled indicating magnetite (red squares), siderite (green circles) and goethite (blue stars).

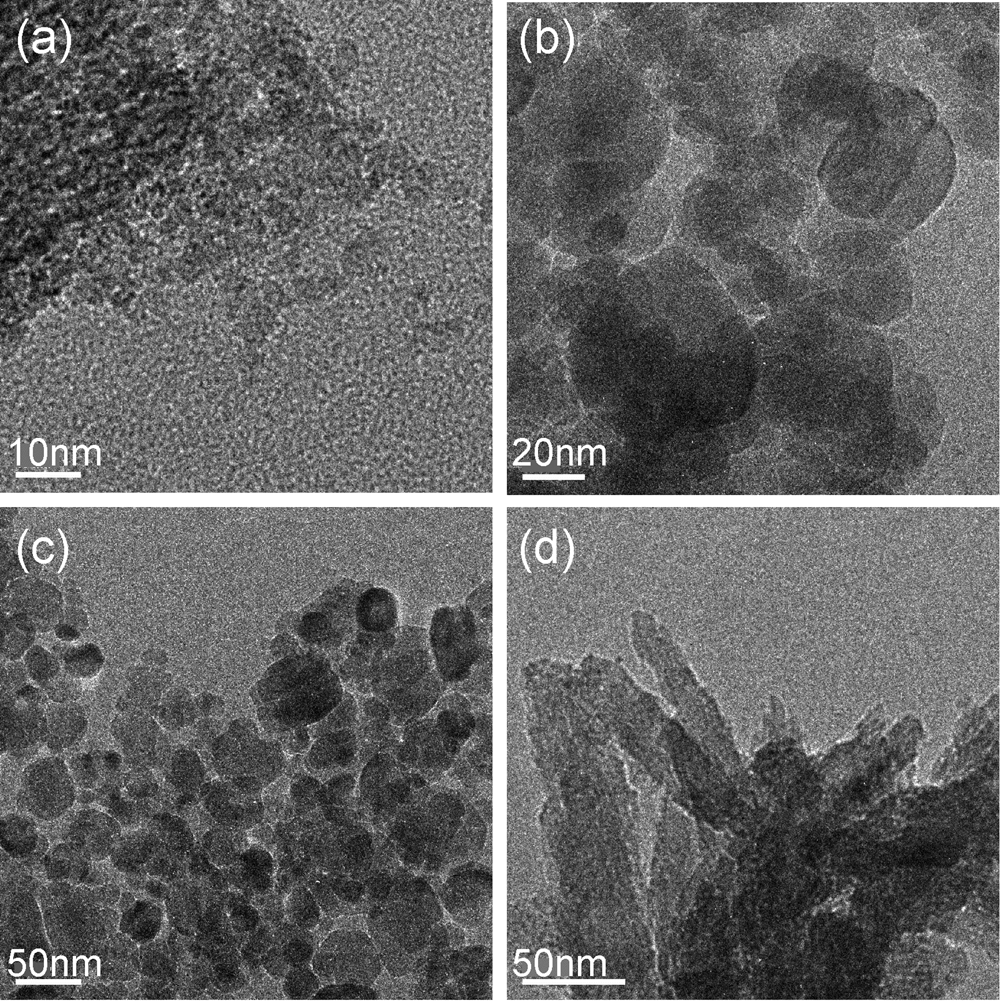
The TEM examination of the sample with the highest vanadium content (7.4 wt.%) (Fig. 3) showed that there are a variety of particles with a facetted, semi-spherical morphology between 5–50 nm (Fig. 3a–c) consistent with nanomagnetite (see Coker et al., Reference Coker, Telling, van der Laan, Pattrick, Pearce, Arenholz, Tuna, Winpenny and Lloyd2009 and Byrne et al., Reference Byrne, Telling, Coker, Pattrick, van der Laan, Arenholz, Tuna and Lloyd2011 for details), with needle-like particles greater than 100 nm long (Fig. 3d) which have the morphology of goethite (Cornell and Schwertmann, Reference Cornell and Schwertmann2003).
Transmission electron microscopy (TEM) images of magnetite in the 7.4 wt.% V sample, showing equant V-magnetite nanoparticles (a–c) and acicular goethite (d).

The particle size of the magnetite was determined by applying the Scherrer equation (Scherrer, Reference Scherrer1918) to the (311), (511) and (440) reflections of magnetite in the XRD patterns (Fig. 2) for the three samples where there was sufficient peak definition to allow this. For the control without vanadium the particle size was 23.7±1.9 nm, in the magnetite derived from ferrihydrite containing 0.8 wt.% V the particle size was 28.4±2.3 nm and for that derived from the 4.2 wt.% V experiment, the magnetite particle size was 18.1±2.3 nm. Qualitatively, the increase in broadening of the magnetite peak in the sample with 7.4 wt.% V is suggestive of a further decrease in average particle size. This trend is analogous to that found when cobalt is incorporated into biogenic magnetite using a similar methodology where, for instance, the highest doping of 23 wt.% Co incorporation into the spinel structure resulted in 8 nm nanoparticles (Coker et al., Reference Coker, Telling, van der Laan, Pattrick, Pearce, Arenholz, Tuna, Winpenny and Lloyd2009).
The Fe L 2,3 XAS of Fe(III) and Fe(II)-bearing compounds are displayed in Fig. 4a, including a natural end-member (Fe3O4) magnetite (from Kiruna, Sweden) and synthetic Fe(III)-oxyhydroxides. When comparing the standard materials to the data in Fig. 4b, the biogenic magnetite produced in this study shows a similar spectral shape and L 3 peak energy position (709 eV) to the natural magnetite (see also Coker et al., Reference Coker, Pearce, Lang, van der Laan, Pattrick, Telling, Schüler, Arenholz and Lloyd2007). Fe L 3 XAS of the 0.8 and 4.2 wt.% V samples in Fig. 4b are also remarkably similar in spectral shape and energy position to the magnetites with the small amount of siderite revealed by XRD in the 4.2 wt.% V sample contributing little to the spectrum. The 7.4 wt.% V sample in Fig. 4b(iv) has a doublet feature in the L 3 spectrum with peaks at 707.4 and 709 eV. The lower energy peak of the doublet is consistent with the presence of a significantly increased Fe(III) component associated with goethite (see Fig. 4a), in agreement with the XRD (Fig. 2).
Fe L 2,3 spectra. (a) XAS for standard Fe compounds [troilite – meteoritic, Fe(II)S; magnetite – Kiruna Sweden, Fe(II) Fe(III)2O4; akaganeite – synthetic, β-Fe(III)O.OH; lepidocrocite – synthetic, γ-Fe(III)O.OH; hematite – Cumbria, England, Fe(III)2O3; goethite – synthetic, α-Fe(III)O.OH; ferrihydrite – synthetic, Fe(III)10O14(OH)2. (see also Michelin et al. (Reference Michelin, Drouet, Foy, Dynes, Neff and Dillmann2013) for XAS of reduced species siderite, FeCO3, and mackinawite, FeS) (b) XAS and (c) XMCD experimental spectra (black dashed lines) with calculated XMCD fits (red solid lines) of (i) biogenic magnetite, (ii) 0.8 wt.% V ferrihydrite derived magnetite, (iii) 4.2 wt.% V ferrihydrite derived magnetite, (iv) 7.4 wt.% V ferrihydrite derived magnetite; and (v) Natural magnetite (Kiruna) (Note: The XMCD spectra is derived only from the ferrimagnetic material present – magnetite).

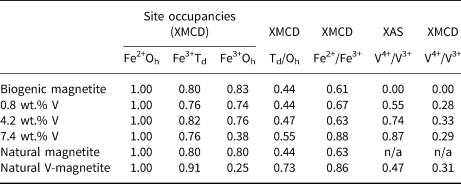
The Fe L 2,3 XMCD data in Fig. 4c show the calculated best fits to the spectral data which are displayed numerically in Table 1. These data show that all samples contain strongly ferrimagnetic biogenic magnetite (the XMCD spectra do not contain a contribution from either siderite or goethite impurities as these are paramagnetic and antiferromagnetic, respectively). In the biomagnetite without V, there is a deficiency in both the Fe(III) sites compared to the Fe(II) octahedral site, consistent with previous observations from extracellular biogenic magnetite (Coker et al., Reference Coker, Pearce, Lang, van der Laan, Pattrick, Telling, Schüler, Arenholz and Lloyd2007). With the addition of V to the starting ferrihydrite, the Fe occupancy of the Fe3+Oh site decreases; this reduction is similar for the 0.8 and 4.2 wt.% V samples, equivalent to ~8 at.% of the Fe site, but in the 7.4 wt.% V sample the displacement of Fe3+Oh by V is much more significant with Fe3+Oh = 0.38 (Table 1), equivalent to a reduction of 45 at.% of that Fe site compared to the standard biogenic magnetite. As a result there is also a relative increase in FeTd occupation compared to FeOh and in Fe2+ compared to Fe3+. These are consistent with observations from V-bearing, abiogenic chemical precipitates and natural magnetite (Liang et al., Reference Liang, Zhu, Zhong, Zhu, Yuan, He and Zhang2010; Nohair et al., Reference Nohair, Aymes, Perriat and Gillot1995; Kim et al., Reference Kim, Choi, Lee, Lee and Park2007a).
Site occupancies from fitting the Fe L 3 XMCD spectra. The occupancy of Fe2+ Oh is set at 1 and changes relative to this; previous work suggests this site is least involved in V substitution (see above).

n/a = not applicable
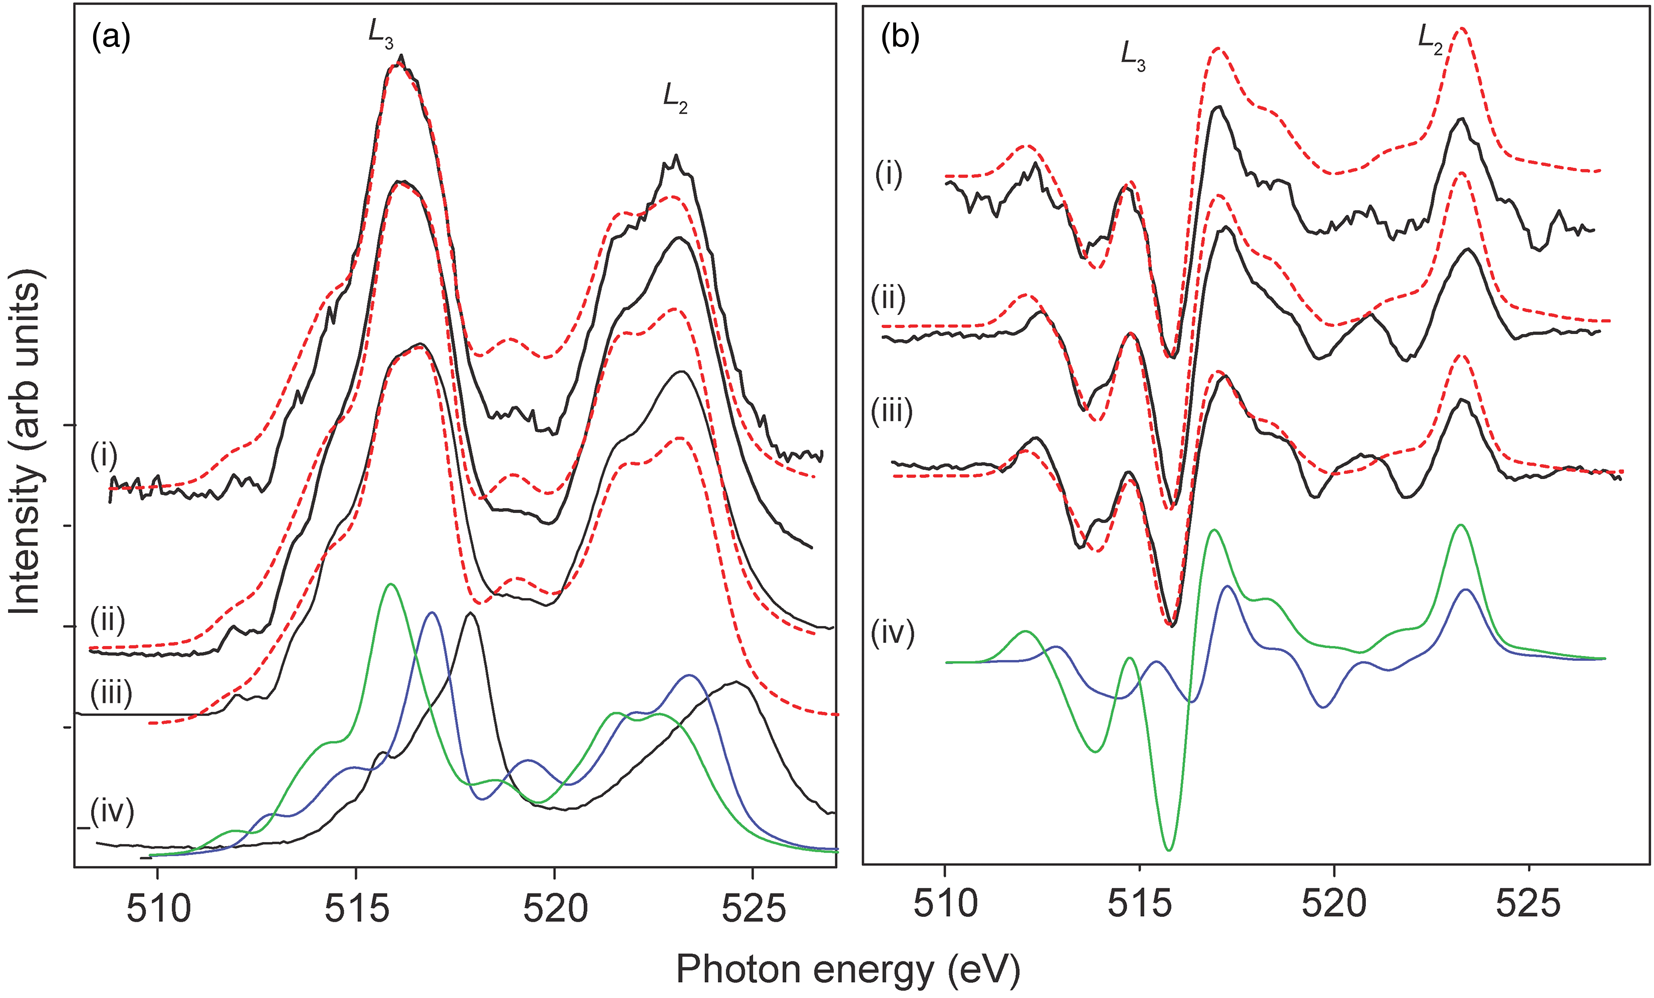
Confirmation that the vanadium in the V-Fe-ferrihydrite starting material is V(V) comes from comparison of the V L 2,3 XAS in this study (Fig. 5a iv) with the V(V) calculation for V2O5 in Brik et al. (Reference Brik, Ogasawara, Ikeno and Tanaka2006), and also the experimental spectra in Maganas et al. (Reference Maganas, Roemelt, Weyhermuller, Blume, Havecker, Knop-Gericke, DeBeer, Schlogl and Neese2014), Larsson et al. (Reference Larsson, Hadialhejazi and Gustafsson2017) and Duffy et al. (Reference Duffy, Figueroa, van der Laan and Hesjedal2017). From the spectral shapes in Fig. 5a of the V L 2,3 XAS for the three V-bearing bioreduced samples, none correspond to V(V). Using an energy difference of 1.0 eV (Kang et al., Reference Kang, Hwang, Kim, Lee, Kim, Kim, Kwon, Lee, Kim, Ueno, Sawada, Kim, Kim and Min2012) between the calculated spectra for V(III) (green) and V(IV) (blue) (Fig. 5a iv), the best fit for the experimental V L 2,3-edge XAS spectra was found to be a mixture of V(III) and V(IV) (Fig. 5a i–iii) (Table 1) with no evidence of V(V). There is a shift in the V L 3 XAS shape to slightly higher energy with increased V content, which represents an increased presence of V(IV) in the 7.4 wt.% V bioreduced sample compared to the 0.8 wt.% V bioreduced sample, and the V4+/V3+ ratio from fitting the calculated spectra is found to be 0.55 for the 0.8 wt.% V sample, 0.74 for 4.2 wt.% V and 0.88 for 7.4 wt.% V (see Table 1). It should be noted that these V L 2,3-edge XAS spectra contain contributions from V in all phases present.
(a) V L 2,3 XAS and (b) V L 2,3 XMCD for (i) 0.8 wt.% V, (ii) 4.2 wt.% V and (iii) 7.4 wt.% V samples. The XAS spectrum for un-bioreduced V(V)-doped ferrihydrite (7.4 wt.% V) is also shown in (a) as (iv) – black (Brik et al., Reference Brik, Ogasawara, Ikeno and Tanaka2006), along with calculated XAS spectra for V(III) (green) and V(IV) (blue) (Kang et al., Reference Kang, Hwang, Kim, Lee, Kim, Kim, Kwon, Lee, Kim, Ueno, Sawada, Kim, Kim and Min2012); combinations of the V(III)+V(IV) calculated data best fits for the XAS data are shown (red dashes) in (a). Calculated XMCD spectra are shown in (b iv) as V(III) (green) and V(IV) (blue), V(V) d 0 (not shown) has zero XMCD; combinations of the V(III)+V(IV) calculated data best fits for the XMCD data are shown (red dashes). This best-fit takes into account only the V L 3-edge while the L 2 is a qualitative fit only; in addition, each calculated fit was normalised to the main negative peak at 515.8 eV.

The V L 2,3 XMCD spectra show that the vanadium has a ferrimagnetic component, and the spectra are similar for each of the three biogenic samples (Fig. 5b i-iii) and are also similar to the V L 2,3 XMCD spectrum derived from MnV2O4 and FeV2O4 spinels (Kang et al., Reference Kang, Hwang, Kim, Lee, Kim, Kim, Kwon, Lee, Kim, Ueno, Sawada, Kim, Kim and Min2012; Matsuura et al., Reference Matsuura, Sagayama, Nii, Khanh, Abe and Arima2015; Okabayashi et al., Reference Okabayashi, Miyasaka, Hemni, Tanaka, Tajima, Wadati, Tanaka, Takagi and Yokoyama2015); this confirms V-doped biomagnetite has formed. Comparison with calculated octahedral-coordinated V(III) and V(IV) L 2,3 XMCD spectra reveals that the best fit for the samples has a small range of V4+/V3+ ratios of 0.28–0.33 (i.e. 22–25% V(IV)) (Fig. 5b i–iii; Table 1). Thus, the XMCD reveals that the ferrimagnetic V is predominantly V(III) in octahedral sites (Fig. 5b iv), which agrees well with the Fe L 2,3 XMCD data that show a reduction in the Fe3+Oh with increasing V (Table 1).
The presence of V(IV) and V(III) in the biomagnetite samples (and other phases) can be explained by the electrode potentials of the redox couples of the cations involved in the experiments. The standard redox potential at pH 6–12 for V(V) → V(IV) is 0.991 eV and for V(IV) → V(III) is 0.542 eV (Israel and Meites, Reference Israel, Meites, Bard, Parsons and Jordan1985) compared to the redox potential for Fe(III) → Fe(II) (in the form Fe(OH)3 at pH 7) of 0.2 eV (Ehrenreich and Widdel, Reference Ehrenreich and Widdel1994). Thus, in terms of energy gain for the bacteria, the V(V) → V(IV) → V(III) should outcompete Fe(III) → Fe(II) as an electron acceptor, resulting in the complete reduction of the available V(V) and, initially, slowing the rate of bioreduction of the Fe(III). However, no overall effect in Fe(III)-reduction is revealed in Fig. 1 and, indeed, the small magnetite particle size and the presence of the Fe(II) phase siderite in the 3.4 wt.% V and 7.4 wt.% V is indicative of an increase in Fe(III) reduction rate (Byrne et al., Reference Byrne, Telling, Coker, Pattrick, van der Laan, Arenholz, Tuna and Lloyd2011). Thus it would seem the V is reduced from V(V) before the first measurement point of 20 hours (Fig. 1) and therefore an overall effect on Fe(III) reduction is not seen. Little magnetite was formed in the 7.4 wt.% V and it would appear that the higher V content inhibits the recrystallisation pathway between ferrihydrite and magnetite, leaving the majority of the mineral product of the reaction as the intermediate phase, goethite (Coker et al., Reference Coker, Bell, Pearce, Pattrick, van der Laan and Lloyd2008b, Hansel et al., Reference Hansel, Benner, Neiss, Dohnalkova, Kukkadapu and Fendorf2003; Reference Hansel, Benner and Fendorf2005).
The V L 2,3 XAS data reveal a much higher proportion of V(IV) overall than shown by the XMCD spectra, revealing a significant ‘non-magnetic’ V component in the ‘non-magnetite’ solid phases present. In the 4.2 wt.% V sample, the XRD contains minor paramagnetic siderite but vanadium has little affinity for carbonate phases, and the non-magnetic V component may reside in the extensive non-crystalline Fe/V-hydroxyoxide component present, implied by XRD. Furthermore, the 7.4 wt.% V sample, contains abundant crystalline goethite which can incorporate significant V, although normally as V(III) (Kaur et al., Reference Kaur, Singh, Kennedy and Gräfe2009). The data presented here reveal that bioreduction, in the high V experiments, has ‘stalled’ at V(IV). The presence of higher vanadium in the experiments will have inhibited the activity of the bacteria (Kamika and Momba, Reference Kamika and Momba2012), slowing the reduction process and the production of V(III) and magnetite. As a consequence the resulting V(IV) would be sorbed by the defect-rich, high surface-area metal hydroxides present, coordinating with oxygen donors in hydrous oxide particulates to form inner sphere complexes (see Peacock and Sherman, Reference Peacock and Sherman2004; White and Petersen, Reference White and Peterson1996). Once included in the crystalline goethite, further bioreduction by Geobacter sulfurreducens would be greatly inhibited (Cutting et al., Reference Cutting, Coker, Fellowes, Lloyd and Vaughan2009).
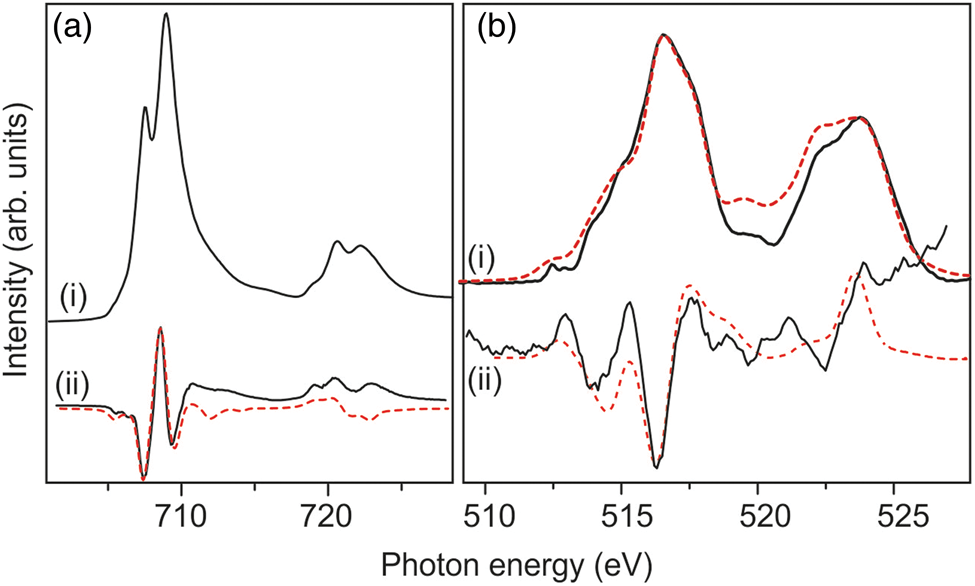
For comparison with the biogenic V-magnetite, a natural sample of V-bearing titanomagnetite from the world's most important source of vanadium, the V-bearing magnetite layers in the lower part of the Upper Zone of the Bushveld Complex, RSA, containing ~1.0 wt.% V, was analysed. Electron probe microanalysis defined the magnetite composition as (Fe2.11Ti0.42Al0.07V0.08Mn0.01)O4. From Fig. 6a i, it can be seen that the Fe L 2,3 XAS spectrum has a main peak at 709 eV and a shoulder peak at 707.5 eV, typical of Fe(III) and Fe(II), respectively, in magnetite. The Fe L 2,3 XMCD spectrum (Fig. 6a ii) indicates a larger reduction in the quantity of Fe(III) in octahedral coordination (see Table 1) than observed in the biogenic samples reflecting the additional incorporation of Ti in the Fe(III) Oh site (Pearce et al., Reference Pearce, Henderson, Telling, Pattrick, Charnock, Coker, Arenholz, Tuna and van der Laan2010) in addition to the V. The V L 2,3 XAS and XMCD both have similar characteristics to the biogenic samples. The XAS indicates that there is both V(III) and V(IV) present in the sample, and a best fit gives a V4+/V3+ of 0.47 (Fig. 6b i; Table 1). Fitting the XMCD reveals that the majority of the vanadium is V(III)Oh with a smaller V(IV) component (V4+/V3+ of 0.31; Fig. 6b ii; Table 1) in the magnetite compared to that derived from the XAS. This discrepancy reveals that a component of V(IV) in the sample is non-magnetic and can be explained by V(IV) substitution of Ti(IV) in ilmenite (FeTiO3) inclusions observed in microscopic optical examination of the magnetite. Compared to the XAS data of Bordage et al. (Reference Bordage, Balan, Villiers, Cromarty, Juhin, Carvallo, Calas, Sunder Raju and Glatzel2011) derived from vandiferous Ti-magnetites from the Bushveld, the data presented here indicate a higher V(IV) content. Changes in  $f_{{\rm O}_ 2}$ in the Bushveld magma provide an explanation for variable V(IV) contents (9.5 to 16.3% V(VI)) in the Ti-magnetite (Bordage et al., Reference Bordage, Balan, Villiers, Cromarty, Juhin, Carvallo, Calas, Sunder Raju and Glatzel2011) but their V(VI) contents are significantly below the 25% V recorded by the XMCD data in the current study.
 $f_{{\rm O}_ 2}$ variations are cited as a main cause of magnetite/chromite layering in the Bushveld intrusion (see Klemm et al., Reference Klemm, Henckel, Dehm and Von Gruenewald1985) and the sample analysed in this study comes from Main Zone magnetite layers which were formed in a relatively high
 $f_{{\rm O}_ 2}$ regime (Klemm et al., Reference Klemm, Henckel, Dehm and Von Gruenewald1985) that would have favoured increased V(VI). However this discrepancy requires a detailed XMCD study.
(a) Natural V-magnetite Fe L 2,3 (i) XAS and (ii) XMCD (x5) (b) V L 2,3 (i) XAS and (ii) XMCD (×20). Using combinations of V(III) and V(IV) calculated data (see Fig. 5) a best fit for the Fe L 2,3 XMCD and V L 2,3 XAS and XMCD data is shown (red).

Summary
By combining both the XAS and the XMCD results from the Fe and V L 2,3-edges, the majority of V in the structure of the biogenic magnetite is V(III) and it is substituting for Fe(III) in octahedral (Oh) sites. Therefore, not only has the commonly reported bacterial reduction of V(V) to V(IV) (Ortiz-Bernad et al., Reference Ortiz-Bernad, Anderson, Vrionis and Lovley2004, Carpentier et al., Reference Carpentier, Sandra, De Smet, Brige, De Smet and Van Beeumen2003, French et al., Reference French, Fakra, Trevors and Glasauer2012) taken place in these experiments but G. sulfurreducens has further enzymatically reduced the V(IV) to V(III). A small component of V(IV) also appears to be a necessary component of the vanadium in all vanadiferous magnetites. Whereas in low  $f_{{\rm O}_ 2}$ environments of ultramafic magmas this may be below 10% of the V(IV), in the relatively oxygenated subsurface 22–25% of the V is incorporated as V(VI). The incorporation of the V(IV) (Table 1) is also in the Fe(III) Oh site, favoured by a smaller ionic radius than the Fe(II) Oh site.
In this current study, the complementary information of the Fe and V L-edge data along with the XMCD analysis provides comprehensive information on all the ferrimagnetic components of the magnetite. This work has shown that Fe(III)-reducing bacteria can be harnessed to produce V-doped magnetites though the toxicity effects of V will hinder scale-up, but V-magnetites could be produced using waste materials from mine effluents containing Fe and low concentrations (> 2 wt.%) of V, utilising a green chemistry approach to the formation of these nanomaterials. In terms of environmental consequences, in oxidised environments the vanadium may remain as V(V) but in the sub-surface below the Fe(II)/Fe(III) redox boundary, Fe reducing bacterial will immobilise the vanadium as V(III) in magnetite, or even as V(IV) in goethite, and these phases will be resistant to bio-remobilisation if oxidative conditions return.
Acknowledgements
Access to beamtime at the Advanced Light Source is gratefully acknowledged. The ALS is supported by the Director, Office of Science, Office of Basic Energy Sciences, of the U.S. Department of Energy under Contract No. DE-AC02-05CH11231. Diamond Light Source Ltd are also thanked for beamtime allocated on beamline I06 proposal SI838. This work was supported by the Natural Environment Research Council (CoG3 NE/M011518/1).