Implications
This study indicated that soluble fibre has positive dietetic properties in terms of providing a stable and constant energy supply to horses. It is convincingly shown that soluble fibre has potential to be included in all horse feed rations and compound feeds for horses being exercised as a replacement for cereal starch.
Introduction
Horses are hindgut fermenting herbivores, where microbes of the hindgut produce forage-fermenting enzymes, which are needed to degrade fibrous materials to monosaccharides. The anaerobic environment of the hindgut prevents complete oxidation of the monosaccharides and instead short-chain fatty acids (SCFA) are produced, that is mainly acetic acid, propionic acid and butyric acid. The SCFAs are important contributors to the energy status of the horse through gluconeogenic properties (Hallebeek and Beynen, Reference Hallebeek and Beynen2003) and acetyl-CoA precursors, in fat synthesis and ATP production in the Krebs cycle. A continuous supply of SCFA derived from fibres therefore has the potential to make up a substantial proportion of the daily energy requirements and thereby maintaining a stable and constant supply of metabolites and concentration of regulatory hormones. Horses have been shown to suffer some of the same health issues associated with high and fluctuating insulin concentrations as humans, that is type 2 diabetes (Brøkner et al., Reference Borgia, Valberg, McCue, Watts and Pagan2012b) and therefore the effect of different fibre types on regulatory hormones becomes relevant.
Results of previous studies indicated that switching the energy supply from feed ingredients rich in starch to ingredients rich in fibre can be applied to horses in training (Lindberg and Palmgren Karlsson, Reference Lindberg and Palmgren Karlsson2001) and shifts the muscle energy supply from glucose to acetic acid due to increased hindgut fermentation of fibre. However, little information is available regarding the concomitant change in blood metabolites and hormone concentrations as a result of feeding different fibre types. This experiment aimed at studying the postprandial caecal and blood plasma SCFA concentration and metabolic traits in working horses fed diets with different content of fibre types and content of cereal starch.
It was hypothesised that a higher proportion of soluble dietary fibre (DF) would result in stable and constant postprandial plasma metabolite and regulatory hormone concentration.
The main objectives of the present study were as follows:
-
∙ to measure the effect of diet on SCFA concentration and proportion in liquid caecal content, faecal content and blood plasma;
-
∙ to measure the effect of diet on plasma glucose, urea, β-hydroxybutyrate (BHBA), lactate, non-esterified fatty acids (NEFA), insulin and leptin concentrations.
Material and methods
The horses were cared for according to laws and regulations controlling experimentation on live animals in Norway, that is the Animal Protection Act (20 December 1974) and the Animal Protection Ordinance Concerning Experiments on Animals (15 December 1996).
Experimental design
A 4×4 Latin Square design was used to quantify the diet effect on caecal SCFA concentration, blood plasma glucose, insulin, SCFA, BHBA, NEFA and lactate. Within each experimental period, a sequence of 17 days adaptation to the ration was followed by 8 sampling days. Liquid caecal content and faecal grab samples were harvested on days 3 and 4, whereas blood samples were collected on days 7 and 8 during the sampling days. The 2 days were duplicate sampling days. The horses were weighed every day in the morning before feeding the first meal.
Animals
Four geldings of Norwegian Coldblooded Trotter horse (age 5 to 16 years) with an average BW of 544 kg and a mean body condition score of 6 (1 to 9 scale) were used in the experiment. The horses were fitted with a permanent caecal cannula close to the ileo–caecal junction. An 80 cm long soft tube (13 mm outer diameter and 9 mm inner diameter) with 5 mm holes for every 1.5 cm (total 54 holes) was attached to the cannula and placed loose inside the caecum. The cannula was closed with a silicone rubber plug. The horses were housed under the same conditions in individual 3×3 m stalls on wood shavings during the whole experimental period. On all sampling days, the horses were exercised on a high-speed treadmill. The protocol consisted of three sessions: Session 1: 10 min warm-up at 1.5 to 3.4 m/s and 3% elevation followed by 8 min at 3.8 m/s; Session 2: 5 min at 4.2 m/s; Session 3: 3 min at 4.2 m/s. A 1.5 min fast walk (1.8 m/s) separated each session. The horses were cooled down by fast (1.8 m/s) and slow (1.5 m/s) walk for >5 min. The treadmill exercise was performed after end sampling in the afternoon in order not to cause any direct effect of exercise on the collected samples; as well as sampling equipment had to be removed from the horse before getting on to the treadmill. During feed adaptation periods, the horses were exercised daily in an outdoor rotary exerciser in walk and trot intervals of 10 min duration for about 60 min. Each horse was subjected to an exercise test at the end of each experimental period. The protocol consisted of a 2.5 min warm-up at 1.5 m/s and 3% elevation followed by 2.5 min at 1.8 m/s, then 5 min at 3.4 m/s, then 5 min at 3.8 m/s followed by 5 min at 3.8 m/s including additional physical work load, followed by 5 min at 1.8 m/s without additional physical work load. The additional physical work load involved pulling a resistor at the force of 1 bar. The horse was walked until the pulse had reached 110 beats/min and then the speed was increased again to 3.4 m/s with additional physical work load for 1 min then increased to 3.8 m/s for 1 min and then increased to 4.2 m/s for 4 min. The treadmill was stopped and whole blood was drawn via jugular vein puncture into heparinised vacutainer tubes for immediate lactate analysis. Thereafter, the horse was walked at 1.5 m/s without additional physical work load or elevation of the treadmill. For safety of the horse, a combination of elevating the treadmill and pulling a resistor while trotting was used to increase the heart rate instead of sprinting on the treadmill. Horses at work were used to mimic modern leisure horses. During adaptation periods, the horses were let out daily for about 3 h on a dirt paddock in groups of four, in order to satisfy their need for social interaction.
Diets
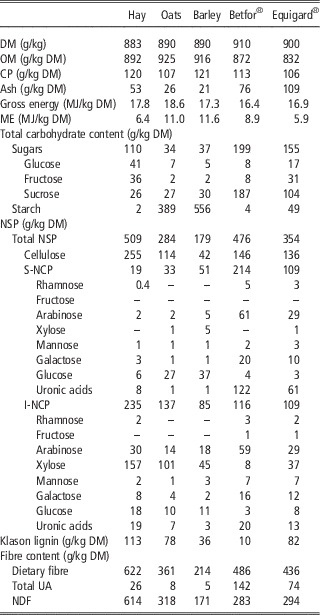
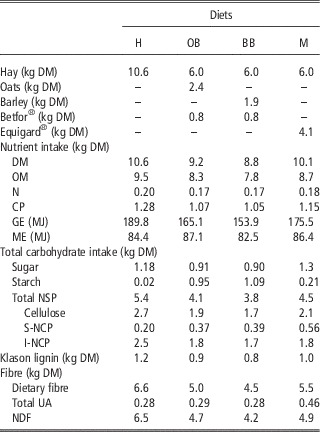
The chemical composition of the dietary ingredients is presented in Table 1. The composition of each experimental diet and the intake of nutrients are shown in Table 2. The daily rations were divided into three meals: morning at 0600 h, afternoon at 1530 h after end of sampling and night at 2200 h. The morning meal of the respective dietary treatments consisted of (kg dry matter (DM)) 3.8 kg timothy hay (Phleum L.) (H), 1.6 kg timothy hay and 2.4 kg whole oats (Avena sativa L.), and 280 g molassed sugar beet pulp (Beta vulgaris) (Betfor®, 1.5 cm long pulps; Nordic Sugar A/S, Copenhagen, Denmark) soaked in 1 l water (OB), 1.6 kg timothy hay and 1.9 kg whole barley (Hordeum vulgare L.) and 280 g Betfor® soaked in 1 l water (BB), and 1.6 kg timothy hay and 1.4 kg commercial muesli feed (Equigard®, a loose chaff-based concentrate composed of 24% meadow hay, 22% apple pulp (Malus Mill.), 22% sugar beet pulp (B. vulgaris), linseeds, apple syrup, maize germs, oil mixture, minerals and vitamins (Mühle Ebert Dielheim GmbH, Dielheim, Germany) (M)). The cereal grain meals were fed in one meal as the intension was to affect the hindgut environment. The remaining feed was divided into two meals and fed in the afternoon and evening. Timothy hay was sun dried and baled in round bales. It was first cut, pre-bloom and grown in south-eastern Norway (59.67°N:10.79°E). Whole oats and barley were obtained from a local feedstuff supplier (Borgen Aktiemølle, Ås, Norway). The daily feed ration fulfilled Danish feeding standards of net energy for horses at medium (1.5×maintenance) work level, taking into account that the intention was that all diets should provide the same amount of net energy and DM. Concentrate was fed at time 0 h and timothy hay 2.5 h later. Only the OB and BB diets reached the maximum recommended level of 2 g starch/kg BW in the morning meal.
Dry matter (DM), chemical composition and energy of individual feedstuffs fed in the present experiment

OM=organic matter; ME=metabolisable energy; NSP=non-starch polysaccharides; S-NCP=soluble non-cellulosic polysaccharides; I-NCP=insoluble non-cellulosic polysaccharides; total UA=total uronic acids.
Dietary composition and daily intake when hay only (H), oats and Betfor® (OB), barley and Betfor® (BB), and Equigard® (M) was fed to horses

DM=dry matter; OM=organic matter; N=nitrogen; GE=gross energy (MJ); ME=metabolisable energy; NSP=non-starch polysaccharides; S-NCP=soluble non-cellulosic polysaccharides; I-NCP=insoluble non-cellulosic polysaccharides; total UA=total uronic acids.
Sampling of blood, faecal and liquid gut content
Blood was drawn via jugular vein puncture into heparinised vacutainer tubes at time 0 h before the morning meal and again 3 and 9 h post-feeding. Immediately after sampling, the tubes were centrifuged at 2016×g at 4°C for 10 min. Plasma was harvested and stored in polypropylene micro tubes at −20°C. Liquid caecal content was sucked up manually by use of a 400 ml syringe attached to a 150 cm long, 9 mm inside diameter soft tube and transferred unfiltered to a 50 ml polypropylene centrifuge tube, three drops of sodium azide was added to avoid further metabolisation of nutrients. The tubes were then mixed thoroughly and frozen immediately at −20°C. Faecal grab samples were harvested at time 3 and 9 h post-feeding and frozen immediately in 50 ml polypropylene centrifuge tubes at −20°C.
Chemical analyses of feedstuffs
All samples were analysed in duplicate and the obtained mean values are reported. A thorough description of the analysis is found in Brøkner et al. (Reference Borgia, Valberg, McCue, Watts and Pagan2012b). DM was determined on original unprocessed feed samples, collected daily in the stall, by drying at 105°C for 24 h. Ash was determined by combustion at 525°C for 6 h. Gross energy was analysed by use of an oxygen bomb calorimeter (Parr Instrument Company, Moline, IL, USA). Nitrogen was measured according to the Kjeldahl method (Tecator-Kjeltec system 1030; Tecator AB, Höganäs, Sweden) and CP was calculated as N×6.25. NDF content with amylase pre-treatment and corrected for ash was analysed by the use of the Fibertec system (Fibertec™ 2010; Auto Fibre Analysis System, Hillerød, Denmark). Starch was analysed by an enzymatic colorimetric method. Low molecular weight sugars (glucose, fructose and sucrose) and fructans were determined by use of two connected enzymatic reactions using hexokinase and glucose-6-phosphate dehydrogenase. In brief, the samples were extracted by an acetate buffer (0.1 M, pH=5.0) in a 65°C water bath for 60 min. The contents of glucose and fructose were determined by measuring the content of NADPH at 340 nm. The extract was subsequently hydrolysed with 0.037 M H2SO4 in a 80°C water bath for 70 min and the contents of sucrose and fructans were calculated based on the increased amount of glucose and fructose, respectively. Total non-starch polysaccharides (NSP), divided into cellulose and insoluble non-cellulosic polysaccharides and soluble non-cellulosic polysaccharides (S-NCP), were determined by GLC for neutral sugars and by a colorimetric method for uronic acids in three parallel runs. Klason lignin was measured gravimetrically. DF was calculated as DF=NSP+Klason lignin. Digestible energy (DE) and metabolisable energy (ME) in individual feeds were predicted based on equations given by Kienzle and Zeyner (Reference Kienzle and Zeyner2010). The contents of ME in individual diets were calculated from DE according to the equations and values given by Martin-Rosset et al. (Reference Martin-Rosset, Vermorel, Doreau, Tisserand and Andrieu1994).
Analytical procedures for metabolites
Blood plasma glucose, urea nitrogen and lactate were determined according to standard procedures (Siemens Diagnostics® Clinical Methods for ADVIA 1650). NEFA were determined using the Wako, NEFA C ACS-ACOD assay method. BHBA was determined as an increase in absorbance at 340 nm due to the production of NADH, at slightly alkaline pH in the presence of β-OH-butyrate dehydrogenase. Sample blank was included. The method involved oxamic acid in the media to inhibit lactate dehydrogenase as proposed by Harano et al. (Reference Harano, Ohtsuki, Ida, Kojima, Harada, Okanishi, Kashiwagi, Ochi, Uno and Shigeta1985). All analyses were performed using an autoanalyser, ADVIA 1650® Chemistry System (Siemens Medical Solutions, Tarrytown, NY, USA). Intra- and inter-assay precision were in all instances below 3% (CV) and 5%, respectively. The accuracy was within 4%.
Regulatory hormone assays
Plasma insulin and leptin were assayed in duplicate by a double-antibody radioimmunoassay (RIA) at the University of Western Australia, Perth, Australia. Plasma leptin was measured according to the method by Blache et al. (Reference Blache, Tellam, Chagas, Blackberry, Vercoe and Martin2000). The measurements were made using bovine leptin, the first antibody being raised in an emu and the second in a sheep. All samples were processed in a single assay and the detection limit was 0.05 ng/ml. The assay included six replicates of three control samples containing 0.45, 0.96 and 2.08 ng/ml, which were used to estimate the intra-assay CV of 4.5%, 4.4% and 4.8%, respectively. Plasma insulin was assayed by an RIA method (Tindal et al., Reference Tindal, Knaggs, Hart and Blake1978). The measurements were made using bovine insulin, the first antibody being raised in guinea pigs and the second in goats. All samples were processed in a single assay and the detection limit was 0.4 µU/ml. Six replicates of three control samples containing 2.19, 4.48 and 11.35 µU/ml were included in the assay and were used to estimate the intra-assay CV of 5.5%, 5.1% and 6.9%, respectively. The assays were validated for horse: serial dilutions of horse plasma containing high concentrations of leptin or insulin produced curves parallel to the standard curve for the actual hormone.
SCFA analyses
Blood plasma was analysed for total SCFA, acetic acid, propionic acid and butyric acid according to the method of Brighenti (Reference Brøkner, Austbø, Næsset, Blache, Bach Knudsen, Hansen and Tauson1998). Briefly, plasma was deproteinised by use of meta-phosphoric acid and centrifuged. The supernatant was analysed for individual acids by use of gas chromatography. Total SCFA, acetic acid, propionic acid and butyric acid were determined on wet caecal and faeces materials as described in details by Jensen et al. (Reference Jensen, Cox and Jensen1995). Briefly, 2 to 5 g samples were weighed into 5 to 80 ml Stomacher bags (Seward, England) and the dilution was standardised by use of Dilumat 3 (AES Laboratoire, Combourge, France). Separation of the individual SCFA was performed by use of Hewlett Packard gas chromatograph (Model 6890; Wilmington, DE, USA).
A ratio of acetic acid plus butyric acid to propionic acid was calculated according to the following equation: C2+C4/C3.
Statistical analyses
Results were analysed statistically and results were considered significantly different when P<0.05 and a tendency when P<0.10. The SAS version 9.2 (SAS Institute Inc., 2008) was used for all analyses.
The effect on postprandial blood metabolites, caecal and faecal SCFA concentrations were statistically evaluated as repeated measurements by use of the MIXED procedure in SAS. Blood variables and SCFA concentrations were the within-subject factors and the between-subjects’ factors were diet, time, period and day and the interaction diet×time. Horse was included as random effect. Period and Day were not significant and the final model used was
 $$\eqalignno{Y_{{ijkl}} {\,=\,}\mu {\plus}\alpha \left( {diet_{i} } \right){\plus}\beta \left( {time_{j} } \right){\plus}\alpha \beta \left( {diet_{i} {\times}time_{j} } \right) \cr {\plus}\delta \left( {horse_{k} } \right){\plus}{\epsilon}\left( {error_{{ijkl}} } \right)$$
where i=H, OB, BB, M; j=0, 3, 9; k=1 to 4.
Pearson correlation coefficients were calculated for selected traits by use of the CORR procedure in SAS.
Results
General health
All horses remained healthy throughout the experiment and showed no signs of discomfort due to repeated blood and caecal sampling.
Dietary composition and nutrient intake
Chemical compositions of individual feedstuffs and diet composition and intake of feed and nutrients are seen in Tables 1 and 2. As expected the DF intake was highest for H; however the intake of S-NCP was highest on diet M followed by OB and BB. Diet OB and BB resulted in the highest intake of starch and the lowest intake was on diet M and H. Surprisingly, the H diet resulted in the second highest intake of sugar followed by OB and BB. Fructans were analysed in all feeds and found to be <0.01 g/kg DM in Betfor®, Equigard® and hay and not detectable in oats and barley.
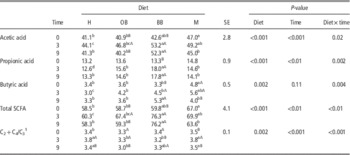
Diet effect on caecal SCFA concentration
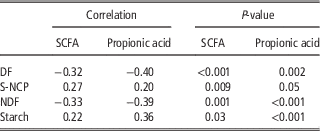
Diet affected (P<0.01) caecal SCFA concentration (Table 3), where total SCFA concentration was significantly highest on the BB diet followed by the M diet. The production of SCFA followed this order: acetic acid>propionic acid>butyric acid. Diet affected the relative concentrations of acetic and butyric acids, which were significantly highest on the BB and M diets. The propionic acid concentration was highest on the BB diet followed by the OB and M diets, which was reflected in the lowest acetic acid+butyric acid/propionic acid (C2+C4/C3) ratio on the OB and BB diets. Time significantly affected the SCFA concentration, where acetic acid, butyric acid and total SCFA increased 3 h postprandially and decreased 9 h postprandially. The interaction between diet and time (Table 3) indicated that diets affected caecal SCFA concentration throughout the day. The concentration of propionic acid at time 0 was numerically highest on the M diet, which then did not change significantly throughout the day. The H diet resulted in the numerically lowest concentration, which remained stable throughout the day. The OB and BB diets resulted in the most pronounced fluctuations as they had equally low propionic acid concentration at time 0, which then increased after 3 h and was significantly highest on the BB diet and remained high until 9 h postprandial. A correlation (P⩽0.05) was found between individual carbohydrate fractions and total SCFA and propionic acid in caecum (Table 4). More dietary S-NCP and starch increased total SCFA and propionic acid concentration, whereas higher content of DF and NDF decreased the concentration of total SCFA and propionic acid.
Effect of diet and time on caecal content of total short-chain fatty acids (SCFA), acetic acid, propionic acid and butyric acid (mmol/l) when hay only (H), oats and Betfor® (OB), barley and Betfor® (BB) and Equigard® (M) was fed to horses

a,b,c,dWithin a row, means without a common superscript letter differ (P<0.05).
A,BWithin a column, means without a common superscript letter differ (P<0.05).
1 Acetic acid+butyric acid/propionic acid.
Correlation coefficients between caecal total short-chain fatty acids (SCFA) and propionic acid concentration and individual carbohydrate fractions when hay only (H), oats and Betfor® (OB), barley and Betfor® (BB) and Equigard® (M) was fed to horses

DF=dietary fibre; S-NCP=soluble non-cellulosic polysaccharides.
Faecal SCFA
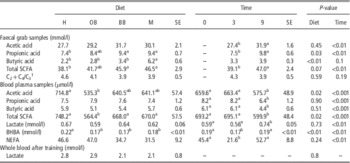
The concentration of total SCFA and individual acids were all lower in faeces as compared with caecal content except for butyric acid which was higher in the M diet (Tables 3 and 5). Diet affected (P⩽0.03) the concentration of propionic and butyric acids. The C2+C4/C3 ratio in faeces did not differ between diets. Except for butyric acid, the concentration of SCFAs increased (P<0.01) from 3 to 9 h postprandially. No interaction between diet and time was found.
Effect of diet and time on faecal grab samples and blood plasma on total short-chain fatty acids (SCFA), acetic acid, propionic acid and butyric acid

Blood plasma was additionally analysed for β-hydroxybutyrate (BHBA) and non-esterified fatty acids (NEFA) and whole blood was analysed for lactate immediately after training when hay only (H), oats and Betfor® (OB), barley and Betfor® (BB), and Equigard® (M) was fed to horses.
a.bWithin a row, means without a common superscript letter differ (P<0.05).
1 Acetic acid+butyric acid/propionic acid.
Diet effect on blood metabolite and hormone concentrations
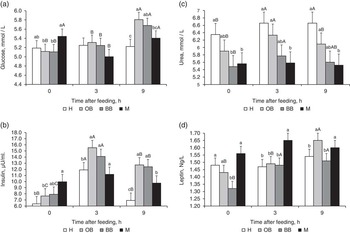
The concentrations of BHBA were significantly affected by diet (P<0.001) and highest on the H diet (Table 5). Lactate and NEFA concentrations were not affected by diet. The NEFA and BHBA concentrations were highest (P<0.01) in the morning, then decreased at 3 h postprandially and had returned to the basal levels after 9 h. The whole blood lactate immediately after training was numerically highest on the OB diet (2.9 mmol/l) followed by H, BB and M diets (Table 5). A strong interaction (P<0.01) between diet and time was found for glucose, insulin, urea and leptin and is illustrated in Figure 1. As expected, diet affected (P⩽0.001) the urea and hormone concentrations, where insulin was highest for OB and BB and leptin concentration was highest on the M diet followed by OB, H and BB. The insulin concentration was highest after 3 h and started to return to basal levels 9 h postprandially. The glucose concentration in the morning was significantly highest on the M diet and remained constant throughout the day, which consequently resulted in a stable and constant insulin concentration (Figure 1). The decrease in glucose concentration at time 3 on the M diet was due to one horse, which however, was not considered an outlier. Before feeding in the morning, the insulin concentration was significantly lowest for OB and BB, but it had increased to the highest level by 3 h postprandial and was still highest 9 h after feeding. The plasma concentration increased by >0.6 mmol/l for glucose and 6 µU/l for insulin from 0 to 9 h on diets OB and BB (Figure 1).
The postprandial interaction between diet and time on blood plasma glucose (a), insulin (b), urea (c) and leptin (d) in horses fed different diets (mean of eight samples). Hay (H), oats and Betfor® (OB), barley and Betfor® (BB), Equigard®, a chaff-based concentrate (M). A–B, a–c The letters indicate the level of significance (P⩽0.05), where the upper case indicates effect of time and the lower case indicates effect of diets.

Diet effect on blood plasma SCFA concentration
Blood plasma concentrations (Table 5) of acetic acid and total SCFA were affected by diet (P=0.02), where H resulted in the significantly highest concentration. Time affected plasma SCFA concentration (P⩽0.001), where the concentration was lowest after 9 h. No interaction was found between diet and time.
Discussion
Dietary composition
The diets were formulated with use of feed ingredients so as to achieve the highest possible difference in degrees of polymerisation and solubility of carbohydrates. The M diet had the highest content of S-NCP and the hay-only diet was associated with the second highest sugar intake. The highest starch content was associated with diets including cereal grains. The main focus of this study was to evaluate effects of different carbohydrate fractions; however, the daily requirement of protein was met.
Diet effect on caecal and faecal SCFA concentration
These results indicated that increased dietary soluble fibre and starch content stimulated caecal fermentation to increase total SCFA and propionic acid production in agreement with Jensen et al. (Reference Jensen, Brøkner, Bach Knudsen and Tauson2010). The diets resulted in stable and constant propionic acid production through 9 h and the significantly higher propionic acid production on the BB diet reflects additional contribution from fermented starch and β-glucans which have bypassed the small intestine or ante-caecum fermentation (Brøkner et al., Reference Brighenti2012a). The high propionic acid concentration throughout the day on all diets indicates a continuous supply of fermentable substrate, supposedly due to increased luminal viscosity (Bach Knudsen et al., Reference Bach Knudsen, Lærke and Hedemann2008) and metabolisation of lactic acid into propionic acid.
According to Van Soest (Reference Van Soest1994), the soluble fibre fraction is fermented to propionic acid through the succinate pathway without the formation of lactic acid as with starch. Formation of lactic acid as intermediate from starch leads to decreased caecal pH (Brøkner et al., Reference Brighenti2012a). In the attempt to shift the muscle energy supply from glucose to SCFA (Jansson et al., Reference Jansson, Saastamoinen and Lindberg2012), it is therefore recommended to use soluble fibre as substrate over starch in order to maintain equine gut health.
Increased hindgut fermentation due to higher dietary soluble fibre content is supported by the significantly higher faecal nitrogen excretion on the H and M diets followed by the BB diet (Brøkner et al., Reference Brighenti2012a) and lower plasma urea (BB and M) due to diminished hepatic urea synthesis as measured in the present experiment. This indicates repartitioning of N from urine to faeces, as N is captured for microbial biomass production and excreted in faeces (Lindberg and Palmgren Karlsson, Reference Lindberg and Palmgren Karlsson2001). This also indicates low protein digestibility of the diets as described in detail by Brøkner et al. (Reference Brighenti2012a). The significantly higher blood urea concentration on the H diet was ascribed to significantly higher nitrogen intake compared with the other diets.
Diet effect on blood metabolite and hormone concentrations
The plasma glycaemic and insulinaemic responses on the cereal grain diets resembled those of roughage-only-fed horses (Borgia et al., Reference Brøkner, Bach Knudsen, Karaman, Eybye and Tauson2011). However, when blood was sampled every 15 min glucose concentration was higher and peaked between 1.5 and 3 h postprandial using the same diets (Brøkner et al., Reference Brøkner, Austbø, Næsset, Bach Knudsen and Tauson2015). This indicates that blood glucose concentration in the present experiment at 3 h postprandial was descending and had peaked earlier.
The regulating function of insulin on cellular actions is essential in order to maintain a stable and constant blood glucose concentration (Schmidt and Hickey, Reference Schmidt and Hickey2009) and explains the insulin dynamics after 3 h as a response to earlier elevated blood glucose level (Brøkner et al., Reference Brøkner, Austbø, Næsset, Bach Knudsen and Tauson2015). The increased glucose concentration 9 h postprandially is in agreement with Hallebeek and Beynen (Reference Hallebeek and Beynen2003) and can be ascribed to gluconeogenic properties of propionic acid through hepatic gluconeogenesis. The glucose and successive insulin concentrations on the cereal grain diets were significantly lower than on the H and M diets in the morning and were significantly higher in the afternoon. This fluctuation demonstrates an effective down regulation of plasma glucose by insulin (Schmidt and Hickey, Reference Schmidt and Hickey2009), whereas the stable and constant blood glycaemic and insulinaemic responses on the M and H diets were attributed to fibre fermentation and consistent propionic acid production. Propionic acid accounted for as much as 50% to 60% of hepatic glucose production in non-exercising horses (Jose-Cunilleras and Hinchcliff, Reference Jose-Cunilleras and Hinchcliff2004). Liver glycogen is used to maintain normal glucose level in periods with diminished intestinal glucose absorption, which therefore makes S-NCP an excellent substrate to support the basic need of glucose of these organs and to maintain stable and constant plasma glucose and insulin levels.
BHBA in horses is a product of normal digestion and fatty acid metabolism (Zeyner, Reference Zeyner2008) and was measured in similar concentrations as reported by Hallebeek and Beynen (Reference Hallebeek and Beynen2003). Butyric acid is rapidly taken up by colonocytes (Zeyner, Reference Zeyner2008), where it is the principal oxidative fuel metabolised to ketone bodies by β-oxidation. This results in lower portal butyric acid levels as compared with concentrations in colonic content, which is compatible with the present study.
No diet effect on venous blood SCFA concentration was expected due to their metabolisation in hepatic and gut tissues, except for acetic acid. Absorbed acetic acid bypasses the liver and reaches the peripheral circulation (Pethick et al., Reference Pethick, Rose, Bryden and Gooden1993). In agreement with Jansson et al. (Reference Jansson, Saastamoinen and Lindberg2012) the hay-only diets resulted in higher plasma acetic acid concentration as compared with mixed diets in the present study. Jansson et al. (Reference Jansson, Saastamoinen and Lindberg2012) speculated that the higher plasma acetic acid concentration could be explained by higher SCFA production as a result of fibre fermentation. This is in agreement with the present study, where a higher total blood SCFA and acetic acid concentration was found on the H and M diets, which were assumed to cause relatively higher hindgut fermentation as compared with the other diets. Pethick et al. (Reference Pethick, Rose, Bryden and Gooden1993) showed that acetic acid contributed with 32% of the total substrate oxidation in the equine hind limb, which then decreased when oats were added to the diet. The higher plasma acetic acid concentration therefore indicates a specific selection of substrates by the working muscle supposedly driven by availability of nutrients.
No diet effect on NEFA concentration was measured, which is contradictory to Jose-Cunilleras et al. (Reference Jose-Cunilleras, Hinchcliff, Sams, Devor and Linderman2002), but could be explained by insufficient difference between forage and concentrate levels and formulation of isoenergetic diets. Time affected NEFA, which was highest in the morning after overnight fasting (substrate mobilisation from the adipose tissue) and decreased as a result of the morning meal and returned to the pre-feeding level after 9 h. The leptin concentration found in the present study was within the normal range, that is 0.1 to 6 ng/ml (Cartmill et al., Reference Cartmill, Thompson, Storer, Gentry and Huff2003), and similar to values found in horses with low body condition score (Gentry et al., Reference Gentry, Thomsen, Gentry, Davis, Godke and Cartmill2002).
Fibre-based diets for exercising horses
The diets used in the present study were formulated to be isoenergetic and to fulfil the energy requirements for horses at medium work level. Further, the calculation of the energy content of the diets before the experiment was based on the French energy system for horses (Vermorel et al., Reference Vermorel, Martin-Rosset and Vernet1997) and adapted to the Scandinavian feed unit (Austbø, Reference Austbø2004). The diets covered the minimum energy requirement of 84 MJ ME for horses working at medium level. However, Jansson and Lindberg (Reference Jansson and Lindberg2012) showed that the daily feed intake of Standardbred trotters in training ranged from 100 to 120 MJ ME, which according to Austbø (Reference Austbø2004) corresponds to more than twice their maintenance energy requirement.
In the present study, the amount of ME derived pre-caecally can be estimated from digestible sugar and starch (Brøkner et al., Reference Brighenti2012a) and in the hindgut by subtracting the ME derived pre-caecally from the total ME intake. The ME sums up to 20 MJ ME (H), 30 MJ ME (OB), 29 MJ ME (BB) and 25 MJ ME (M) pre-caecally and 64 MJ ME (H), 57 MJ ME (OB), 54 MJ ME (BB) and 61 MJ ME (M) from the hindgut and represents energy derived from fermentation of primarily fibre, sugar and to some extent starch escaping digestion in the small intestine. These calculations indicated that on these diets the highest amount of energy was derived from the hindgut, which was more distinct on the hay-only diet. In spite of the isoenergetic diets, there were indications of a negative energy balance on the hay-only diet, as the horses had a numerically higher plasma NEFA concentration, significantly higher plasma BHBA concentration and on average lost 10 kg, which indicates fat mobilisation. Fat mobilisation could also be explained by the horses in the present study being working harder than medium level. However, the plasma lactate immediately after training was on average 2.5 mmol/l, which points that the anaerobic threshold was not reached and that the horses were working aerobically (Jose-Cunilleras and Hinchcliff, Reference Jose-Cunilleras and Hinchcliff2004). In addition, all horses were trained according to the same standard exercise programme.
These results indicate that horses derive less energy from forage-only diets than expected. This corresponds to the study by Jansson and Lindberg (Reference Jansson and Lindberg2012) who fed 45% more ME as compared with the present study. This is partly explained by higher exercise level and inaccurate systems to evaluate energy derived from various feeds. Therefore, the horses in the present study needed more feed or perhaps could benefit from a higher energy supply derived pre-caecally, as was the case in mixed diets in order to complete their exercise protocol repeatedly day after day.
In conclusion, this study found that inclusion of soluble fibre resulted in increased caecal SCFA and propionic acid concentration, which consequently resulted in stable and constant blood glycaemic and insulinaemic responses. The results suggested that fibre-based diets with high content of soluble fibre could fulfil the energy requirements for horses at medium work level.
Acknowledgements
The authors acknowledge Mette Henne for technical assistance during the practical part of the experiment and Nordic Sugar A/S, St. Hippolyt Denmark A/S and the Danish Directorate for Development for financial support.