Milking can affect udder health by transferring pathogens to teat skin and teat orifice and by reducing the natural barrier function of the teat canal (Hamann, Reference Hamann1987). Mein et al. (Reference Mein, Reinemann, Schuring and Ohnstad2004) estimated that indirect effects of the milking machine on the health of teat canal, teat tissue and skin account for 10% of new mastitis infections in an average herd. The constant interaction between vacuum, liner and teat during several weeks of lactation subjects the teat tissue and canal to a serious wear. The keratin lining of the teat canal is an important factor in the defence mechanisms of the teat and acts as a first barrier against invading microbes (Capuco et al. Reference Capuco, Bright, Pankey, Wood, Miller and Bitman1992). Keratin is constantly produced by the teat canal epithelium, and its protective effects depend on its physical and chemical properties (Paulrud, Reference Paulrud2005). Several studies suggest that production, composition, and loss of teat-canal keratin are altered by milk flow properties and mechanical forces, such as shear forces and compressive load, applied to the teat canal epithelium during milking (Capuco et al. Reference Capuco, Woods, Bright, Miller and Bitman1990, Reference Capuco, Wood and Quast2000; Hamann et al. Reference Hamann, Burvenich, Mayntz, Osteras and Haider1994a). Harsh milking conditions likely increase loss of keratin and mechanical forces to the teat canal epithelium and hence are associated with worse teat condition. Thereby, teat morphology, teat-end vacuum, pulsation settings (Bade et al. Reference Bade, Reinemann, Zucali, Ruegg and Thompson2009), liner design (Hamann et al. Reference Hamann, Osteras, Mayntz and Woyke1994b), and liner tension (Mein et al. Reference Mein, Williams and Thiel1987) influence compressive load and milk flow properties. An indication of an altered keratin turnover is a palpable thickening of the Stratum corneum and the circular muscle layer (Hamann et al. Reference Hamann, Burvenich, Mayntz, Osteras and Haider1994a), so called teat-end hyperkeratosis. Teat-end hyperkeratosis can vary in thickness and roughness. Neijenhuis (Reference Neijenhuis2004) reported on average 28% clinical mastitis cases per cow-year at risk and an increased risk for clinical mastitis in quarters with rough teat-end hyperkeratosis. One theory to explaining the higher mastitis risk is a higher microbial load in teat canals with rough hyperkeratotic structures. This theory was lately supported by findings of Paduch et al. (Reference Paduch, Mohr and Krömker2012) concerning environmental pathogens. In addition, loss of keratin during milking and alterations in the keratin proliferation and composition might contribute to a higher mastitis risk.
Liner design influences the degree of teat-end hyperkeratosis due to its effect on milk flow and compressive load (Mein et al. Reference Mein, Reinemann, O'Callaghan and Ohnstad2003). Repeated compression of the teat apex by the liner during milking is important to relieve teat congestion. Mein et al. (Reference Mein, Williams and Thiel1987) suggested loads of 8–12 kPa as physiologically optimal, i.e. close to arterial pressure but not above. The required amount of pressure to the teat apex increases with increasing vacuum level (Mein et al. Reference Mein, Reinemann, O'Callaghan and Ohnstad2003; Bade et al. Reference Bade, Reinemann, Zucali, Ruegg and Thompson2009). The resulting compressive load to the teat apex can be affected by teat morphology and by liner design characteristics, such as wall thickness and stiffness of liner barrel (Mein et al. Reference Mein, Williams and Thiel1987), its diameter and effective length (Hamann et al. Reference Hamann, Osteras, Mayntz and Woyke1994b), and the shape of liner barrel (van der Tol et al. Reference Van der Tol, Schrader and Aernouts2010). In a round liner barrel, the force of the closing liner is transferred by the two opposite sides of the liner wall, exerting a high punctual compressive load to the teat apex. Liners with multi-sided barrel shape close at three or more planes and hence distribute their force to a larger horizontal and vertical area, resulting in a lower maximum pressure at the teat apex (van der Tol et al. Reference Van der Tol, Schrader and Aernouts2010). If compressive load to the teat apex is an important causative factor for teat-end hyperkeratosis, a liner with a multi-sided barrel shape would be expected to reduce the degree of teat-end hyperkeratosis. Such an effect was indicated in former studies with regard to triangular liners (Lamb et al. Reference Lamb, Thomas, Walters and Boman1984; Kochman & Laney, Reference Kochman and Laney2009; Haeussermann et al. Reference Haeussermann, Rudovsky and Schlaiß2011). However, the field scoring method in these studies, adopted from Mein et al. (Reference Mein, Neijenhuis, Morgan, Reinemann, Hillerton, Baines, Ohnstad, Rasmussen, Timms, Britt, Farnsworth, Cook and Hemling2001), merges effects on thickness and roughness of teat-end hyperkeratosis and it is not clear if both are reduced to the same extent. Schukken et al. (Reference Schukken, Petersson and Rauch2006) investigated teat-end hyperkeratosis in dairy farms that switched to squared liners and reported effects of lactation stage, parity, farm, and liner type on teat-end hyperkeratosis. The authors clearly indicated that the results are valid for the specific liner type only (Schukken et al. Reference Schukken, Petersson and Rauch2006). The objectives in the current study were to: (1) investigate if a liner with a specific barrel design, three-sided with thin concave side walls and rounded barrel corners, reduces the degree of teat-end hyperkeratosis compared with a standard round liner; (2) determine how much time is needed to see an effect of the treatment, and (3) determine if this effect concerns thickness or roughness of teat-end hyperkeratosis or both. A split-udder arrangement of liners was used in order to exclude disturbances due to unknown external effects, and control treatment was applied by a liner with round barrel shape.
Materials and methods
Experimental design and liners
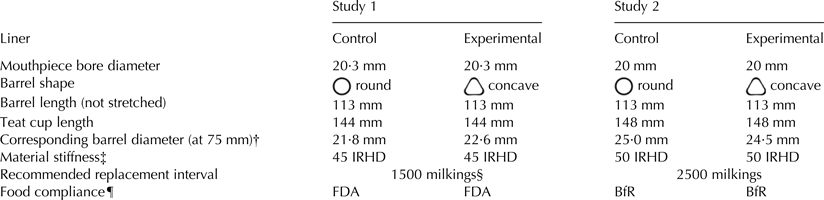
The experiments were conducted in two commercial dairy farms, one in Jerome, Idaho, USA (study 1) and one in Northern Germany (study 2). A split-udder arrangement of liners was used during the test period in both studies: the control liner was placed on left front (LF) and right rear (RR) quarters (control), and the experimental liner on left rear (LR) and right front (RF) quarters (treatment). Control and experimental liners differed particularly in their barrel shape (round vs concave; Table 1): control liner was LS01 10SR in study 1; experimental liner was Clover ™10SR. In study 2, control liner was the European pendant Harmony 20M and experimental liner was Clover ™20M (all liners manufactured by DeLaval Int., Tumba, Sweden). The two liner types for control treatment shared a common round barrel shape and the two liner types for experimental treatment shared a similar multi-sided concave barrel geometry with thick and thin longitudinal barrel portions (Table 1). Liner types in studies 1 and 2 were chosen according to country-specific regulations and practices, and differed, e.g., in rubber composition. In addition, the size of the liners fitted the country-specific teat cups. As dairy farms in Europe commonly use liner types with wider barrel diameters than farms in the U.S., the barrel diameters of both control and experimental liners in study 1 were more narrow than those in study 2 (Table 1).
Design characteristics of control and experimental liners

† Corresponding diameter: circumference/pi.
‡ Measured according to ISO 48.
§ Recommended replacement interval during the years of the experiments (currently: 2500 milkings).
¶ FDA food and drug administration, MD, U.S.; BfR Bundesinstitut für Risikobewertung, Berlin, Germany.
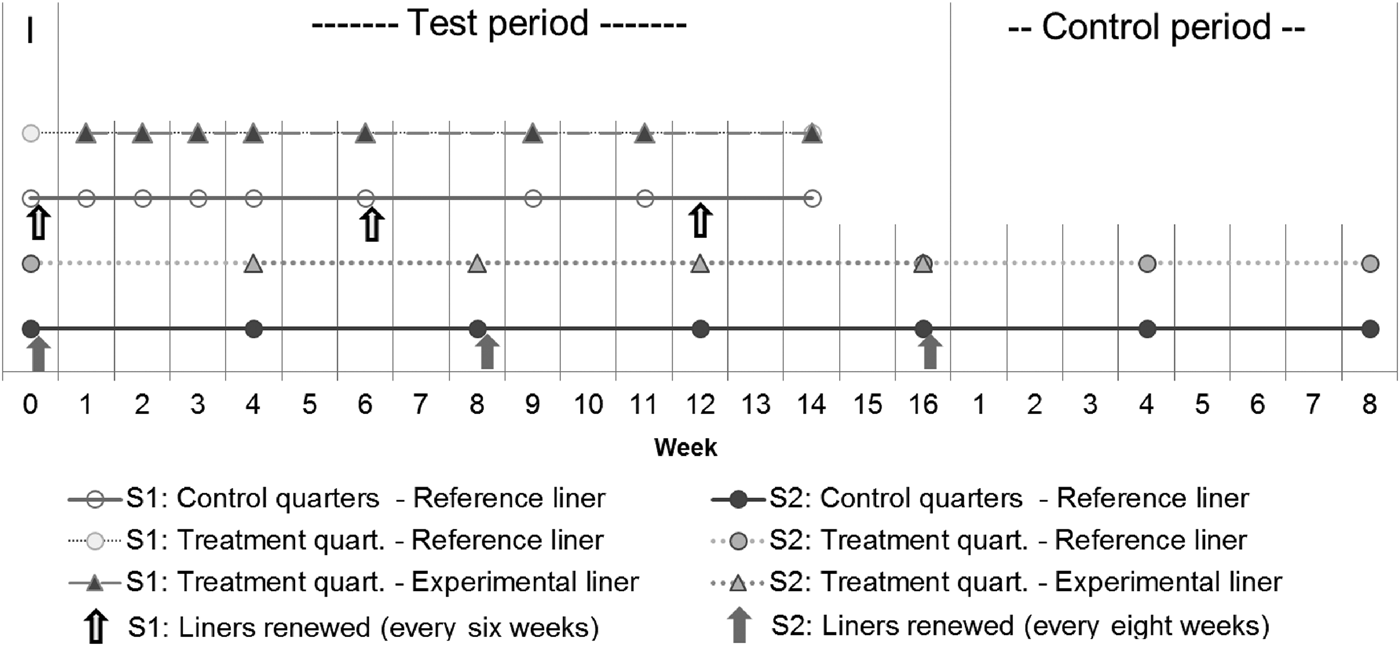
The experiments started with an initial baseline evaluation at T = 0, followed by a 14- to 16-week-long test period (Fig. 1). Cows were milked with the control liner before starting the test period. Teats were scored once to establish baseline and four to eight times during the test period. In study 1, the experimental liners were installed on June 29th, 2012 (week 0) and tested until October 10th, 2012 (week 14). Scoring was conducted weekly during the first 4 weeks of the test period in order to evaluate the time delay until potential effects appear first. Teat scoring was continued in a 2 to 3 week interval afterwards (Fig. 1). In study 2, long-term effects and the return of teat condition during a control period were investigated. The experimental liners were installed on March 14th, 2013 (week 0) and tested until July 9th, 2013 (week 16). The 16-week-long test period was followed by an 8-week-long control period (Jul 9th–Sep 5th, 2013), during which all four quarters were milked again with the control liner (Fig. 1).
Scoring dates (marked by symbols) during initial (I), test and control period in studies 1 (S1) and 2 (S2); type of symbol refers to study, treatment and quarter (quart.).
Scoring in study 2 was conducted in a 4 week interval throughout the entire period. Liners were renewed at the beginning of the test period in both studies and then in accordance with the recommended replacement interval of liners (Table 1), i.e. every 6 weeks in study 1 and every 8 weeks in study 2.
Selection of experimental animals
The milking herds in the two dairy farms consisted of around 350 to 400 Holstein cows. A preselection of study animals was conducted prior to initial scoring, excluding cows with atrophic quarters, treated with antibiotics, in colostrum, and cows in late lactation. Selection criteria for the latter was milk yield in study 1, i.e. cows with less than 23 kg of milk per day were removed, and production group (early and mid-lactation; about 10–180 DIM) in study 2. Preselected cows that were dried off or left the herd for any reason during the course of the study were removed from the evaluation. The remaining cows, i.e. 54 cows in study 1 and 150 cows in study 2, were used for the statistical analysis.
In study 1, 151 cows were preselected and initially scored, of which 54 cows were present in the herd each scoring date until the end of the trial. The preselected cows were on average 205 d in milk (DIM), their average lactation number was 2·9, and average daily milk yield was 34 kg.
In study 2, 302 cows were preselected and initially scored, of which 150 cows were present in the herd until the end of the trial. These 150 cows were on average 142 DIM in week 8 of the test period, their average lactation number was 2·8, and average daily milk yield was 39 kg.
Milking parlour and settings
Cows in study 1 were milked twice daily in a 2 × 8 herringbone parlour. Settings were: 60 cycles/min pulsation rate, 65:35 pulsation ratio, alternate pulsation, and 42 kPa operating vacuum. Milking routines included: spray disinfection of teats, teat cleaning and cluster attachment, done four cows at a time, by one milker, automatic cluster removal, and post milking teat disinfection.
In study 2, cows were milked thrice daily in a 2 × 12 herringbone milking parlour. Settings were: 60 cycles/min pulsation rate, 64:36 pulsation ratio, alternate pulsation, and 42 kPa operating vacuum. Pulsation was tested and maintained regularly during the trial period. Milking routines included: checking of first milk in a foremilk cup, teat cleaning and cluster attachment per six cows, automatic cluster removal, post milking teat disinfection, and liner disinfection (peracetic acid) after each cow milking.
Teat scoring
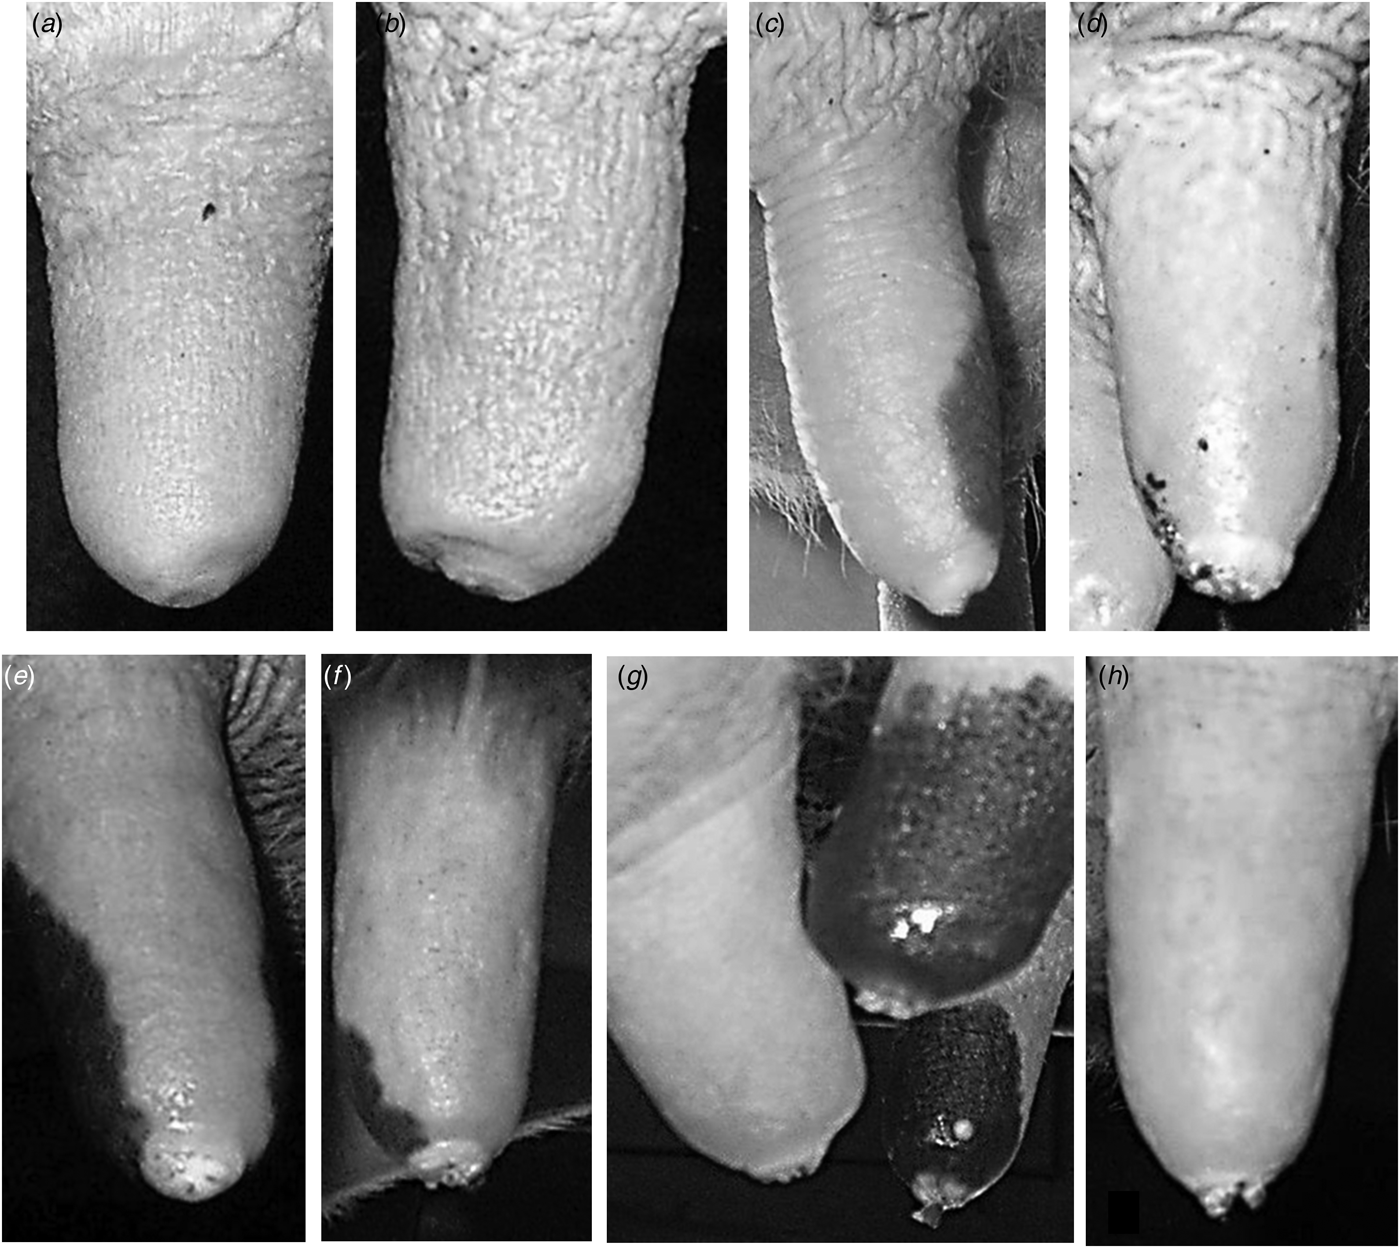
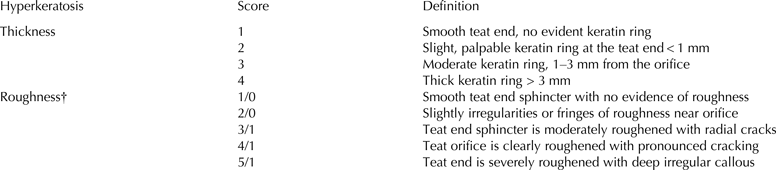
Teat-end hyperkeratosis was scored immediately after milking. Thickness and roughness were assessed consistently by the same person, although by different persons in studies 1 and 2. The two persons used the same descriptive guidelines, explained in Table 2. Examples of teats with different scores are shown in Fig. 2. Thickness of teat-end hyperkeratosis was assigned to four categories, with none, 1, and 3 mm thickness as thresholds between scores. Roughness of teat-end hyperkeratosis was assessed in five categories in study 1 (Table 2), and in two categories in study 2, i.e. scores 1 and 2 (smooth or slightly rough) and scores 3 to 5 (rough) were merged into two categories, score 0 and score 1, respectively, in study 2. Statistical analysis of roughness was based on these two categories in both studies.
Examples of teat-end hyperkeratosis thickness scores 1 to 4 (a, b, c, d), and teat-end hyperkeratosis roughness scores 1 and 2 (a, e; ‘smooth or slightly rough’) and 3 to 5 (f, g, h; ‘rough’).
Scoring chart for evaluation of thickness and roughness of teat-end hyperkeratosis
† Roughness of teat-end hyperkeratosis was assessed in five categories in study 1 and in two categories in the second study. Statistical analysis was based on two categories (0, 1) in both studies.
Data analysis
Pearson's χ2 (Chi square analysis IBM SPSS Statistics 21) was used to analyse effects of farm, test week and treatment on the incidence of scores 1 to 4 in respect of thickness of teat-end hyperkeratosis. For the analysis, the data set was split into reasonable sub-sets, e.g. using test week as split variable, leaving one score per teat per data set. A weighted average, i.e. frequency of each thickness score multiplied with score number, was calculated to picture temporal variations in thickness of teat-end hyperkeratosis but was not used for statistical analysis. Incidence of roughness of teat-end hyperkeratosis in control and treatment quarters was analysed using McNemar test for paired samples (IBM SPSS Statistics 21). A teat pair was defined as the two rear or front quarters per cow, i.e. one teat receiving experimental treatment and its opposite pair receiving control treatment. Statistical analysis was done separately per test week in study 1. Due to the low incidence of roughness in study 2, the analysis was split into initial week 0, test week 4, test weeks 8–16 (blocked), and week 8 of the control period.
Results
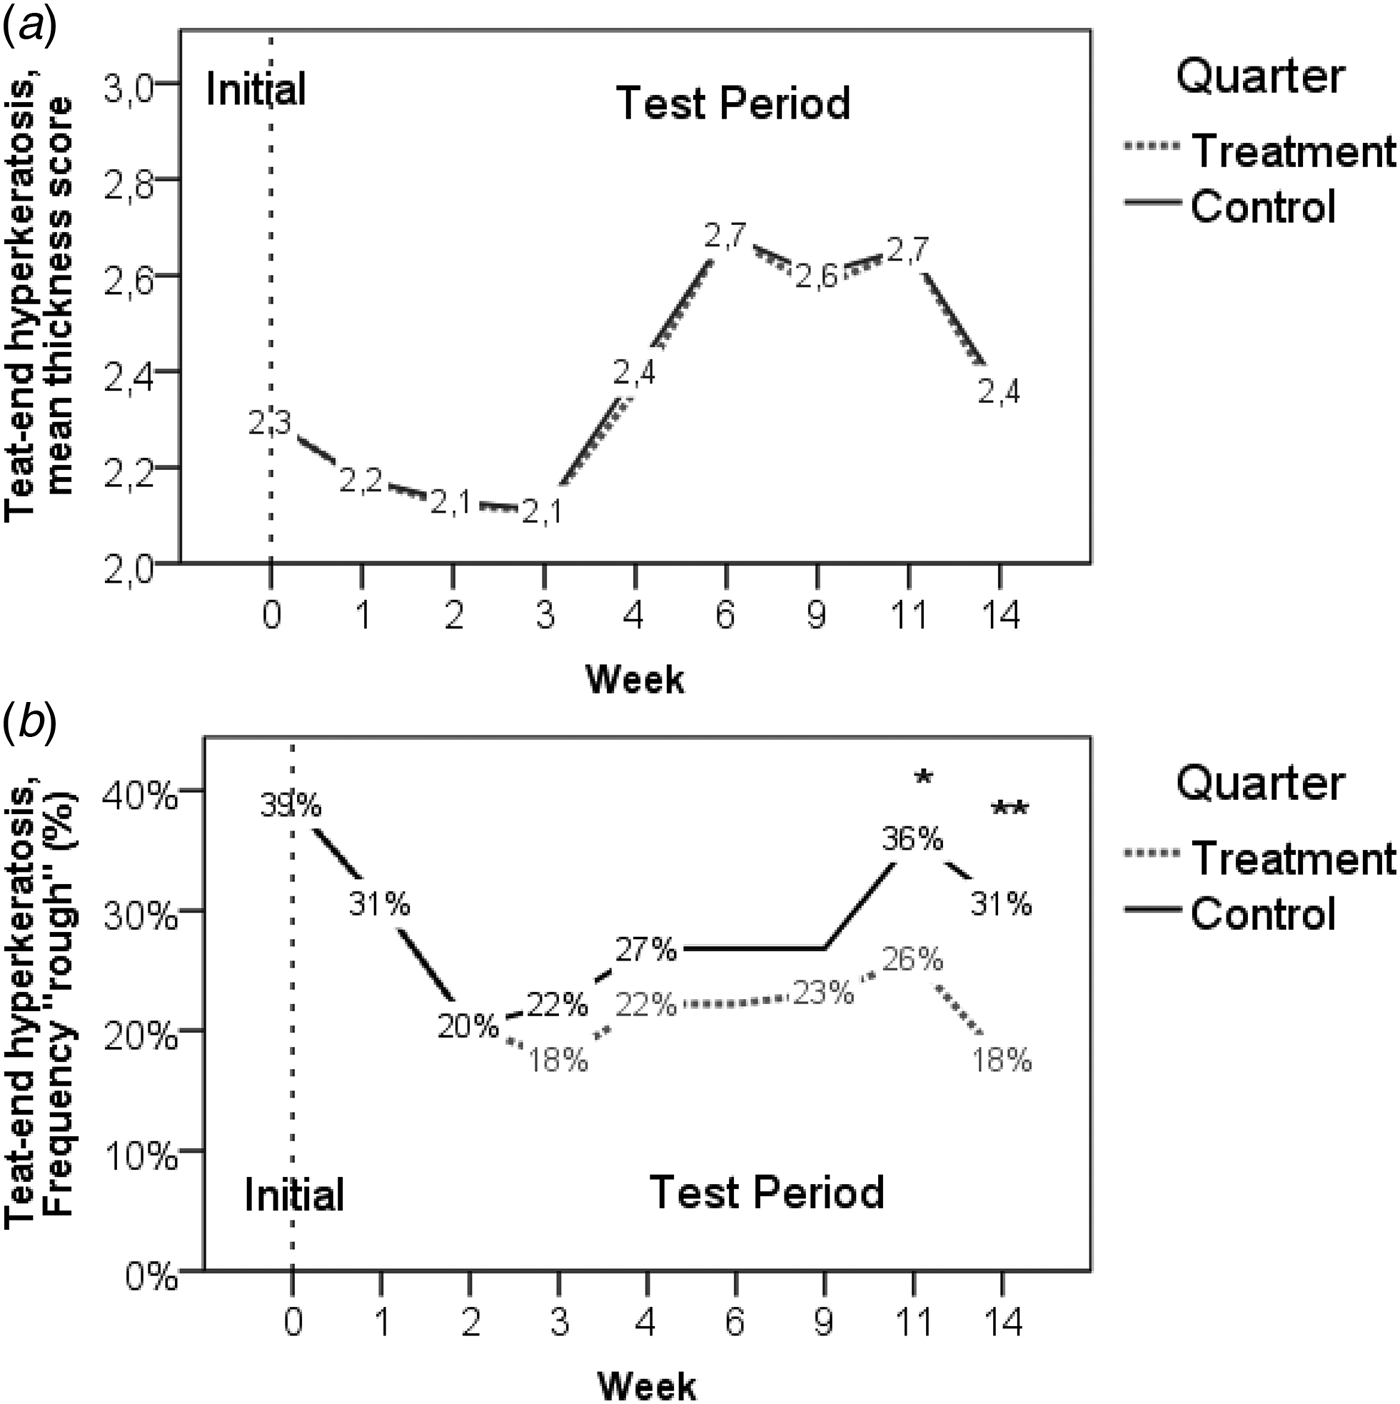
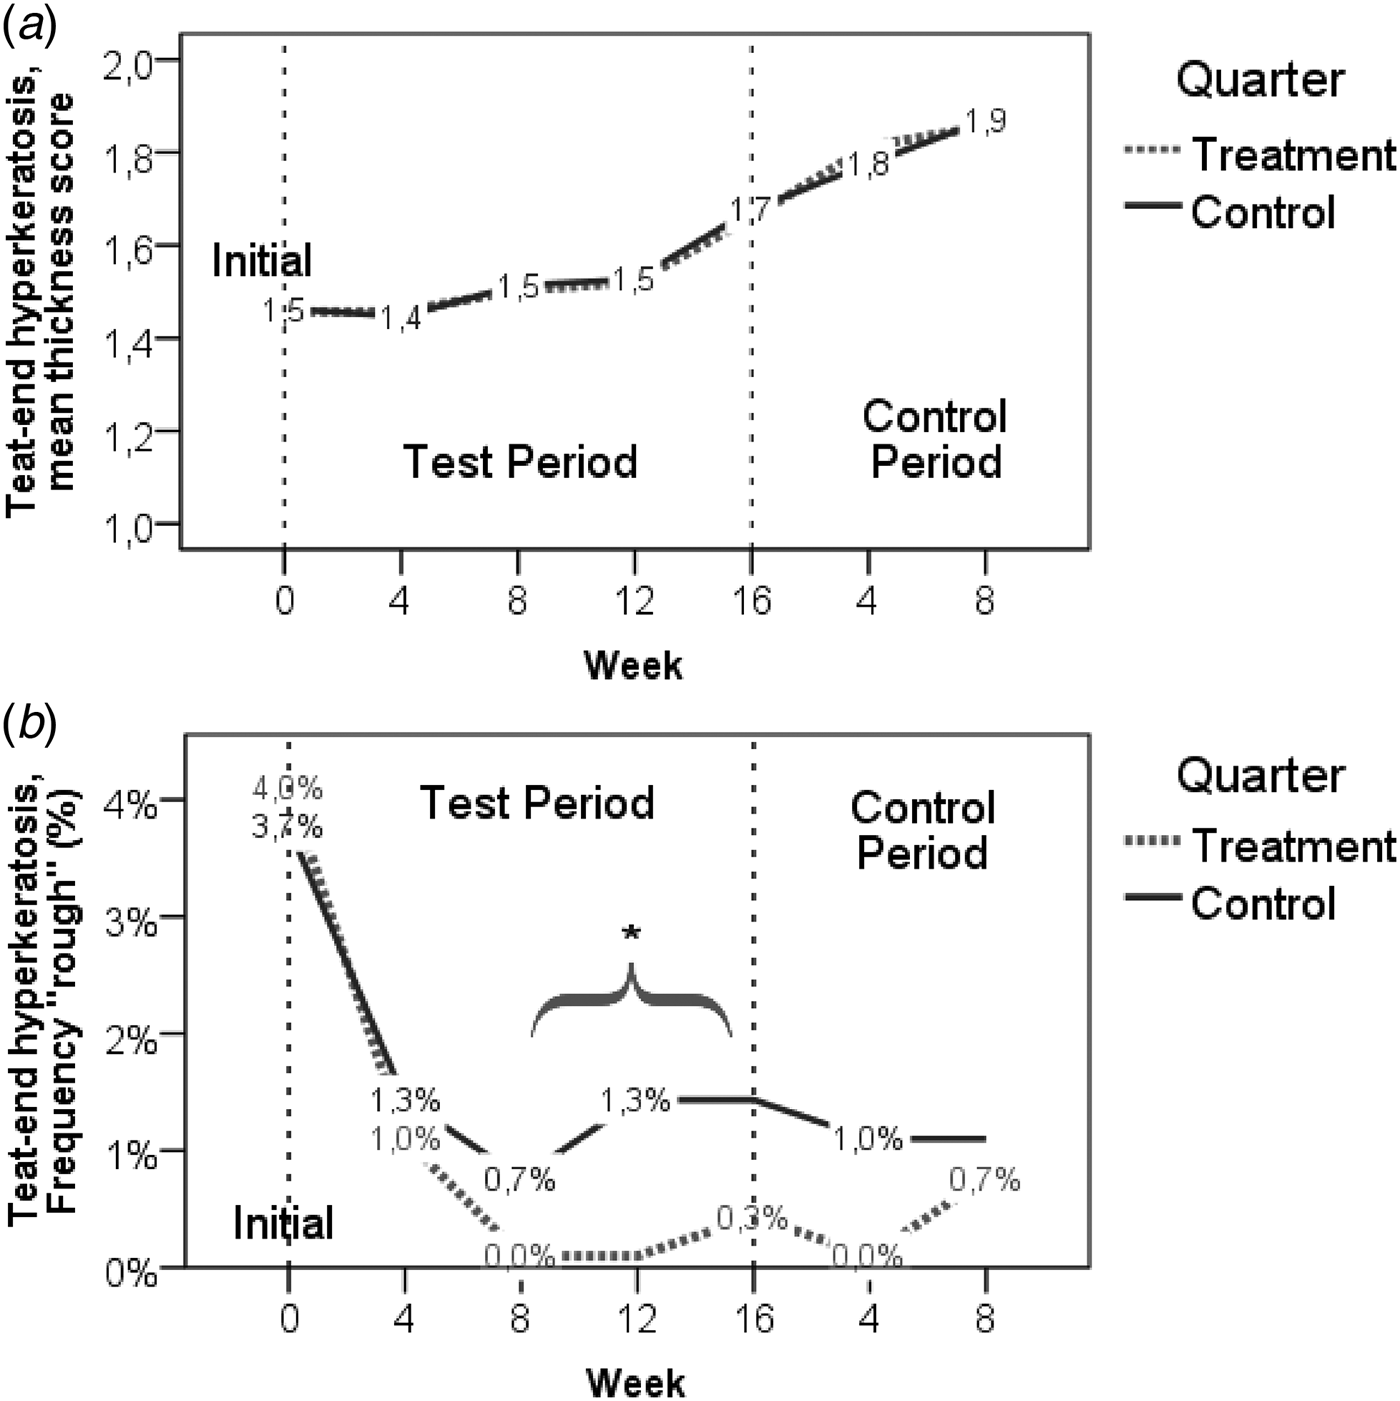
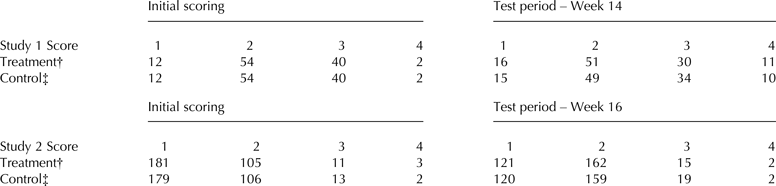
Incidence of teat-end hyperkeratosis clearly differed between the two farms (P < 0·001), i.e. the baseline and subsequent findings in study 1 were constantly on a higher level than in study 2. For example, at the initial scoring, 87% of the teats were categorised into thickness scores 2 (50%) and 3 (37%) in study 1, and 95% of the teats in thickness scores 1 (60%) and 2 (35%) in study 2 (Table 3). Thickness score 4 was found in less than 2% of the teats in both farms. The weighted average of thickness scores was 2·3 at the initial scoring in study 1, dropped to its minimum of 2·1 within the first 3 weeks of the test period, then increased during the next 3 weeks to its maximum of 2·7 (Fig. 3a). By week 14 of the test period, the weighted average returned to a value close to its initial value. Incidence of score 4 was increased to approximately 10% of the teats at this time, and incidence of scores 2 and 3 were decreased to 46 and 30%, respectively (Table 3). Treatment had no effect on thickness of teat-end hyperkeratosis, irrespective of the test week. However, test week had an influence (P < 0·001). A shift towards higher teat end hyperkeratosis scores occurred in the time period around July, and was followed by a pronounced drop towards October (week 14, Fig. 3a). In study 2, the weighted average of thickness scores was close to 1·5 at the initial scoring, remained nearly stable at this value during the first 12 weeks of the test period, and then increased during the following 12 weeks to its maximum value of 1·9 (Fig. 4a). The increase until week 16 was mainly due to a reduction in the number of teats with score 1 from 60 to 40%, and a concurrent increase in score 2 from 35 to 54% (Table 3). The incidence of teats with scores 3 rose slightly from 4% to about 5%, and the incidence of score 4 was nearly unchanged. Teats with score 1 were reduced further to 33% during the 8-week-long control period, while teats with score 3 were found more often, i.e. in 16% of the teats, at the end of the control period. Like in study 1, treatment had no effect on thickness of teat-end hyperkeratosis, irrespective of the scoring date, but test week had an influence (P < 0·001). The increase in thickness of teat-end hyperkeratosis started in July and persisted until the end of the control period in September (Fig. 4a).
Temporal course of (a) teat-end hyperkeratosis thickness weighted average, and (b) incidence of rough teat-end hyperkeratosis in study 1 (n = 54 cows). Statistical differences between quarters are marked: *P < 0·05; **P < 0·01.
Temporal course of (a) teat-end hyperkeratosis thickness weighted average, and (b) incidence of rough teat-end hyperkeratosis in study 2 (n = 150 cows). Statistical differences between quarters are marked: *P < 0·05 (block analysis, week 8–16).
Incidence of teat-end hyperkeratosis thickness scores 1 to 4 at initial and final scoring of the test period, in study 1 (n = 54 cows), and study 2 (n = 150 cows)
† Left rear and right front quarters.
‡ Right rear and left front quarters.
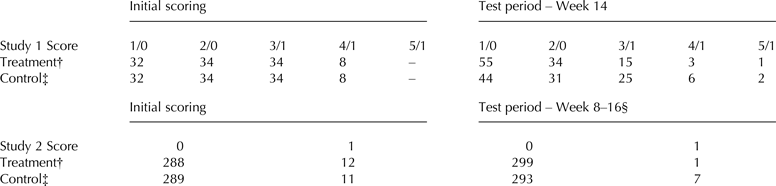
Rough teat-end hyperkeratosis (scores 3/1, 4/1, 5/1) at initial scoring was found in 39% of the teats in study 1 but only in 4% of the teats in study 2 (Table 4). Treatment and control quarters did not differ at the initial scoring date. Incidence of rough teat-end hyperkeratosis in study 1 dropped to approximately 20% in the first 2 weeks of the test period, both in control and treatment quarters, and fairly remained on this level during the subsequent 7 weeks (Fig. 3b). A significant effect of treatment was found by weeks 11 (P = 0·013) and 14 (P = 0·003). Incidence of rough teat-end hyperkeratosis was 36 and 31%, respectively, in control quarters, and hence slightly increased in comparison to the weeks before, while in treatment quarters it remained at 26 and 18% (Fig. 3b, Table 4). Across all scoring dates, the majority of the teats scored ‘rough’ were categorised into score 3, i.e. 73 and 81% in control and treatment quarters, respectively. Thus, scores 4 and 5 were found in 27% of the control quarters and in 19% of the treatment quarters that were scored ‘rough’. Score 5 was found only once in week 2, in nine teats in week 11, and in three teats in week 14. Rough teat-end hyperkeratosis was in general rare in study 2. Its incidence dropped from 4 to 1% of the scored teats within the first 4 weeks of the test period (Fig. 4b). Control quarters remained at this level until the end of the study, while rough teat-end hyperkeratosis in treatment quarters was hardly evident during the test period and seldom during the control period. Due to the low incidence, a block evaluation (week 8–16) was applied for analysing effects of treatment. In comparison to the results in study 1, an effect of treatment occurred on a considerably lower level but still was existent (P = 0·031). After 8 weeks of control period, during which treatment and control quarters were both milked with the control liner, incidence of rough teat-end hyperkeratosis in treatment quarters drew near the level of the control quarters again (Fig. 4b).
Incidence of teat-end hyperkeratosis roughness scores 1/0 to 5/1 at initial and final scoring of the test period, in study 1 (n = 54 cows), and study 2 (n = 150 cows)
† Left rear and right front quarters.
‡ Right rear and left front quarters.
§ Block evaluation week 8–16.
Discussion
Results of former surveys suggest that in most farms the majority of teats show either a normal teat orifice or teat-end hyperkeratosis thicknesses of up to 1–2 mm (Shearn & Hillerton, Reference Shearn and Hillerton1996; Neijenhuis, Reference Neijenhuis2004). According to recommendations of Mein et al. (Reference Mein, Neijenhuis, Morgan, Reinemann, Hillerton, Baines, Ohnstad, Rasmussen, Timms, Britt, Farnsworth, Cook and Hemling2001), incidence of teat-end hyperkeratosis with thickness score 3 and 4 and rough surface should not occur in more than 20% of the cows of a herd. The herd involved in study 1 were already close to this threshold at the beginning of the test period and clearly exceeded it in test weeks 4 to 14, which was not the case in study 2. There are several possible reasons for the different basic level of the two farms besides milking, such as genetics, environment (weather conditions), or farm practices including nutrition, bedding material, and teat disinfection (Shearn & Hillerton, Reference Shearn and Hillerton1996; Paulrud, Reference Paulrud2005; Rudovsky et al. Reference Rudovsky, Pache and Schulz2011). Teat-end hyperkeratosis increases with lactation stage and parity (Shearn & Hillerton, Reference Shearn and Hillerton1996; Neijenhuis, Reference Neijenhuis2004; Paulrud, Reference Paulrud2005), and cows were in average already more than 200 DIM when study 1 started but less than 100 DIM in study 2.
The shift in thickness and roughness of teat-end hyperkeratosis, e.g. from thickness score 3 to 4 and from thickness score 1 to 3 during the course of studies 1 and 2, respectively, might partly be explained by the continuous increase in lactation stage, and partly by variations in temperature-humidity conditions. Cold and humid but also hot and dry weather conditions cause dry teat skin, and thereby increases micro-fissures at the teat end and hence hyperkeratosis (Mein et al. Reference Mein, Reinemann, O'Callaghan and Ohnstad2003). In this context, the split-udder arrangement of experimental and control liners in the two studies helped to avoid likely confusion of treatment and external effects. Teat-end hyperkeratosis, thickness and roughness, were altered quite often during the course of the trial and within a time span of 2 to 3 weeks a new base level was reached in general, shown particularly in the time periods with frequent scoring in study 1. In contrast, it took up to 11 weeks until a significant difference between treatment and control quarters occurred in study 1, and the most distinct difference between treatment and control quarters was found by about week 12 of the test period in study 2.
The main effect of milking on teat-end hyperkeratosis are due to deformations and forces passed on to the teat. The liner accounts for a large part of these forces, primarily because of the compressive load applied by the liner to the teat tissue at c- and d-phase of the pulsation (Mein et al. Reference Mein, Williams and Thiel1987), and secondly due to the expansion of the teat during a- and b-phase of the pulsation (Reitsma & Scott, Reference Reitsma and Scott1979). A certain amount of compressive load to the teat-end is necessary to reduce teat congestion (Mein et al. Reference Mein, Williams and Thiel1987). Excessive compression however is associated with an increased risk for severe teat-end hyperkeratosis (Mein et al. Reference Mein, Reinemann, O'Callaghan and Ohnstad2003). A multi-sided barrel shape distributes compressive load to a larger area of the teat, and hence reduces pressure peaks at the teat apex (van der Tol et al. Reference Van der Tol, Schrader and Aernouts2010). In addition to the multi-sided barrel shape, the experimental liner differed from the control liner in respect of its barrel thickness design: flexible, thin side portions distribute compression to a large area of the teat during c- and d-phase of the pulsation, while teat expansion during a- and b-phase is restricted by thick side portions of the barrel. When the liner opens during a- and b-phase of the pulsation, the teat in a liner expands until it reaches the liner sides. Radial stretching of the teat as a response to vacuum increases micro-fissures at the teat canal epithelium and likely increases keratin proliferation. An increase in radial stretching of the teat skin in response to an increased liner bore was indicated for example in Hamann et al. (Reference Hamann, Nipp and Persson1994c). A liner with a narrow bore, less flexible side portions or a shortened ratio of liner opening restricts the extent of radial stretching of the teat. A third aspect when it comes to loss and turnover of teat canal keratin is the shear force of the milk flowing through the teat canal. It cannot be excluded that milk flow profiles, e.g. within one pulsation cycle, might have been altered by the experimental liner to some extent. Preceding milk flow measurements in a quarter individual milking system, however, suggested that average and peak milk flow in quarters milked with the experimental liner did in average not differ from quarters milked with the control liner (Haeussermann A, unpublished).
The results in studies 1 and 2 concur insofar as milking with the experimental liner did change the incidence of rough teat-end hyperkeratosis but not its thickness compared to milking with the control liner. Likewise, Britten et al. (Reference Britten, Hanson and Pedraza2004) reported a reduction in roughness but not in thickness of teat-end hyperkeratosis depending on teat disinfectants. However, teat disinfection was not varied during the trial and teat-pairs were always subject to equal external effects. The results suggest rather that the effect was not reached necessarily by sole reduction of compressive load to the teat-end but rather due to a shift in diverse characteristics in teat-liner interaction. In this context, the spatiotemporal distribution of the compressive load, total pressure area, and the radial stretching of the teat might be more important than an average value of teat compression.
Prevention of roughness of teat-end hyperkeratosis is highly important because of the increased mastitis risk (Neijenhuis, Reference Neijenhuis2004). The question whether the tested liner barrel design reduces not only the incidence of rough teat-end hyperkeratosis but also the incidence of udder infections cannot be answered from the current data and should be investigated further. The effect on roughness of teat-end hyperkeratosis was more pronounced in study 1, mainly due to the higher incidence. Rough teat-end hyperkeratosis was very seldom in the second study and hence its results purely indicate that the barrel design of the experimental liner may cause similar effects on different farms but in varying magnitude.