INTRODUCTION
Ascochyta blight caused by Ascochyta rabiei (Pass.) Labrousse is one of the most serious diseases of chickpea (Cicer arietinum L.) worldwide, causing complete crop failure in severely affected fields (Reddy & Singh Reference Reddy and Singh1984) and, consequently, limiting chickpea yield. The pathogen causing this disease has been classified mainly into two broad pathotypes: pathotype I (less aggressive) and pathotype II (aggressive) (Chen et al. Reference Chen, Coyne, Peever and Muehlbauer2004). The most effective and environmentally safe strategy to control this disease is the development of resistant cultivars and this has been a major goal of chickpea breeders all over the world. In order to achieve this objective, it is imperative to understand the genetics of resistance to this disease; therefore, the inheritance of ascochyta blight resistance has been studied extensively (Singh & Reddy Reference Singh and Reddy1983; Tekeoglu et al. Reference Tekeoglu, Santra, Kaiser and Muehlbauer2000; Bhardwaj et al. Reference Bhardwaj, Sandhu, Kaur, Gupta, Gaur and Varshney2009). The majority of authors consider the resistance to be a quantitative trait and several quantitative trait loci (QTL) have been identified in the chickpea genetic map (Santra et al. Reference Santra, Tekeoglu, Ratnaparkhe, Kaiser and Muehlbauer2000; Tekeoglu et al. Reference Tekeoglu, Rajesh and Muehlbauer2002; Rakshit et al. Reference Rakshit, Winter, Tekeoglu, Juarez Muñoz, Pfaff, Benko-Iseppon, Muehlbauer and Kahl2003; Udupa & Baum Reference Udupa and Baum2003; Cho et al. Reference Cho, Chen and Muehlbauer2004; Cobos et al. Reference Cobos, Rubio, Strange, Moreno, Gil and Millan2006; Iruela et al. Reference Iruela, Rubio, Barro, Cubero, Millán and Gil2006; Anbessa et al. Reference Anbessa, Taran, Warkentin, Tullu and Vandenberg2009; Kottapalli et al. Reference Kottapalli, Gaur, Katiyar, Crouch, Buhariwalla, Pande and Gali2009).
One of the most efficient tools for improving breeding populations for quantitative traits is phenotypic selection, where the frequency of favourable alleles is increased within a population over cycles of selection (Hallauer Reference Hallauer and Janick1992). Ascochyta blight is difficult to handle through conventional phenotypic selection (PS) because it is time-consuming to measure and depends on specific environmental factors that influence disease development. To transfer blight resistance successfully during cultivar development, breeders require both effective and efficient breeding methods. Marker-assisted selection (MAS) would be an ideal and reliable tool for facilitating selection. Successful use of MAS requires markers tightly linked to traits of interest. Molecular marker maps, the necessary framework for any MAS programme, have been constructed for chickpea. Quantitative trait loci for resistance to blight have been located and validated on linkage group four (LG4) (QTLAR1 and QTLAR2), LG2 (QTLAR3) and LG3 (QTLAR4) of the chickpea map using different mapping populations (Santra et al. Reference Santra, Tekeoglu, Ratnaparkhe, Kaiser and Muehlbauer2000; Tekeoglu et al. Reference Tekeoglu, Rajesh and Muehlbauer2002; Flandez-Galvez et al. Reference Flandez-Galvez, Ades, Ford, Pang and Taylor2003; Millan et al. Reference Millan, Rubio, Iruela, Daly, Cubero and Gil2003; Rakshit et al. Reference Rakshit, Winter, Tekeoglu, Juarez Muñoz, Pfaff, Benko-Iseppon, Muehlbauer and Kahl2003; Udupa & Baum Reference Udupa and Baum2003; Cho et al. Reference Cho, Chen and Muehlbauer2004; Cobos et al. Reference Cobos, Rubio, Strange, Moreno, Gil and Millan2006; Iruela et al. Reference Iruela, Rubio, Barro, Cubero, Millán and Gil2006, Reference Iruela, Castro, Rubio, Cubero, Jacinto, Millán and Gil2007; Tar'an et al. Reference Tar'an, Warkentin, Tullu and Vandenberg2007; Anbessa et al. Reference Anbessa, Taran, Warkentin, Tullu and Vandenberg2009; Kottapalli et al. Reference Kottapalli, Gaur, Katiyar, Crouch, Buhariwalla, Pande and Gali2009; Aryamanesh et al. Reference Aryamanesh, Nelson, Yan, Clarke and Siddique2010). These facts make the incorporation of MAS for ascochyta blight resistance into breeding programmes a tool that would greatly accelerate the development of new chickpea cultivars.
The use of MAS for introgression of major QTL for disease resistance is increasingly being used in crop improvement. Simulation studies have examined the potential role for MAS in breeding programmes (Hospital et al. Reference Hospital, Moreau, Lacourdre, Charcosset and Gallais1997; Knapp Reference Knapp1998; Charmet et al. Reference Charmet, Robert, Perretant, Gay, Sourdille, Groos, Bernard and Bernard1999; Moreau et al. Reference Moreau, Lemarié, Charcosset and Gallais2000) and have shown that in some circumstances the adoption of MAS has the ability to improve selection efficiency over PS alternatives. However, the studies mentioned above considered the application of MAS on a theoretical basis in an attempt to characterize the ‘global’ improvements that MAS may provide to breeding. Although specific issues such as population size, gene action and trait heritability were investigated, the authors did not consider the application of MAS in a specific germplasm pool, interacting with particular environments and selection regimes (Kuchel et al. Reference Kuchel, Ye, Fox and Jefferies2005). Besides improving genetic gain, MAS is also useful for accelerating the breeding process and reducing the costs of a breeding programme through reductions in the number of years required and in the breeding population size (Yousef & Juvik Reference Yousef and Juvik2001; Thomas Reference Thomas2003).
Most cultivars of chickpea are the results of conventional plant breeding programmes, where trait evaluation and PS under field or greenhouse conditions are the routine procedure. With the advent of molecular markers and genetic maps there has been an increased interest in the use of marker technology to facilitate chickpea crop improvement. Molecular markers have been used for identification and mapping of genes and QTL for agriculturally important traits in chickpea. However, the extent to which markers have been employed in chickpea programmes has not been clearly determined. In the current study, the utility of available markers for use in MAS in chickpea breeding programmes to select ascochyta blight resistant genotypes was examined. In addition, MAS and PS were employed to select blight resistant chickpea genotypes comparing the effectiveness of both methods.
MATERIALS AND METHODS
Plant material
A chickpea F2:3 population of 650 families derived from the intra-specific cross ILC3279×WR315, resistant and susceptible to blight, respectively, provided the base population and the genetic information for the current study.
Phenotypic selection for reaction to ascochyta blight
Six hundred and fifty F2:3 families were sown in Córdoba (Southern Spain; 37°51′N, 4°48′W, 117 m asl) in 2007 in single rows of 1·5 m length with 20 plants per row and 0·3 m between rows. The lines were distributed in 11 blocks, which included the parental lines, in replicate rows. Single rows of a susceptible cultivar (cvar Blanco Lechoso) were sown every four rows and, additionally, rows of the susceptible cultivar were sown around the experimental field to enhance natural disease infection and its uniformity. Natural inoculum was supplemented by spreading infected chickpea debris, collected from previous years. After inoculation, the field was sprinkle-irrigated frequently to maintain a moist environment favourable for disease development. Disease reaction of each F3 family, parents and susceptible cultivar was evaluated using a rating scale of 1 (highly resistant) to 9 (highly susceptible) based on the severity of the infection on leaves, stems and pods as proposed by Singh et al. (Reference Singh, Hawtin, Nene and Reddy1981). Plants were scored weekly for four consecutive weeks starting from the time at which the susceptible control showed disease symptoms. The four scores were used to calculate the area under the disease progress curve (AUDPC) of each line (Campbell & Madden Reference Campbell and Madden1990). The AUDPC was subjected to analysis of variance (ANOVA). The early generation testing method of F2-derived lines (Fehr Reference Fehr1987) was used for resistance selection: F2:4 and F2:5 families derived from blight resistant F2:3 and F2:4 families, respectively, were then screened in field trials during 2008 and 2009 as described above. In order to identify the pathotype infecting the field experiments, the chickpea differential lines ILC482 (resistant to pathotype I and susceptible to pathotype II), and ICC3996 (resistant to pathotypes I and II) reported by Chen et al. (Reference Chen, Coyne, Peever and Muehlbauer2004) were included.
Evaluation for ascochyta blight (pathotype I) under controlled conditions
In order to find out a differential reaction to ascochyta blight pathotypes, the resistant F2:3 families selected in the field were evaluated for pathotype I reaction under controlled conditions in a growth chamber. Three pots per line with five plants each were distributed randomly in trays, which included pots of parents (ILC3279, WR315) and differential lines (cvar Blanco Lechoso, ILC482, ICC3996) as controls. When the plants reached the four leaflet stage (2-week-old plants) they were inoculated by spraying with a spore suspension (2×10⁵ spores/ml; 5 ml/plant) of the pathotype I isolate AR19, kindly provided by Dr. W. Chen (USDA/ARS, Pullman, WA, USA). They were incubated at high humidity (100%) and 20 °C in the dark for 24 h before transferring to the growth chamber (20 °C; 12 h day; 12 h night; 100% relative humidity). Disease evaluation started at the time at which the first disease symptoms appeared (10 days after inoculation) and were scored weekly for three consecutive weeks according to the rating scale of Singh et al. (Reference Singh, Hawtin, Nene and Reddy1981), as described earlier. Disease severity was assessed using the rating scale and the final data was subjected to ANOVA.
Marker-assisted selection
Marker-assisted selection for ascochyta blight was based on segregation of nine previously reported markers linked to QTL associated with resistance to blight (Udupa & Baum Reference Udupa and Baum2003; Cho et al. Reference Cho, Chen and Muehlbauer2004; Cobos et al. Reference Cobos, Rubio, Strange, Moreno, Gil and Millan2006; Iruela et al. Reference Iruela, Rubio, Barro, Cubero, Millán and Gil2006, Reference Iruela, Castro, Rubio, Cubero, Jacinto, Millán and Gil2007; Aryamanesh et al. Reference Aryamanesh, Nelson, Yan, Clarke and Siddique2010; Madrid et al. Reference Madrid, Chen, Rajesh, Castro, Millan and Gil2013).
For DNA extraction, c. 100 mg of young leaf tissue was excised, frozen immediately in liquid nitrogen and stored at −80 °C; DNA was isolated using DNAzol® (Invitrogen). In order to study the fixation of alleles associated with resistance to blight in the F2:5, the DNA isolation of these lines was carried out on a mix of equal proportions of five plants per line.
The F2 population (n=650) and the F2:5 resistant lines (n=55) were genotyped for the markers CaETR and sequence tagged microsatellite site (STMS) GAA47 linked to QTLAR1, STMS TA72 and the sequence characterized amplified region (SCAR) SCY17 and SCM02 to QTLAR2 both on LG4, the STMS TA194, TS82 and TR58 to QTLAR3 on LG2 and TA142 to QTLAR4 on LG3. The SCAR primer sequences and amplification conditions employed were those described by Iruela et al. (Reference Iruela, Rubio, Barro, Cubero, Millán and Gil2006). The amplified products were separated on 2·5% agarose gel and stained with ethidium bromide. Amplification and separation of the primer CaETR were carried out as in Madrid et al. (Reference Madrid, Chen, Rajesh, Castro, Millan and Gil2013) while the STMS primers were combined in a multiplex PCR, with amplification and PCR product separation performed as in Castro et al. (Reference Castro, Rubio, Cabrera, Millan and Gil2011). The results were analysed using the Genotyper software (v 3.7, Applied Biosystems, Paisley, UK).
Segregation of markers in the F2 population was analysed for goodness-of-fit to the expected Mendelian ratio of 1 :2 : 1 for co-dominant markers and 3 : 1 for the dominant marker SCM02 using the Chi-square test. At each locus, the allele from ILC3279 was denoted as ‘a’, whereas that from WR315 was denoted as ‘b’. The magnitude of the marker-associated phenotypic effect was described by the coefficient of determination (R 2), which is the fraction of the total variance accounted for the marker genotypes.
Analysis of costs of phenotypic selection and marker-assisted selection
The costs of carrying out PS and MAS were calculated using a spreadsheet-based budgeting approach. First, all field operations involved in growing and evaluating chickpea for ascochyta blight resistance were identified, as well as all laboratory procedures required for MAS. Next, information about the quantities of inputs required for each operation or procedure, the cost of those inputs, and the time needed to complete each operation or procedure were collected. Based on this information, cost estimates were derived for field operations and laboratory procedures (Dreher et al. Reference Dreher, Khairallah, Ribaut and Morris2003). The cost estimates along with the time needed to carry out each selection method were employed to compare the cost-effectiveness of MAS relative to PS and propose a strategy for breeding programmes.
RESULTS
Phenotypic selection for reaction to ascochyta blight
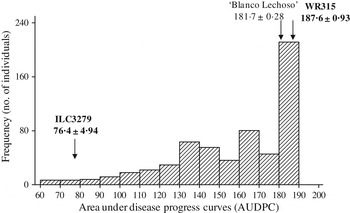
The frequency distribution of the disease reaction of the F2:3 population to ascochyta blight was skewed towards the susceptible parental line (WR315) (Fig. 1). Mean AUDPC of the susceptible parent (187·60±0·93) was higher than that of the susceptible cultivar Blanco Lechoso (181·73±0·28) and the resistant parent (ILC3279) had an average score of 76·4±4·94 (Fig. 1). However, the susceptible cultivar had a score of 9 and the parental lines ILC3279 and WR315 had scores of 3 and 9, respectively. Eight F2:3 families showed a score of 3 (resistant), 12 were considered as tolerant having scores of 5 and the remaining 579 F2:3 families were considered as susceptible, with scores ⩾7. These results suggested that resistance to ascochyta blight was recessive in this population. During the selection process, some resistant plants were observed within the row of susceptible families and were also selected. Therefore, a total of 58 families were selected to be evaluated for ascochyta blight in the field during 2008. Only three out of the 58 F2:4 families showed scores ⩾7. The remaining had scores ⩽5, confirming their resistance to blight. When the data from evaluations carried out on the F2:3 and F2:4 families were compared, all the families except two held or decreased their score and AUDPC. The susceptible cultivar Blanco Lechoso had a similar average AUDPC in both evaluations (181·73±0·28 and 182·54±0·96, respectively), indicating that disease severity was similar in both years. Therefore, the decrease of the mean of score and AUDPC values from the F2:3 population (8·54±0·04 and 156·52±1·19, respectively) to the F2:4 population (3·72±0·16 and 68·07±2·44, respectively) means that PS was effective and selection gain had occurred.
Frequency distribution of reaction to ascochyta blight in the F2:3 population from the cross ILC3279×WR315.

The progenies of the F2:4 families (families F2:5) were also evaluated for blight in 2009. Resistance was confirmed for all of them, having scores ⩽5. Therefore, as a result of the PS, 55 F2:5 families resistant to blight were selected.
In order to determine the most probable pathotype of ascochyta infesting the field experiments, the differential lines ICC3996 (resistant to pathotypes I and II), ILC482 (resistant to pathotype I and susceptible to II) together with the control cultivar Blanco Lechoso (susceptible to both pathotypes) were evaluated in 2009, showing scores of 1, 5 and 9, respectively. However, it was not possible to determine the most frequent pathotype present in the field because ILC482 did not show a clear-cut reaction.
Marker-assisted selection for ascochyta blight resistance
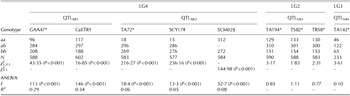
All F2 individuals (n=650) were genotyped with nine markers previously associated with ascochyta blight resistance (Table 1). The markers located on LG4 and linked to QTLAR1 (GAA47 and CaETR) and QTLAR2 (TA72, SCY17 and SCM02) showed segregation ratios that deviated from the expected 1 :2 : 1 and 3 : 1 ratios for co-dominant and dominant marker, respectively, in an F2 population (P<0·001). All these markers presented a high number of genotypes with alleles from the susceptible parent (bb). The STMS located on LG2 (TA194, TS82 and TR58) and linked to QTLAR3 and on LG3 (TA142) linked to QTLAR4 fitted the expected 1 :2 : 1 segregation.
Genotypic segregation of the molecular markers linked to quantitative trait loci (QTL) associated with the resistance to ascochyta blight in a F2 population of chickpea (n=650) from the cross ILC3279×WR315

* STMS markers.
† Allele specific co-dominant marker.
‡ SCAR co-dominant marker.
§ SCAR dominant marker.
a and b, alleles associated with the resistance and susceptibility, respectively.
R 2: proportion of the total phenotypic variation explained by the marker.
The one-way ANOVA co-segregation analysis showed significant association (P<0·001) between the markers linked to QTLAR1 and QTLAR2 and ascochyta blight resistance (Table 1). The phenotypic variation explained by the markers (R 2) ranged from 0·05 to 0·34, with CaETR and GAA47 showing the highest values. According to the AUDPC frequency distribution and marker data, most of the homozygous lines for the allele a in the markers CaETR (n=117) and GAA47 (n=96) exhibited AUDPC values (mean=123·7±3·15) close to the resistant parental line ILC3279. The homozygous lines for the allele b, present in the susceptible genotype WR315, had highest values of AUDPC (mean=172·6±1·25). However, the markers linked to QTLAR3 (TA194, TS82 and TR58) and QTLAR4 (TA142) were not associated with resistance (Table 1).
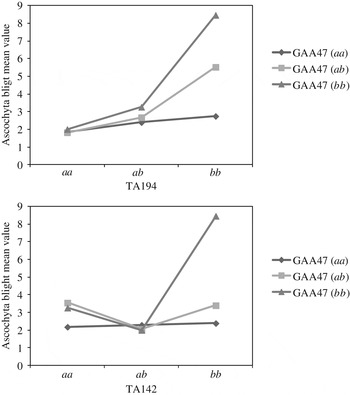
The evaluation for pathotype I (AR19) under controlled conditions of the 58 resistant F2:3 selected showed significant differences among families (P<0·001), signifying variation in their reaction to pathotype I. About 0·72 of the families were resistant, having average scores ⩽3. The parents (ILC3279, WR315) and the differential lines (ILC482, ICC3996, cvar Blanco Lechoso) had average scores of 1, 8·2, 1·4, 1·5 and 6·9, respectively, confirming the reactions previously described (Udupa et al. Reference Udupa, Weigand, Saxena and Kahl1998; Chen et al. Reference Chen, Coyne, Peever and Muehlbauer2004). Significant association between the markers linked to QTLAR1, QTLAR3 and QTLAR4 and disease reaction was found (P<0·05, P<0·001 and P<0·05, respectively), with TA194 being the marker explaining the highest proportion of the phenotypic variation (R 2=0·30) for pathotype I resistance (Table 2). In addition, the marker GAA47 showed significant interaction with TA194 (P<0·001) and TA142 (P<0·01). When the interaction was analysed, in order to be resistant to pathotype I, the individuals should have at least one of the alleles of the markers TA194, TA142 and GAA47 present in the resistant parent (Fig. 2). For CaETR, the interaction could not be analysed because there was only one homozygous line for the allele b and it was impossible to get data of the combination of this genotype with the three of TA194 or TA142 (aa, ab and bb). Nevertheless, the results from the evaluation for pathotype I under controlled conditions should be validated in a bigger population.
Interaction of the marker GAA47 with both TA194 and TA142 in the lines evaluated for ascochyta blight (pathotype I).  , homozygous lines for the allele present in the resistant parent (aa) for the marker GAA47;
 , heterozygous lines (ab) for the marker GAA47;
 , homozygous lines for the allele present in the susceptible parent (bb) for the marker GAA47.

F values from variance analysis of disease reaction to blight (pathotype I) as disease severity among F2 chickpea genotypes from the cross ILC3279×WR315 classified according to different molecular markers associated with the resistance to ascochyta blight, and evaluated under controlled conditions through their F2:3 lines

* STMS markers.
† Allele specific co-dominant marker.
‡ SCAR co-dominant marker.
§ SCAR dominant marker.
R 2, determination coefficient of genotype effect as proportion of the total phenotypic variation.
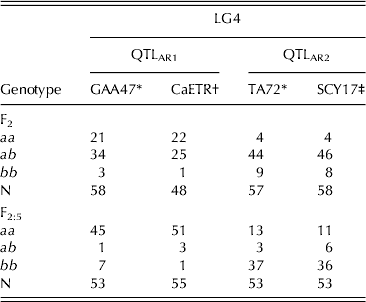
The segregation of the co-dominant markers located on LG4, linked to QTLAR1 and QTLAR2 and associated with the resistance to blight in the field in the current study, showed that most of the 58 resistant F2:3 lines selected were derived from heterozygous (ab) F2 plants (Table 3). These markers were also employed to analyse the F2:5 families and showed increased homozygosity in these lines (Table 3). Specifically, most of the F2 that were heterozygous for the markers GAA47 and CaETR were homozygous for the allele associated with the resistance in the F2:5 generation. In contrast, only 0·20 of the F2 that were heterozygous for the markers TA72 and SCY17 were homozygous for the allele associated with the resistance in the F2:5 generation (Table 3). These results suggest that the alleles associated with the resistance linked to QTLAR1 were fixed in the F2:5. However, the alleles associated with the resistance linked to QTLAR2 were not fixed, probably because of the distorted segregation towards the susceptible parent line found in this material.
Segregation of co-dominant molecular markers on LG4 associated with the resistance to ascochyta blight in a set of selected resistant lines of chickpea (F2 and F2:5) derived from the cross ILC3279×WR315

* STMS markers.
† Allele specific co-dominant marker.
‡ SCAR co-dominant marker.
a and b, alleles associated with the resistance and susceptibility, respectively.
Analysis of phenotypic selection and marker-assisted selection costs
Phenotypic selection
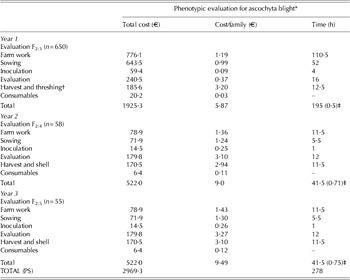
In order to develop highly resistant genotypes, several generations of ascochyta blight phenotyping and selection are normally required. Thus, the total cost of PS carried out in the current study included the evaluation of the F2:3 (n=650), F2:4 (n=58) and F2:5 (n=55) generations. Costs incurred during the three cycles of selection were estimated at €1925·3, €522 and €522, respectively (Table 4), with labour accounting for the largest proportion of total field costs.
Costs and time employed to carry out the phenotypic selection (PS) for ascochyta blight from F2:3 to F2:5 populations of chickpea

* It includes all field operations involved in growing and evaluating chickpea for ascochyta blight resistance but excludes extra field space/cost and cost of other research staff involved in the breeding program over 3 years.
† Harvesting only resistant material (n=58).
‡ Between brackets, total time employed by family as h/family.
Marker-assisted selection
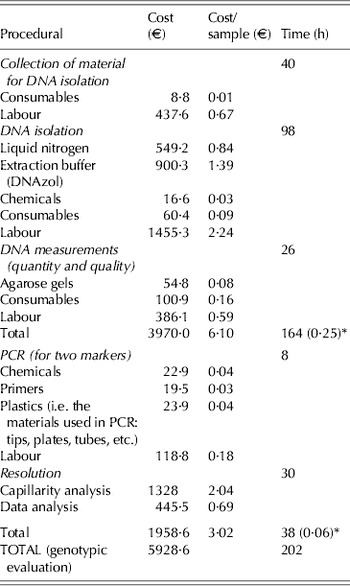
One of the main factors affecting the success of MAS is the reliability of the markers. Therefore, only the markers most tightly linked to ascochyta blight resistance (CaETR and TA72) were employed to calculate the cost of MAS in the current study.
Marker analysis involved several steps. First, leaf samples were harvested and the DNA was extracted. After being quantified, the DNA was PCR-amplified using specific primers linked to ascochyta blight resistance. The resulting fragments were then separated, and the DNA banding patterns were recorded. Finally, the recorded data were analysed. The costs of supplies and labour required to perform these tasks are shown in Table 5.
Costs and time employed to carry out the genotypic evaluation in a F2 population (n=650) of chickpea

* Total time employed per sample (h/sample).
When the costs of PS and MAS for ascochyta blight resistance were compared, the cost of MAS (€5928·6) was higher than for PS (€2969·3). Time requirements are also important, since plant breeders often want results quickly. PS for ascochyta blight resistance in the current study took a total of 278 h, distributed over 3 years, whereas results using MAS were obtained in only 1 year (202 h).
DISCUSSION
Although the use of MAS is most straightforward for manipulating single-gene traits, its potential for breeding complex traits has also been recognized (Bouchez et al. Reference Bouchez, Hospital, Causse, Gallais and Charcosset2002; Lecomte et al. Reference Lecomte, Duffé, Buret, Servin, Hospital and Causse2004). However, it should be noted that the use of markers for polygenic trait improvement remains difficult, with few success stories reported to date (Ribaut & Hoisington Reference Ribaut and Hoisington1998; Young Reference Young1999; Crouch Reference Crouch2001). MAS has been reported previously as being more (Yousef & Juvik Reference Yousef and Juvik2001; Fazio et al. Reference Fazio, Chung and Staub2003; Abalo et al. Reference Abalo, Tongoona, Derera and Edema2009), equal (Willcox et al. Reference Willcox, Khairallah, Bergvinson, Crossa, Deutsch, Edmeades, Gonzalez-de-Leon, Jiang, Jewell, Mihm, Williams and Hoisington2002) or less effective (Hoeck et al. Reference Hoeck, Fehr, Shoemaker, Welke, Johnson and Cianzio2003; Lu et al. Reference Lu, Bernardo and Ohm2003) than PS to increase the genetic gain. In chickpea, efforts have been made to find those markers tightly linked to genes controlling qualitative and quantitative traits of interest. Nevertheless, the employment of MAS in conventional breeding programmes has not yet been reported. The current study has analysed the efficiency and effectiveness of a set of markers linked to ascochyta blight resistance to be used in conventional breeding.
The results of the phenotypic evaluations for ascochyta blight resistance carried out in the F2:3 showed a continuous distribution, confirming the quantitative control of this trait as reported previously (Santra et al. Reference Santra, Tekeoglu, Ratnaparkhe, Kaiser and Muehlbauer2000; Flandez-Galvez et al. Reference Flandez-Galvez, Ades, Ford, Pang and Taylor2003; Udupa & Baum Reference Udupa and Baum2003; Cho et al. Reference Cho, Chen and Muehlbauer2004; Cobos et al. Reference Cobos, Rubio, Strange, Moreno, Gil and Millan2006; Iruela et al. Reference Iruela, Rubio, Barro, Cubero, Millán and Gil2006, Reference Iruela, Castro, Rubio, Cubero, Jacinto, Millán and Gil2007; Lichtenzveig et al. Reference Lichtenzveig, Bonfil, Zhang, Shtienberg and Abbo2006; Anbessa et al. Reference Anbessa, Taran, Warkentin, Tullu and Vandenberg2009). The distribution was biased towards the susceptible parental line, indicating that the resistance could be recessive in the material employed in the current study. However, the highly distorted segregation towards the susceptible parent detected on LG4 could also explain the phenotype distribution of resistance. Danehloueipour et al. (Reference Danehloueipour, Yan, Clarke and Siddique2007) and Bhardwaj et al. (Reference Bhardwaj, Sandhu, Kaur, Gupta, Gaur and Varshney2009) reported the resistance to blight to be recessive. Bhardwaj et al. (Reference Bhardwaj, Sandhu, Kaur, Gupta, Gaur and Varshney2009), using a F2 population derived from a cross where GL90168 was the resistant parent, also found the resistance to be dominant. Therefore, the dominant or recessive nature of blight could depend on the source of resistance employed and/or the existence of distorted segregation in the region where the gene or QTL of interest is located. So the use of markers tightly linked to these genes or QTL would be useful to elucidate these issues. It is well known that MAS can help breeders to increase selection efficiency, precision, selection intensity and selection of favourable combinations of genes in early generations, resulting in increased genetic gain. Besides, it is more cost-effective than PS, where phenotypic screening is difficult. However, before using a marker for the selection of desirable plants in segregating generations, verification of the target QTL for its magnitude of effects and accurate chromosomal location are very important to realize the potential of MAS (Liu et al. Reference Liu, Zhu and Lu2004). It has been reported that only QTL showing major and consistent effect across the environments should be involved in MAS (Liu et al. Reference Liu, Mu, Zhang, Wang, Qu and Li2006). In the current study, four QTL associated with ascochyta blight resistance located on LG2 (QTLAR3), LG3 (QTLAR4) and LG4 (QTLAR1, QTLAR2) of the chickpea genetic map have been analysed. These four QTL have been validated across different environments and materials (Tekeoglu et al. Reference Tekeoglu, Rajesh and Muehlbauer2002; Udupa & Baum Reference Udupa and Baum2003; Iruela et al. Reference Iruela, Rubio, Barro, Cubero, Millán and Gil2006, Reference Iruela, Castro, Rubio, Cubero, Jacinto, Millán and Gil2007; Tar'an et al. Reference Tar'an, Warkentin, Tullu and Vandenberg2007; Anbessa et al. Reference Anbessa, Taran, Warkentin, Tullu and Vandenberg2009; Kottapalli et al. Reference Kottapalli, Gaur, Katiyar, Crouch, Buhariwalla, Pande and Gali2009; Aryamanesh et al. Reference Aryamanesh, Nelson, Yan, Clarke and Siddique2010). It was found that QTLAR1, QTLAR2 and QTLAR3 explained 0·34, 0·21 and 0·23 of phenotypic variation, respectively, in a recombinant inbred line population derived from the same parental lines as those employed in the current study (Iruela et al. Reference Iruela, Rubio, Barro, Cubero, Millán and Gil2006, Reference Iruela, Castro, Rubio, Cubero, Jacinto, Millán and Gil2007). In a different population, QTLAR4 explained 0·21 of the phenotypic variation (Aryamanesh et al. Reference Aryamanesh, Nelson, Yan, Clarke and Siddique2010). According to the results of the present study, QTLAR1 (indicative markers CaETR and GAA47) and QTLAR2 (indicative markers TA72 and SCY17) control resistance in the population. Phenotypic selection in F2:4 and F2:5 generations lead to an increase in the frequency of the allele associated with the resistance of the markers CaETR and GAA47, verifying the usefulness of these markers for MAS. Nevertheless, the frequency of the allele associated with the resistance did not increase for the markers TA72 and SCY17. These two markers could be also useful for MAS but the highly distorted segregation towards the susceptible parent in the region where QTLAR2 is located could explain the low effectiveness of TA72 and SCY17. Therefore, it would be interesting to test the effectiveness of these markers in populations where the distorted segregation is not present. However, it would be recommended to use these markers together with CaETR or GAA47 to select genotypes resistant to blight in chickpea breeding programmes. In fact, it has been reported recently that using the markers CaETR and SCY17 simultaneously, it is possible to correctly predict 0·90 of accessions previously reported as resistant according to their phenotypic reaction (Madrid et al. Reference Madrid, Chen, Rajesh, Castro, Millan and Gil2013).
In contrast, the null effect of QTLAR3 and QTLAR4 on resistance under field evaluation could be related to the absence or low levels of A. rabiei pathotype I in the field plot. Udupa & Baum (Reference Udupa and Baum2003), using the same resistant parent (ILC3279) as employed in the current study, identified a gene located on LG2 that confers resistance to pathotype I. Cho et al. (Reference Cho, Chen and Muehlbauer2004), using FLIP84-92 as source of resistance, described also one gene located on LG2 linked to pathotype I resistance. Later, Iruela et al. (Reference Iruela, Castro, Rubio, Cubero, Jacinto, Millán and Gil2007) reported QTLAR3 tightly linked to the marker TA194. For QTLAR4, Tar'an et al. (Reference Tar'an, Warkentin, Tullu and Vandenberg2007) detected a QTL on LG3 that confers resistance to a monosporic isolate from Canada. Later, Aryamanesh et al. (Reference Aryamanesh, Nelson, Yan, Clarke and Siddique2010) located on the same LG3 a QTL closely linked to TA142 marker using an unspecific isolate from Australia. The interaction of GAA47 with both TA194 and TA142 found in the current study suggests that the resistance to pathotype I could be conferred by either QTLAR1 located on LG4 or QTLAR3 located on LG2 or QTLAR4 on LG3. Therefore, QTLAR1 could play an important role in the resistance to ascochyta blight because of their involvement in the resistance to several pathotypes. Based on the current results, use of the markers TA194 and TA142 would also be recommended to select resistant genotypes to blight by MAS. However, QTLAR4 was only detected under controlled conditions and the association between the marker linked to QTLAR4 (TA142) and the resistance to pathotype I was slightly significant. So that, the importance of this minor QTL should be validated in a bigger population. However, it should be noted that TA194 and GAA447 are microsatellites, and these markers are described as having extensive polymorphism within species because mutations in the size and number of repeating microsatellite units are frequent. This makes the prediction of resistance alleles with STMS markers more difficult than with specific markers. Hence, the use of STMS markers is not recommended for screening of germplasm collections (Collard et al. Reference Collard, Jahufer, Brouwer and Pang2005) if the resistant parent is unknown.
The efficiency of any breeding method is usually measured in terms of genetic gain over time (Fehr Reference Fehr1987) and relative cost (Ragot & Hoisington Reference Ragot and Hoisington1993). However, the choice between MAS and PS will involve a trade-off between money and time (Morris et al. Reference Morris, Dreher, Ribaut and Khairallah2003). The current study has presented costs associated with PS and MAS for ascochyta blight resistance during three cycles of selection, showing that MAS was more expensive than PS. However, the use of markers reduced the time taken to select resistant lines. In addition, the distorted segregation towards the susceptible parental found in the current study should be taken into account. In a population segregating according to the Mendelian ratios, the number of resistant lines selected would be higher increasing the cost of PS. However, a high proportion of the cost of MAS is due to the cost of DNA isolation. Nevertheless, the employment of new procedural modifications and equipment that have the potential to reduce the cost of DNA isolation can reduce the total costs of MAS. According to the results, applying PS for a complex trait such as resistance to ascochyta blight only retains QTL related to pathotypes prevalent in the field where the evaluations are carried out. However, MAS makes it possible to ‘pyramid’ genes or QTL related to different pathotypes. In addition, MAS using co-dominant markers allows one to select homozygous genotypes and to fix them in early generations. In the 117 F2 homozygous plants for QTLAR1 (indicative marker CaETR) obtained in the current study, only 22 were phenotypically selected as resistant through their F2:3 families. This could be due to the presence of different QTL conferring resistance or/and environmental effects. In this sense, the use of markers linked to QTLAR2 it is also suggested, although their effectiveness in the current study has been reduced because of the highly distorted segregation towards the susceptible parent. Thus, according to the results presented in the current work, the use of MAS in combination with PS has shown to be more fruitful for complex traits such as ascochyta blight because genotypic selection could help to retain other QTL with differential expression and to select loci involved in epistatic interactions.
In conclusion, the results suggest that the markers employed in the current study are useful to select genotypes resistant to ascochyta blight in chickpea breeding programmes. Nevertheless, in order to increase the efficiency of MAS, it would be interesting to look for diagnostic markers; MAS efficiency could also be further increased using new technologies that lead to cost-savings. The most efficient strategy cannot be determined based on costs alone but on cost : benefit ratios. Relative cost and benefits will depend on a number of factors that will change over time and will vary from one breeding programme to another. According to the current results, it is recommended that MAS should be used for the four QTL analysed in the current study in the early generations (F2) of chickpea breeding programmes, because this makes it possible to develop populations with a high frequency of the alleles favourable for resistance to blight.
The first author acknowledges grant support from INIA and IFAPA (Spain). This work was supported by the Spanish Ministerio de Ciencia e Innovación (MICINN); project RTA2010-00059 financed in part by EU funds (ERDF). The authors are also grateful for support received from the University of Cordoba, member of the Agrifood Campus of International Excellence (ceiA3).