





Introduction
Gambling disorder (GD), classified as a behavioral addiction in DSM-5, is characterized by persistent maladaptive gambling behavior that inflicts substantial personal, familial, and societal harms (American Psychiatric Association, 2013; Calado & Griffiths, Reference Calado and Griffiths2016). A defining feature is ‘chasing losses’, a behavioral pattern tightly linked to abnormal processing of loss feedback during decision-making (Balconi, Finocchiaro, & Canavesio, Reference Balconi, Finocchiaro and Canavesio2015; Bonnaire et al., Reference Bonnaire, Devos, Barrault, Grall-Bronnec, Luminet and Billieux2022; Giustiniani et al., Reference Giustiniani, Nicolier, Maylié, Pazart, Haffen and Gabriel2024; Mallorquí-Bagué et al., Reference Mallorquí-Bagué, Vintró-Alcaraz, Verdejo-García, Granero, Fernández-Aranda, Magaña, Mena-Moreno, Aymamí, Gómez-Peña, del Pino-Gutiérrez, Mestre-Bach, Menchón and Jiménez-Murcia2019; Takeuchi et al., Reference Takeuchi, Kawada, Tsurumi, Yokoyama, Takemura, Murao, Murai and Takahashi2016; Zhang & Clark, Reference Zhang and Clark2020). However, neurophysiological studies investigating this core cognitive process have yielded inconsistent results (Banerjee, Chen, Clark, & Noël, Reference Banerjee, Chen, Clark and Noël2023; Dores et al., Reference Dores, Peixoto, Fernandes, Geraldo, Griffiths and Barbosa2025; Giustiniani et al., Reference Giustiniani, Nicolier, Maylié, Pazart, Haffen and Gabriel2024; Lee et al., Reference Lee, Park, Kim, Kim, Choi, Kwon and Choi2017), with some reporting blunted (Balconi, Finocchiaro, & Canavesio, Reference Balconi, Finocchiaro and Canavesio2015; Balodis et al., Reference Balodis, Linnet, Arshad, Worhunsky, Stevens, Pearlson and Potenza2018; Luijten et al., Reference Luijten, Schellekens, Kühn, Machielse and Sescousse2017; Takeuchi et al., Reference Takeuchi, Tsurumi, Murao, Takemura, Kawada, Urayama, Aso, Sugihara, Miyata, Murai and Takahashi2017) and others heightened neural sensitivity to loss in GD (Brevers, Koritzky, Bechara, & Noël, Reference Brevers, Koritzky, Bechara and Noël2014; Giustiniani et al., Reference Giustiniani, Nicolier, Maylié, Pazart, Haffen and Gabriel2024; Kryza-Lacombe et al., Reference Kryza-Lacombe, Abram, Potenza, Mackin, Lau, Nicholas, Ford, Batki, Mathalon and Fryer2026; Oberg, Christie, & Tata, Reference Oberg, Christie and Tata2011). This inconsistency is increasingly attributed to the pronounced clinical heterogeneity of GD, which presents a significant barrier to understanding its neurocognitive mechanisms.
The Pathways Model of problem and pathological gambling links gambling heterogeneity to different developmental pathways, including behaviorally conditioned, emotionally vulnerable, and antisocial-impulsivist pathways, with negative affect and impulsivity serving as key dimensions for distinguishing clinically meaningful gambling subgroups (Blaszczynski & Nower, Reference Blaszczynski and Nower2002; Nower, Blaszczynski, & Anthony, Reference Nower, Blaszczynski and Anthony2022). Consistent with this view, empirical studies have shown that trait impulsivity (Ledgerwood & Petry, Reference Ledgerwood and Petry2010; Zhong et al., Reference Zhong, Dong, Liu, Wei, Zhai, Hu and Du2025a) and elevated negative affect, including anxiety and depression (Lister, Milosevic, & Ledgerwood, Reference Lister, Milosevic and Ledgerwood2015; Szerman et al., Reference Szerman, Ferre, Basurte-Villamor, Vega, Mesias, Marín-Navarrete and Arango2020), are closely associated with clinical heterogeneity in GD. These features often co-occur in distinct patterns (Giustiniani et al., Reference Giustiniani, Nicolier, Maylié, Pazart, Haffen and Gabriel2024; Ledgerwood & Petry, Reference Ledgerwood and Petry2010; Lee et al., Reference Lee, Park, Kim, Kim, Choi, Kwon and Choi2017; Mestre-Bach et al., Reference Mestre-Bach, Granero, Fernández-Aranda, Potenza and Jiménez-Murcia2022), suggesting the existence of types with different clinical trajectories and potentially distinct neurophysiological substrates. For instance, a primarily ‘impulsive’ type of GD may engage in gambling due to fundamental deficits in self-regulation (Zhong et al., Reference Zhong, Dong, Liu, Wei, Zhai, Hu and Du2025a). On top of this impulsive profile, some individuals also exhibit high levels of anxiety and depression (herein referred to as ‘emotionally vulnerable’) and may additionally use gambling to escape negative states (Goldstein & Volkow, Reference Goldstein and Volkow2011). Despite recognition of these profiles, it remains unknown whether they correspond to distinct neurophysiological patterns, particularly regarding the core cognitive deficit of loss feedback processing. Answering this question would thus help to resolve the seemingly inconsistent patterns concerning loss feedback processing in GD and reveal the neurophysiological phenotypic markers for the GD types.
The processing of loss feedback is commonly measured using event-related potentials (ERPs) such as the feedback-related negativity (FRN) and the feedback-P3. The FRN reflects an early, automatic evaluation of outcome valence (von Borries et al., Reference von Borries, Verkes, Bulten, Cools and de Bruijn2013), while the feedback-P3 indexes a later, more conscious appraisal of outcome significance (Polich, Reference Polich2007). Both are crucial for adaptive decision-making, enabling the integration of negative outcomes to guide future behavior, a process believed to be impaired in GD (Balconi et al., Reference Balconi, Finocchiaro and Canavesio2015; Dores et al., Reference Dores, Peixoto, Fernandes, Geraldo, Griffiths and Barbosa2025). The inconsistency in neurophysiological findings regarding loss feedback processing in GD may further be understood through the lens of theoretical models of addiction, such as the three-stage cycle (Koob & Volkow, Reference Koob and Volkow2010) and the I-PACE model (Brand et al., Reference Brand, Müller, Wegmann, Antons, Brandtner, Müller, Stark, Steins-Loeber and Potenza2025). These models posit a shift from positive reinforcement (chasing pleasure) to negative reinforcement (alleviating negative states) as addiction progresses. This suggests that the processing of negative outcomes (e.g. loss feedback) may be particularly aberrant in individuals who gamble primarily to escape aversive emotional states, the proposed ‘emotionally vulnerable’ type. Specifically, such blunting may be reflected in reduced FRN amplitudes, indicating impaired early automatic evaluation of loss outcomes, and in reduced feedback-P3 amplitudes, indicating diminished later attentional allocation and conscious appraisal of the significance of losses. Crucially, foundational research has established a general link between emotionality and feedback-processing. For instance, studies including Chiu and Deldin (Reference Chiu and Deldin2007) have shown abnormal neural responses to emotional stimuli in major depression, and Yang, Zhou, Gu, and Wu (Reference Yang, Zhou, Gu and Wu2020) demonstrated that induced negative affect can modulate the FRN component in healthy populations. These findings indicate that affective states broadly influence how feedback, especially negative feedback, is processed. Therefore, a critical question is whether the alleged deficit in loss feedback processing is a universal feature of GD or is it particularly salient in the emotionally vulnerable type, where pre-existing emotional disturbances and a motivation to gamble for negative reinforcement may interact to produce a distinct neurophysiological profile.
This study employed a data-driven approach to identify GD types based on impulsivity, anxiety, and depression. We recorded EEG during the Balloon Analogue Risk Task (BART), a sequential risk-taking task commonly used to assess risky decision-making and feedback (Andrews et al., Reference Andrews, Meda, Thomas, Potenza, Krystal, Worhunsky, Stevens, O’Malley, Book, Reynolds and Pearlson2011; Lejuez et al., Reference Lejuez, Read, Kahler, Richards, Ramsey, Stuart, Strong and Brown2002; Mishra, Lalumière, & Williams, Reference Mishra, Lalumière and Williams2010, Reference Mishra, Lalumière and Williams2017; Nurmi et al., Reference Nurmi, Laughlin, de Wit, Palmer, MacKillop, Cannon, Bilder, Congdon, Sabb, Seaman, McElroy, Libowitz, Weafer, Gray, Dean, Hellemann and London2023; Zhong et al., Reference Zhong, Liu, Wei, Wei, Zhang, Yang and Du2025b), to probe loss feedback processing. Based on the Pathways Model and existing clinical research on GD, we hypothesized that (1) cluster analysis would identify distinct ‘impulsive’ (IMP) and ‘emotionally vulnerable’ (EMV) types, with the latter showing greater gambling severity; (2) the EMV type would exhibit blunted FRN and feedback-P3 amplitudes to loss feedback compared to healthy controls (HC), while the IMP type would not; and (3) the association between blunted neural responses and gambling severity would be specific to the EMV type. Notably, the two classified types in this study do not correspond to the pure impulsive subtype and pure emotional subtype proposed in the Pathways Model. Our grouping is data-driven, categorizing samples based on core dominant characteristics. The emotionally vulnerable group also presents high impulsivity, which is a prevalent feature among clinical GD patients.
Methods
Participants and recruitment
This study recruited 120 male patients diagnosed with GD according to DSM-5 criteria (American Psychiatric Association, 2013) from the outpatient clinics of the Shanghai Mental Health Center. All GD participants underwent a structured clinical interview using the Chinese-adapted Structured Clinical Interview for DSM-5 (SCID-5-CV; First, Williams, Karg, & Spitzer, Reference First, Williams, Karg, Spitzer and Philips2020), with diagnoses confirmed by an experienced psychiatrist. A control group of 52 HC participants, who did not differ significantly from the GD group in age or education level, was recruited from the local community. All participants were right-handed adult males. Following exclusions due to poor EEG signal quality or an insufficient number of valid trials (<10 per condition), the final sample comprised 98 GD and 48 HC participants.
Inclusion criteria for the GD group required participants to be aged 18–65 years with a confirmed GD diagnosis. Exclusion criteria for all participants encompassed a history of traumatic brain injury, organic brain diseases, or lifetime diagnoses of major psychiatric comorbidities such as schizophrenia, psychotic disorders, substance use disorders, or bipolar disorder. HC participants were additionally screened to exclude any gambling habits, with a South Oaks Gambling Screen (SOGS; Zhou et al., Reference Zhou, Cui, Shi, Liu, Wei, Zhang and Du2025) score below 5. The study received ethical approval from the Shanghai Mental Health Center Ethics Committee (2022–18), and written informed consent was obtained from all participants after a detailed briefing.
Psychometric evaluation and clustering analysis
Standardized instruments were administered to assess the clinical profiles of all participants. Impulsivity traits were evaluated using the Barratt Impulsiveness Scale (BIS-11; Li et al., Reference Li, Phillips, Xu, Zhang, Yang, Tong, Wang and Niu2011), which measures three subdomains: attentional, motor, and non-planning impulsivity. Anxiety severity was assessed with the Generalized Anxiety Disorder-7 (GAD-7; Sun, Liang, Chi, & Chen, Reference Sun, Liang, Chi and Chen2021), and depression severity was measured via the Patient Health Questionnaire-9 (PHQ-9; Wang et al., Reference Wang, Bian, Zhao, Li, Wang, Du and Zhao2014). Gambling severity was evaluated using the SOGS (Zhou et al., Reference Zhou, Cui, Shi, Liu, Wei, Zhang and Du2025), and craving intensity was measured via a Visual Analogue Scale (VAS). All scales were administered in their validated Chinese versions, each demonstrating good to excellent internal consistency (Cronbach’s α range: 0.77–0.97). Detailed psychological assessment information is provided in the Supplementary File.
To identify GD types, a k-means clustering algorithm was applied to BIS-11, GAD-7, and PHQ-9 total scores. The optimal number of clusters was determined using the silhouette method, with scores >0.30 indicating acceptable cluster stability (Rousseeuw, Reference Rousseeuw1987).
Experimental tasks, Balloon Analogue Risk Task (BART)
Risky decision-making was assessed using the BART, a computerized paradigm in which participants seek to accumulate points by inflating a virtual balloon while avoiding explosions (Lejuez et al., Reference Lejuez, Read, Kahler, Richards, Ramsey, Stuart, Strong and Brown2002). Previous studies show that BART indices capture differences between GD and HC in risk-taking, exploration, and loss evaluation, and relate to impulsivity (Wei et al., Reference Wei, Zhong, Liu, Wei, Zhang, Yang and Du2026; Zhong et al., Reference Zhong, Liu, Wei, Wei, Zhang, Yang and Du2025b). The task was implemented following an established modified protocol (Lee & Yun, Reference Lee and Yun2014; Sehrig, Weiss, Miller, & Rockstroh, Reference Sehrig, Weiss, Miller and Rockstroh2019). Participants were required to complete 100 trials. On each trial, they could either pump the balloon (increasing potential reward) or cash out (securing accumulated points) (Figure 1). Each balloon had a random explosion threshold between 1 and 12 pumps. Participants had 3,000 ms to respond per decision; each successful pump earned 10 points, while an explosion resulted in the loss of all points for that trial.
Overview of the Balloon Analog Risk Task (BART) procedure. Each run began with an 800–1,200 ms presentation of a white fixation cross on the screen, followed by an image of a deflated (smallest size) balloon serving as the decision prompt. Participants had 3,000 ms to decide whether to pump up the balloon when the balloon appeared. Participants pressed the button ‘1’ to pump the balloon and the button ‘5’ to cash out. If no response was made within 3,000 ms, the balloon was automatically pumped. The interval between consecutive pumps was 400–600 ms with the fixation cross. Pumping the balloon either resulted in the display of the next larger balloon or, if the balloon exploded, a popped balloon image accompanied by a popping sound and a ‘0’ icon indicating the loss of accumulated earnings (loss feedback). Cash-out decisions led to the picture of the accumulated reward, together with the sound of a cash register. The next run started after an 800–1,200 ms interval.

Figure 1. Long description
A horizontal timeline at the top is divided into four segments. Red: Decision phase (less than 3,000 m s). Black: plus (400 to 600 m s). Red: Feedback phase (1,500 m s). Black: plus (800 to 1,200 m s).
The main flowchart below begins on the left with a small red balloon. A dashed red line labeled Decision leads to a fork with two options.
1. Pump: This path branches into two possibilities. The top branch shows a larger red balloon with a plus 10 label, which loops back to the initial small balloon. The middle branch shows a popped balloon labeled Loss.
2. Cash out: This path leads to a red balloon labeled Win.
Both the Loss and Win outcomes point to a final red balloon on the far right labeled New balloon, signifying the start of a new trial.
Consistent with the standard BART analytical procedures (Lejuez et al., Reference Lejuez, Read, Kahler, Richards, Ramsey, Stuart, Strong and Brown2002), the following behavioral metrics were derived: (a) the average number of pumps on trials that did not result in an explosion (adjusted pumps), (b) the total number of exploded balloons, and (c) the total points earned, with the latter serving as the primary outcome.
EEG recording and preprocessing
EEG data were acquired using a 64-channel Brain-Product system (Germany) arranged according to the international 10–20 system. Signals were amplified via a QuickAmp amplifier and digitized at a sampling rate of 1,000 Hz. The AFz electrode served as the ground electrode, and the FCz electrode was used as the online reference. Vertical electrooculogram activity was recorded from an electrode above the right eye to monitor ocular artifacts. Electrode impedances were maintained below 20 KΩ throughout the recording to ensure optimal signal quality.
EEG data were processed offline using EEGLAB software (Delorme & Makeig, Reference Delorme and Makeig2004). Data were downsampled to 500 Hz and filtered with a 0.1 Hz high-pass filter, a 30 Hz low-pass filter, and a 50 Hz notch filter. Ocular artifacts were corrected using independent component analysis (ICA). Trials with residual artifacts were removed by visual inspection.
Data were segmented into epochs from −500 to 1,000 ms relative to decision prompts and feedback onset, followed by baseline correction using the −500 to 0 ms window. To evaluate cognitive functions related to feedback processing, we used the FRN and feedback P3 as indices of sensitivity to win (cashout) and loss (balloon pop) feedback. The FRN was quantified at the Fz electrode using a condition-specific P2-N2 peak-to-peak approach (Gehring & Willoughby, Reference Gehring and Willoughby2002; Rodrigues et al., Reference Rodrigues, Müller, Paelecke, Wang and Hewig2024). Based on the grand-average waveforms for each feedback condition, the peak-search windows for the P2 and N2 were set at 180–280 and 250–350 ms, respectively, in the loss-feedback condition, and at 0–200 and 150–250 ms, respectively, in the win-feedback condition. To reduce the influence of single-point noise on peak measurement, P2 and N2 amplitudes were calculated as the mean voltage within a ±20 ms window centered on the identified peak latency (Rodrigues et al., Reference Rodrigues, Müller, Paelecke, Wang and Hewig2024). FRN amplitude was defined as the difference between the P2 and N2 amplitudes (Mushtaq, Wilkie, Mon-Williams, & Schaefer, Reference Mushtaq, Wilkie, Mon-Williams and Schaefer2016). The decision-P3 component was quantified as the peak positive amplitude between 200 and 350 ms post-decision at the Pz electrode (Munro et al., Reference Munro, Dywan, Harris, McKee, Unsal and Segalowitz2007). The feedback-P3 was defined as the peak positive amplitude at Cz within 200–500 ms after feedback (Polich, Reference Polich2007).
Statistical analysis
Statistical analyses were conducted using Statistica (StatSoft Europe, Hamburg, Germany) and R 4.2.0 (R Development Core Team) software. Demographic and clinical variables were compared between clusters using t-tests, Mann–Whitney U tests, or chi-square tests, as appropriate. For each group (HC, IMP, and EMV). One-way ANOVAs were used to compare measures across GD types and HC. Separate paired-samples t-tests were conducted to compare electrophysiological amplitudes between win and loss outcomes for each component of interest. ERP components were analyzed using mixed-model ANOVAs with Group and Feedback as factors. Correlation and moderation analyses were performed using linear regression models in R. A p-value of <0.05 was considered statistically significant.
Results
Identification of symptom-based types in gambling disorder
The k-means clustering algorithm applied to impulsivity (BIS-11), anxiety (GAD-7), and depression (PHQ-9) scores identified two distinct types within the GD cohort. The optimal two-cluster solution was validated by a silhouette score of 0.42 (the determination of the optimal number of clusters via the average silhouette method is provided in the Supplementary File). Based on their distinct profiles, we designated Cluster 1 as the ‘impulsivist type’ (IMP) (n = 44) and Cluster 2 as the ‘emotionally vulnerable type’ (EMV) (n = 54) for the remainder of this article.
Demographic, clinical, and behavioral comparisons
No significant differences were observed in age or years of education among the IMP, EMV, and HC groups (Table 1a). The IMP exhibited high impulsivity alongside minimal anxiety and depression symptoms (Table 1a). In contrast, the EMV demonstrated equally elevated impulsivity but with clinically severe levels of anxiety and depression (Table 1a). No significant differences were observed in craving intensity on the VAS, but the EMV reported significantly higher gambling severity on the SOGS compared to the IMP type (p = .043) (Table 1a). These profiles align with the impulsivist and emotionally vulnerable pathways theorized in the Pathways Model, confirming the clinical heterogeneity of GD.
Comparisons of demographic, clinical, behavioral, and neurophysiological measures among HC, IMP, and EMV of gambling disorder

Table 1. Long description
The table is divided into three sections.
Section a, Demographic and clinical characteristics, shows significant differences in B I S 11, P H Q 9, G A D 7, and S O G S scores. For B I S 11, E M V (91.78 plus or minus 13.11) and I M P (88.25 plus or minus 13.18) are significantly higher than H C (65.84 plus or minus 12.70). For P H Q 9 and G A D 7, the trend is E M V greater than I M P greater than H C.
Section b, B A R T performances, shows that H C had significantly higher total earnings (2633.62 plus or minus 307.73) compared to I M P and E M V. Number of explosions and adjusted pumps showed no significant differences.
Section c, E R P components in the B A R T, reveals that H C had significantly higher Feedback-loss F R N (3.74 plus or minus 2.47) and Feedback-loss P 3 amplitude (15.77 plus or minus 5.02) compared to the E M V group (2.21 plus or minus 2.16 and 13.02 plus or minus 4.47 respectively). Feedback-win F R N, Feedback-win P 3, and Decision P 3 amplitudes showed no significant differences across groups.
Note: HC, Health controls; IMP, impulsivist type of gambling disorder; EMV, emotionally vulnerable type of gambling disorder; VAS, Visual Analogue Scale (craving intensity); BIS-11, Barratt Impulsiveness Scale; PHQ-9, Patient Health Questionnaire; GAD-7, General Anxiety Disorder Scale; SOGS, South Oaks Gambling Screen; BART, Balloon Analogue Risk Task; ERP, event-related potential; FRN, feedback-related negativity; n.s., not significant. Values are presented as mean ± standard deviation.
In the BART, the HC group earned significantly higher total points than both GD types (p = .005) (Table 1b). No group differences emerged in the adjusted number of pumps or the frequency of balloon explosions (p > .05), suggesting comparable risk-taking behavior but divergent outcome sensitivity across groups (Table 1b).
Neurophysiological correlates of feedback and decision processing
Analysis of feedback-related ERPs revealed type-specific alterations in neural feedback processing. For loss feedback, a significant group effect was observed for the FRN amplitude (F(2, 144) = 5.49, p = .005, η 2 = .071) (Table 1c; Figure 2). Post-hoc comparisons, corrected for multiple comparisons using Tukey’s HSD test, revealed that the FRN amplitude was significantly larger in the HC group compared to the EMV type (p = .004) (Table 1c). The IMP group fell between the HC and EMV groups and did not differ significantly from either group (HC vs. IMP: p = .081; IMP vs. EMV: p = .639, Table 1c). No significant differences were detected during win trials (F(2, 144) = 1.48, p = .231, η 2 = .020) (Table 1).
Grand-averaged ERP waveforms at the Cz electrode for the HC (blue), IMP (red), and EMV (yellow) groups. The gray shaded area denotes the P3 component time window (350–500 ms). Bar graphs present the mean P3 amplitude for each group, showing a significant difference between the HC and EMV groups (p < .05). Error bars represent the standard error of the mean. Note: ERP, ‘event-related potential’; HC, ‘healthy controls’; IMP, ‘impulsivist type’; EMV, ‘emotionally vulnerable type’.

Figure 2. Long description
The primary line graph plots Amplitude in microvolts on the y-axis from minus 2 to 16, against Latency in milliseconds on the x-axis from minus 400 to 900. Three colored lines represent the groups: blue for H C, red for I M P, and yellow for E M V. All three lines show a major positive peak between 350 and 500 milliseconds, labeled P 3 and highlighted by a gray shaded box. The H C group shows the highest peak at approximately 15 microvolts, followed by I M P at 13, and E M V at 12.
In the top-left inset, three topographic head maps show brain activity at specific latencies: H C at 412 m s, I M P at 402 m s, and E M V at 406 m s. A color scale to the right of these maps ranges from minus 10 to 17 microvolts, with red indicating high central activity.
In the bottom-left inset, a bar graph shows mean P 3 Amplitude. The blue H C bar is the tallest at approximately 16 microvolts, the red I M P bar is middle at 14, and the yellow E M V bar is lowest at 13. A horizontal line with an asterisk indicates a significant difference between H C and E M V.
A legend in the top right identifies the colors and notes that an asterisk indicates p is less than point 0 5.
Similarly, the feedback P3 component in response to losses showed a significant group effect (F(2, 144) = 4.33, p = .015, η 2 = .057). Tukey’s HSD post-hoc tests indicated that the HC group exhibited significantly larger P3 amplitudes than the EMV type (p = .011) (Table 1c; Figure 3). The comparisons between the IMP type and both the HC group (p = .327) and the EMV type (p = .411) were not significant (Table·1c). In contrast, decision-related P3 amplitudes did not differ across groups (Table 1). These findings indicate a specific blunting of neural responses to negative outcomes in the emotionally vulnerable type.
Grand-average ERP waveforms at the Fz electrode for the HC (blue), IMP (red), and EMV (yellow) groups. Gray shaded areas highlight the FRN time window (150–350 ms) used for peak identification. Bar graphs display the mean peak-to-peak FRN amplitude for each group. Error bars represent the standard error of the mean. p < .001 indicates a significant difference between conditions. Note: FRN, ‘feedback-related negativity’; ERP, ‘event-related potential’; HC, ‘healthy controls’; IMP, ‘impulsivist type’; EMV, ‘emotionally vulnerable type’.

Figure 3. Long description
A line graph plots Amplitude in microvolts on the y-axis from minus 2 to 14 against Latency in milliseconds on the x-axis from minus 400 to 800. Three waveforms represent H C (blue), I M P (red), and E M V (yellow). All groups show a baseline near zero until a sharp positive peak around 400 milliseconds. A gray shaded box labeled F R N highlights a negative deflection between 150 and 350 milliseconds.
Top-left inset: Three topographic scalp maps for H C, I M P, and E M V show neural activity distribution. H C shows the strongest focal red activation at the posterior, while I M P and E M V show more diffused patterns. A color scale ranges from minus 3 to 3 microvolts.
Middle-left inset: A bar graph compares mean F R N Amplitude in microvolts. H C has the highest bar (approximately 3.8), followed by I M P (approximately 2.8), and E M V (approximately 2.2). A horizontal line with two asterisks indicates a significant difference (p less than .01) between the H C and E M V groups.
Additionally, paired-samples t-tests confirmed that the feedback P3 amplitude was significantly larger for win outcomes relative to loss outcomes in all groups (HC: t(46) = 15.30, p < .001; IMP: t(43) = 14.56, p < .001; EMV: t(53) = 14.94, p < .001). For FRN amplitude, a significant win–loss difference was only detected in the EMV group (t(53) = 4.151, p < .001), while no such valence difference was found in the IMP group (t(43) = 1.857, p = .070) or HC group (t(46) = 1.824, p = .075).
Moderating role of type on the neural-severity relationship
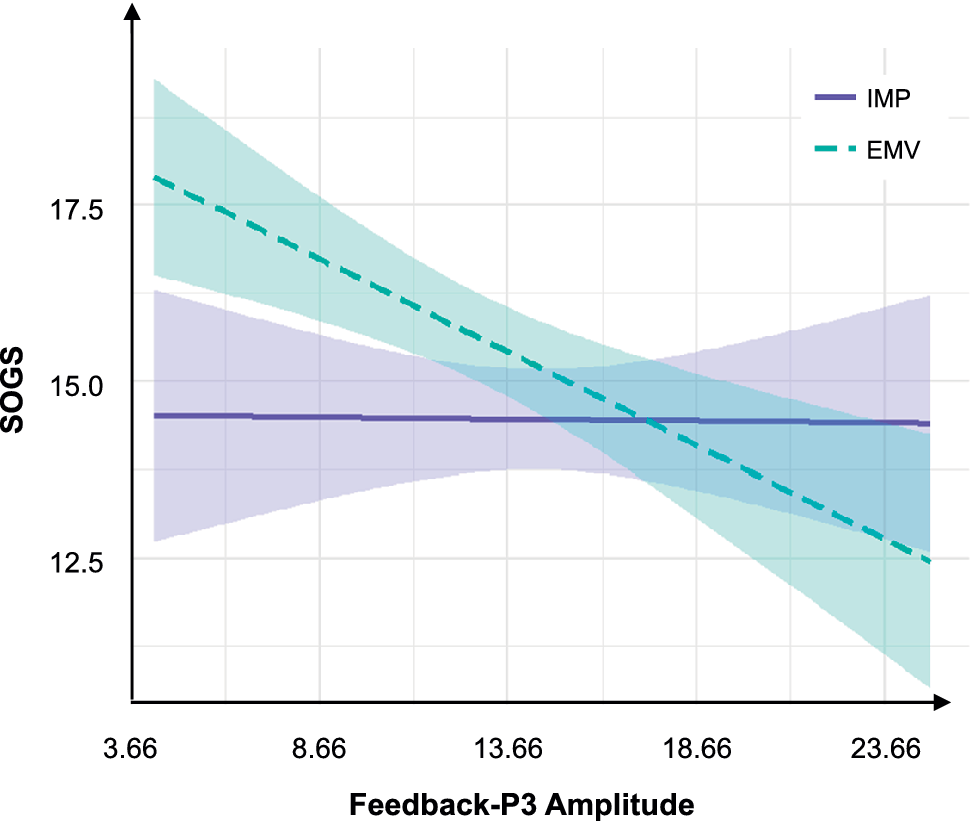
A hierarchical regression analysis examined whether the GD type moderated the relationship between feedback-P3 amplitude to losses and gambling severity (SOGS scores). The full model was significant (F(5, 92) = 4.99, p = .028) (Table 2a). A significant interaction was observed between feedback-P3 amplitude and type (β = −0.23, t(92) = −2.23, p = .028), and model comparison confirmed that adding the interaction term improved fit (ΔF(1, 92) = 4.99, Δp = .028). Further simple slopes analysis revealed that reduced feedback-P3 amplitude was strongly associated with higher SOGS scores within the EMV type (β = −0.28, t(92) = −3.84, p < .001) but not within the IMP type (β = −0.04, t(92) = −0.53, p = .590) (Figure 4). This underscores the EMV type as a critical moderator linking neurophysiological deficits to clinical severity.
Moderation effects of feedback-loss P3 amplitude and feedback-loss FRN on gambling questions in gambling disorder types

Table 2. Long description
The table is divided into two main sections.
Section a: Modulation of S O G S by P 3 amplitude.
- Model 1: Includes Group (E M V or I M P). A I C is 460.4, R super 2 is 0.047, Delta F is 4.69, and P is 0.033.
- Model 2: Adds P 3 amplitude. A I C is 452.9, R super 2 is 0.134, Delta F is 9.63, and P is 0.003. The beta for P 3 amplitude is minus 0.17 with a t-value of minus 3.1.
- Model 3: Adds the interaction term Group times P 3 amplitude. A I C is 449.8, R super 2 is 0.178, Delta F is 4.99, and P is 0.028. The interaction beta is minus 0.23 with a t-value of minus 2.23.
Section b: Modulation of S O G S by F R N.
- Model 1: Same as section a.
- Model 2: Adds F R N. A I C is 461, R super 2 is 0.06, Delta F is 1.33, and P is 0.251.
- Model 3: Adds the interaction term Group times F R N. A I C is 461.4, R super 2 is 0.075, Delta F is 1.59, and P is 0.211.
Columns include Parameter, A I C, R super 2, Delta R super 2, Delta F, beta (S E), t, and P. Abbreviations used: E M V for emotionally vulnerable type, I M P for impulsivist type, S O G S for South Oaks Gambling Screen, and F R N for feedback-related negativity.
Note: Hierarchical regression models testing the modulation of the gambling questions (SOGS scores). Feedback-loss P3 amplitude modulation: Model 1 = Group; Model 2 = Model 1 + P3 amplitude; Model 3 = Model 2 + Interaction term. FRN-loss modulation: Model 1 = Group; Model 2 = Model 1 + FRN; Model 3 = Model 2 + Interaction term. Abbreviations: IMP, impulsivist type; EMV, emotionally vulnerable type; SOGS, South Oaks Gambling Screen; FRN, feedback-related negativity.
Interaction between type and feedback-P3 amplitude in predicting severe gambling (SOGS scores). Note: SOGS, ‘South Oaks Gambling Screen’; IMP, ‘impulsivist type’; EMV, ‘emotionally vulnerable type’; feedback-P3, ‘feedback-related P3 component’.

Figure 4. Long description
The horizontal X-axis is labeled Feedback-P3 Amplitude with numerical markers at 3.66, 8.66, 13.66, 18.66, and 23.66. The vertical Y-axis is labeled S O G S with numerical markers at 12.5, 15.0, and 17.5. A legend in the top right identifies two groups.
* I M P is represented by a solid purple line with a light purple shaded confidence interval. This line remains nearly horizontal, starting at approximately 14.5 on the Y-axis and showing almost no change as Feedback-P3 Amplitude increases.
* E M V is represented by a dashed teal line with a light teal shaded confidence interval. This line shows a strong negative linear correlation, starting high at approximately 18.0 on the Y-axis when Feedback-P3 is low and descending to approximately 12.5 as Feedback-P3 reaches its maximum value.
The two lines and their shaded regions intersect between the 13.66 and 18.66 markers on the X-axis.
A hierarchical regression analysis examined whether the GD type moderated the relationship between FRN amplitude to losses and gambling severity (SOGS scores). The full model was not significant (F(3, 92) = 1.59, p = .211) (Table 2b). No significant interaction was observed between FRN amplitude and type (β = −0.28, t(92) = −1.26, p = .211), and model comparison indicated that adding the interaction term did not improve fit (ΔF(1, 92) = 1.59, Δp = .211).
Discussion
This study demonstrates that blunted neural responses to loss feedback are specific to the emotionally vulnerable (EMV) GD type, resolving inconsistencies in the literature. The EMV type showed blunted FRN and feedback-P3 amplitudes to losses compared to HCs, with no such differences in the impulsive (IMP) type. Crucially, reduced feedback-P3 amplitude predicted greater gambling severity only within the EMV type. It should be noted that the EMV type in our study manifests both emotional disturbances and high impulsivity, rather than pure emotional dysfunction.
Using k-means clustering of impulsivity (BIS-11), anxiety (GAD-7), and depression (PHQ-9) scores, we identified two distinct GD types, consistent with prior empirical work (Ledgerwood & Petry, Reference Ledgerwood and Petry2010; Mestre-Bach et al., Reference Mestre-Bach, Granero, Fernández-Aranda, Potenza and Jiménez-Murcia2022). The IMP type was characterized by high impulsivity with minimal negative affect, while the EMV type exhibited equally elevated impulsivity alongside clinically severe anxiety and depression. Critically, the EMV type reported significantly higher gambling severity (SOGS scores) than the IMP type, aligning with etiological models that link emotional vulnerability to more severe GD trajectories (Blaszczynski & Nower, Reference Blaszczynski and Nower2002; Bonnaire et al., Reference Bonnaire, Devos, Barrault, Grall-Bronnec, Luminet and Billieux2022; Kurilla, Reference Kurilla2021; Mallorquí-Bagué et al., Reference Mallorquí-Bagué, Vintró-Alcaraz, Verdejo-García, Granero, Fernández-Aranda, Magaña, Mena-Moreno, Aymamí, Gómez-Peña, del Pino-Gutiérrez, Mestre-Bach, Menchón and Jiménez-Murcia2019; Milosevic & Ledgerwood, Reference Milosevic and Ledgerwood2010; Nower, Blaszczynski, & Anthony, Reference Nower, Blaszczynski and Anthony2022). While these frameworks have also identified additional types (e.g. operant conditioning-related), our focus on impulsivity and negative affect, two of the most prevalent and clinically impactful sources of GD heterogeneity (Ledgerwood & Petry, Reference Ledgerwood and Petry2010; Lister et al., Reference Lister, Milosevic and Ledgerwood2015; Szerman et al., Reference Szerman, Ferre, Basurte-Villamor, Vega, Mesias, Marín-Navarrete and Arango2020; Zhong et al., Reference Zhong, Dong, Liu, Wei, Zhai, Hu and Du2025a), ensures our findings are targeted to a functionally relevant subgroup. The convergence of our results with Mestre-Bach et al. (Reference Mestre-Bach, Granero, Fernández-Aranda, Potenza and Jiménez-Murcia2022) further confirms that emotional vulnerability and impulsivity are robust dimensions of GD typing, supporting the utility of this framework for unpacking neurocognitive heterogeneity.
Behaviorally, both GD types earned significantly fewer total points on the BART compared to HC, consistent with our prior research documenting disadvantageous risk decision-making in GD (Zhong et al., Reference Zhong, Liu, Wei, Wei, Zhang, Yang and Du2025b). However, no differences emerged between IMP and EMV types in adjusted pumps or explosion frequency, even though the EMV type exhibited greater gambling severity. This mirrors our earlier finding that BART total points do not differentiate GD subgroups by severity (Zhong et al., Reference Zhong, Liu, Wei, Wei, Zhang, Yang and Du2025b). This dissociation highlights a key limitation of behavioral measures alone: while both GD types exhibit reduced outcome sensitivity (evidenced by lower total earnings), behavioral tasks fail to capture the type-specific neurocognitive mechanisms underlying these impairments. In contrast, neurophysiological measures provide a more granular window into the cognitive processes driving risk-taking, revealing deficits that are not apparent at the behavioral level. This aligns with Yin et al. (Reference Yin, Wu, Xiong, Leong, Lei, Zhai, Fong, Yuan, Huang and Chark2025), who reported distinct neural responses to risk outcomes in GD despite minimal behavioral differences, underscoring the need to integrate neural and behavioral data to fully characterize GD heterogeneity.
The EMV type exhibits a valence-specific, type-dependent blunting of neural responses to loss feedback. Theoretically, FRN primarily subserves rapid, automatic prediction error signaling, while feedback-P3 is responsible for the conscious attribution of outcome salience and motivational significance. According to the emotional vulnerability studies (Chiu & Deldin, Reference Chiu and Deldin2007; Yang, Zhou, Gu, & Wu, Reference Yang, Zhou, Gu and Wu2020), conscious appraisal of loss significance represents a more central and vulnerable cognitive stage that is particularly impaired in emotionally dysregulated individuals. For the FRN (an index of early, automatic outcome evaluation), we observed a significant group effect, with HC exhibiting larger amplitudes than the EMV type. Similarly, the feedback-P3 (a marker of late, conscious salience attribution) showed a significant group effect, with HC demonstrating larger amplitudes than EMV. In contrast, neither component differed between the IMP type and HC, and no group differences were observed for win feedback processing. These results resolve long-standing inconsistencies in the GD neurophysiology literature (Dores et al., Reference Dores, Peixoto, Fernandes, Geraldo, Griffiths and Barbosa2025), which have alternately reported blunted (Balconi et al., Reference Balconi, Finocchiaro and Canavesio2015; Luijten et al., Reference Luijten, Schellekens, Kühn, Machielse and Sescousse2017) or heightened (Giustiniani et al., Reference Giustiniani, Nicolier, Maylié, Pazart, Haffen and Gabriel2024; Oberg et al., Reference Oberg, Christie and Tata2011) neural responses to feedback. Our findings clarify that loss feedback processing deficits are not a universal feature of GD but are specific to the emotionally vulnerable subgroup. The blunted FRN in EMV likely reflects reduced automatic sensitivity to loss-related prediction errors (von Borries et al., Reference von Borries, Verkes, Bulten, Cools and de Bruijn2013), while the diminished feedback-P3 suggests impaired conscious allocation of attention to negative outcomes (Polich, Reference Polich2007). Together, these deficits may prevent EMV individuals from recognizing and adapting to losses, perpetuating the ‘chasing losses’ behavior that defines GD (Balconi et al., Reference Balconi, Finocchiaro and Canavesio2015; Zhang & Clark, Reference Zhang and Clark2020). Notably, the absence of win feedback abnormalities indicates a valence-specific deficit, distinguishing EMV type from GD subgroups characterized by reward hypersensitivity (Giustiniani et al., Reference Giustiniani, Nicolier, Maylié, Pazart, Haffen and Gabriel2024; Kryza-Lacombe et al., Reference Kryza-Lacombe, Abram, Potenza, Mackin, Lau, Nicholas, Ford, Batki, Mathalon and Fryer2026). This valence specificity aligns with Takeuchi et al. (Reference Takeuchi, Tsurumi, Murao, Takemura, Kawada, Urayama, Aso, Sugihara, Miyata, Murai and Takahashi2017), who reported structural brain differences in GD subgroups defined by loss aversion, further supporting type-specific neurocognitive mechanisms. Combined with the reduced overall FRN amplitude, the distinct valence effect indicates a unique pattern of early automatic processing, rather than simple general neural attenuation.
The type-dependent moderation of the neural-clinical severity relationship provides an explanation for the functional dissociation between feedback-P3 and FRN in the EMV type. The significant interaction observed, wherein a blunted feedback-P3 amplitude specifically predicted greater gambling severity within the EMV type but not the IMP type, underscores the late, conscious appraisal of loss outcomes as a key neurophysiological mechanism tied to clinical severity in this subgroup. This finding aligns with the established role of the feedback-P3 component in signaling the motivational relevance of outcomes (Acuff et al., Reference Acuff, Cofresí, Varner, Dennhardt, Sable, Bartholow, MacKillop and Murphy2024; Piasecki, Fleming, Trela, & Bartholow, Reference Piasecki, Fleming, Trela and Bartholow2017; Polich, Reference Polich2007). Specifically, the P3 component is considered an endogenous potential sensitive to the allocation of attentional resources and the conscious evaluation of a stimulus’s motivational significance. In contrast, the absence of a moderating effect for the FRN suggests that the early, more automatic stage of outcome valence evaluation (often linked to processing prediction errors) may be a less specific marker for the emotional vulnerability pathway. The FRN’s function in basic prediction error processing might be more universally affected across GD or less directly tied to the emotional dysregulation that characterizes the EMV type. This dissociation reinforces the notion that the EMV type’s pathology is more closely linked to aberrations in the elaborated, conscious assessment of loss significance (indexed by feedback-P3) rather than in the initial, binary classification of an outcome as worse-than-expected (indexed by FRN). This interpretation enhances the coherence of our argument, demonstrating convergent evidence that the finding of a type-specific feedback-P3 moderation effect is reliable and theoretically grounded.
Further supporting the specificity of the observed deficits, our analysis of valence effects revealed nuanced patterns. The finding that feedback-P3 amplitudes were significantly larger for win outcomes compared to loss outcomes across all groups, including HC, is consistent with a vast body of literature. The P3 component typically exhibits enhanced positivity to motivationally salient (Acuff et al., Reference Acuff, Cofresí, Varner, Dennhardt, Sable, Bartholow, MacKillop and Murphy2024; Piasecki et al., Reference Piasecki, Fleming, Trela and Bartholow2017; Polich, Reference Polich2007) or unexpected events (Friedman, Cycowicz, & Gaeta, Reference Friedman, Cycowicz and Gaeta2001; Hajcak, Holroyd, Moser, & Simons, Reference Hajcak, Holroyd, Moser and Simons2005), and monetary gains often carry high motivational value. This general enhancement to wins suggests that the basic neural circuitry for processing positive outcomes remains relatively intact across GD types. The valence effect on the FRN, however, showed a more subgroup-specific pattern. A significant difference between win and loss outcomes was observed only in the EMV group. While the FRN is typically more negative for losses than gains, the absence of a significant valence effect in the HC and IMP groups in our task context might relate to specific task parameters or the relative salience of outcomes. The presence of a significant valence effect in the EMV group, paradoxically, may not indicate healthier functioning. Instead, it could reflect an altered, potentially heightened, early automatic contrast between outcomes within this subgroup, which, when coupled with a blunted late-stage conscious appraisal of losses (feedback-P3), might contribute to their dysfunctional emotional regulation and severe gambling patterns. This complex interplay between early automatic and late conscious processing stages warrants further investigation.
Limitations include typing based primarily on impulsivity and negative affect, a cross-sectional design precluding causal inference, a sample size that may affect generalizability, and the absence of pre-registration. Future work should incorporate broader phenotypic measures, longitudinal designs, pre-register hypotheses and analytic plans, and test the findings in larger and more heterogeneous samples.
Conclusion
By integrating data-driven typing with EEG, this study suggests that blunted loss feedback processing may represent a potential neurocognitive characteristic of the emotionally vulnerable GD type. The specific link between feedback-P3 and clinical severity in this subgroup provides a mechanism-based explanation for GD heterogeneity, paving the way for interventions targeting negative outcome sensitivity, which may benefit type-informed treatment, including neuromodulation and cognitive training with emotion regulation strategies.
Supplementary material
The supplementary material for this article can be found at http://doi.org/10.1017/S0033291726105534.
Data availability statement
Due to ethical considerations and restrictions imposed by participant consent, the raw data cannot be publicly shared. For inquiries regarding data access, please contact M.Z. All data requests will be evaluated on a case-by-case basis. Access to the data requires the submission of a detailed research proposal and approval from a relevant ethics committee. We commit to responding to all valid requests within 30 business days.
Acknowledgments
We express our deepest gratitude to all the contributors who made this article possible. Special thanks to Mr. Guoqi Si for his assistance in data collection.
Author contribution
G.Z., J.L., and X.G. conducted the overall data analysis and manuscript writing. Q.X. and C.X. conducted the data analysis and contributed to the manuscript writing. X.Z., Y.B., and J.Y. participated in data preprocessing and manuscript writing. L.W. and J.D. conceived the study, outlined the research protocol, and contributed to the manuscript writing. M.Z. contributed to the data analysis discussion and contributed to the manuscript writing.
Funding statement
Funding for this study was supported by National Key R&D Program of China (2023YFC3304204, 2019HY320001); National Nature Science Foundation (82130041, 82171484, 81871045, 82201650, 82171485); Brain Science and Brain-Like Intelligence Technology (2021ZD0202105, 2022ZD0211100); Shanghai Jiao Tong University Medical Engineering Cross Research (YG2023ZD25); Shanghai Rising-star Cultivation Program (22YF1439200); Capability Promotion Project for Research-oriented Doctor at SMHC (2021-YJXYS-01).
Competing interests
The authors declare no competing interests.




 Open access

