

Diversity, equality, and inclusion are words often utilised in the description and depiction of quality employment models and goals. The purpose of these efforts is to create a system that identifies and rewards the quality of one's skill, competence, and performance over unrelated sociological factors and characteristics. History has shown that simply asking employers to make their best faith effort to protect against bias, and to create diversity and equality, in their labour force does not always result in successful outcomes.
This article examines how the public sectors of the United States (US), Great Britain (GB) and Northern Ireland (NI) have sought to establish equality in their workforces so that they are more reflective of the populations they serve. It examines nondiscrimination laws, policies, and efforts utilised by these governments to improve the public sector employment of one of the most marginalised populations who continue to face numerous barriers to the selling of their labour.
The term ‘public sector’ employment can have numerous meanings. For this research, the term ‘public sector’ refers specifically to those employed by, and counted as employees of, a government or devolved administration. They will also be referred to as employees of the civil service. They are counted as direct employees and are calculated as such in governmental employment reports. In the US, this would be considered Federal Service in the Executive Branch. In GB and NI, this includes those that work for the UK Government or the devolved administration. The civil service (i.e., public sector employment) was selected to determine if governments who have pledged to ensure equality in the workplace, and who are themselves responsible for enforcing nondiscrimination laws, have successfully achieved equal employment and equal representation of people with disabilities within the public sector that they themselves have authority over. Public sector employment was also chosen because while encouraging private industry to hire people with disabilities is deemed as appropriate, mandating the hiring of people with disabilities by companies in the private sector could be viewed as government interference in the economy and an overreach of its authority. Conversely, the government has free reign to seek out, hire, advance, and retain employees with disabilities within its own labour force.
Deciding who fits into the category of ‘disabled’ was determined by each country. In the US these parameters emerge from the American with Disabilities Act Amendments Act of 2008 (Federal Register, 2011), in GB they are determined by those established in the Equality Act of 2010 (Legislation.gov.uk, 2016), and in NI they are determined by those recognised in the Disability Discrimination Act of 1995 (Legislation.gov.uk, 1995). The requirements to be considered as someone with a disability are very similar across the US, GB and NI. In all three locations, the impairment only rises to the level of a disability if it has a ‘substantial’ impact on either a person's ability to carry out normal day-to-day activities (GB and NI), or if it ‘substantially’ limits a major life activity (US). All three places utilise analogous terminology. A slight difference is that in the UK and NI the disability must be long term in nature while the US does not make such a distinction (US Equal Employment Opportunity Commission [EEOC], 2017a). The data and material used for this research is based on reports and assessments, provided through sanctioned and approved reports by government entities. The information concerning the number of employees with disabilities, who meet the definition of a person who possesses a disability, is based on the countries criteria, and should mitigate any slight variances in the definition.
To determine either the success or failure of these governments’ efforts to be equal employers of those with disabilities, a review of over 60 government documents was conducted. These documents included policies implemented to recruit, hire, and retain employees with disabilities; reports concerning the representation of people with disabilities in their workforces, the levels at which people with disabilities are employed in civil service and more. The major determining factors for the selection of these documents was based on their authenticity as government documents, their focus on the topic of disability, the quality of data they provided and the recentness of their publication. Unfortunately, due to the limits of the data, the ability to separate who was hired by each government after identifying as a person with a disability versus those that acquired a disability, disclosed a disability, or aged into disability, after already acquiring a position is not possible. Nor is it possible to identify if any increase of people with disabilities in these civil service positions was solely due to an increase in hiring, or if an increase of representation was identified after the labour force was surveyed and asked to self-identify as a person with a disability.
The portion of the national labour market that these governments represent is significant as they are often the largest employers present in developed countries. In the US, the largest employer is the Department of Defense, which represents 3.2 million employees, over 1.1 million more employees than its country's largest private company Wal-Mart (Oyedele & Gould, Reference Oyedele and Gould2015), while the UK's largest employer is the National Health Service (NHS) with 1.7 million employees. Respectively, this constitutes the first and fifth largest employers, not just in their countries, but in the world, and demonstrates the significant role that governments can play in addressing the large unemployment issues facing those with disabilities.
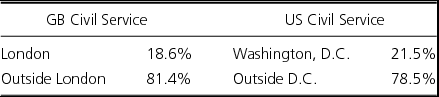
The location of these civil service jobs is also important. While most people believe that the majority of US federal employment is in the Washington, D.C. metropolitan area (i.e., D.C., Maryland, and Virginia; Go Government, 2016), the reality is that 78.5% of federal government jobs are outside of the D.C. area. There are also more than 34,000 federal government employees working abroad (Office of Personnel Management, 2015).
Similarly, in 2015, London had 78,070 civil servants versus Scotland with 43,220, and Wales with 32,440 (Office for National Statistics, 2017a). When all other regions of GB are combined, London civil servants represent 18.6% of the civil workforce and the remaining workforce is distributed throughout GB at 81.4%, which is a similar distribution to those in the US federal service (see Table 1). This means that people with disabilities are not required to migrate to London or the D.C. area to garner quality jobs (i.e., jobs that meet the three basic tenets identified by the Organisation for Economic Co-operation and Development (OECD) to be considered a quality job: earnings quality, labour market security, and quality of working environment; OECD, 2017). Nor are people with disabilities required to abandon the physical and emotional supports afforded them in their established familial and social relationships; bonds which have been highly correlated with employment success by people with disabilities (Evans-Thompson, Booth, & Liles, Reference Evans-Thompson, Booth and Liles2016).
Civil Service Job Locations in Great Britain and the United States

Unemployment is not the only problem that people with disability face. Even if hired, current research demonstrates that disability affects a person's ability to earn a living wage. For example, in Canada it was revealed that those with a disability earn on average 10% to 33% less than those without disabilities, and even when a person's disability in no way affects their ability to carry out their work, they are still paid approximately 10% less (Gunderson & Lee, Reference Gunderson and Lee2016). This is noteworthy; it not only demonstrates the presence of discriminatory practices, but it also means that even if they are socially included in the workplace, people with disabilities remain partially fiscally excluded.
This disparity of pay is an extra burden for people with disabilities and their families. Investigations from the World Health Organization (WHO) illustrate that disabled people, and those households that contain people with disabilities, face worse social and economic outcomes than those people and households that do not (WHO, 2011). The high costs of having a disability, and the social stigma that is associated with it, may contribute to this imbalance. These can include the costs of medications, medical equipment, medical supplies, home modifications, increased transportation costs, special dietary restrictions, and more. It may also include a lack of employment opportunities for the person with the disability or their caregiver, social exclusion, and nonhome residency. Whatever the specific social or economic barriers, the result is that those with a disability, and their family, usually incur costs that others do not (WHO, 2011). The result is that people, or families, which experience disability need to make more money than those who do not have a disability present to achieve the same level of security (Garcia-Iriarte, McConkey, & Gilligan, Reference Garcia-Iriarte, McConkey and Gilligan2016).
Unlike many private sector employers, public sector employers collect data that highlights levels of pay, promotion, training, and other factors concerning their employees. This data can be used towards removing the barriers of discrimination, stigma, and social inequality within their own workforces. They can contribute to equality of opportunity, including access to employment and aid with eradicating the prejudices against people with disabilities that have been established in societies various narratives and histories (Garcia-Iriarte et al., Reference Garcia-Iriarte, McConkey and Gilligan2016). One way that this could be done is by governments demonstrating to the private sector the added value that disabled people provide as employees, professionals, and leaders.
For all these reasons, governments as employers can be the catalyst for large-scale social change. Proceeding in this manner would not mean overstepping its bounds and attempting to control businesses or its citizenry, but rather exercising its freedom to influence it (Villiers, Reference Villiers2001). Many governments, such as the US, GB an NI governments, have attempted to do so by stating their commitment to disability employment and inclusion. This research seeks to determine the amount of divergence between what is said by these governments and what actions the governments have, or have not, taken to create and implement policy that results in the fulfilment of these commitments.
Critical Disability Theory
‘Critical disability theory centres on disability as it compares liberalism's norms and values with their actualisation in the daily life of disabled people’ (Hosking, Reference Hosking2008, p. 5).
Regardless of the tract that critical theory is applied to, it has always been a theory that has possessed a strong core of activism. Horkheimer, who could be considered the father of critical theory, made it clear that critical theory's intention was to seek equality over oppression. He, and others, envisioned that their work would become a way to challenge domination in whatever form it may take (Held, Reference Held1980). It is one of the reasons that those within subjugated minority groups have found it so advantageous to adopt critical theory in their scholarly endeavours. Critical theory allows those who have experienced, or who are researching oppression, a method to evaluate the narrative presented by the hegemonic group in a society and to deconstruct it to a granular level to determine who benefits from the continuation of the status quo and its resulting repressive actions.
In recent years, increasingly more people have become familiar with critical theory; most prominently through critical race theory. Critical race theory (CRT) recognises the power imbalance that exists between groups and affords a way to comprehend this imbalance. CRT also allows a way to analyse and contest this inequality in society (Rollock & Gillborn, Reference Rollock and Gillborn2011). Critical disability theory (CDT) shares these goals. Instead of racial inequality, although that can play a role when evaluating intersectionality of disability and race, CDT focuses its principle evaluative inquiries on the inequalities that exist between those with disabilities in society and those without. Like CRT, CDT believes in the need to reveal the subjugation of one group by another. Its base is rooted in the idea that although many societies are individualistic in nature, society as a whole produces a barrier that keeps those with disabilities on the margins of society. This creation of inequality stems from the acceptance of stereotypes, discrimination, and ableism. CDT, like CRT, seeks to expose the way that, this status quo of inequality is sustained through the normal day to day operations and policies that are simply regarded as normal (Rollock & Gillborn, Reference Rollock and Gillborn2011). For the purposes of this research, the evaluation of the government entities’ efforts to establish equality in their labour forces is the key to understanding the ingrained nature of exclusion in the civil services. Here, CDT compares government rhetoric about commitment to increasing the employment of disabled people with the noninclusive reality found within its own policies, statistics, and reporting methods. It evaluates representation versus reality, creates new knowledge by identifying the discrepancy between the two, and exposes entrenched bias within the Northern Ireland Civil Service (NICS).
Proactive Steps Taken by the Governments So Far
The governments and assemblies of the US, GB and NI are mandated to follow various disability employment laws. These laws have some things in common and some distinct differences. The major laws that each country is obliged to follow include the US Rehabilitation Act of 1973 (Rehabilitation Act; EEOC, 2017b), Great Britain's Equality Act of 2010 (Legislation.gov.uk, 2016), and Northern Ireland's Disability Discrimination Act of 1995 (NIdirect Governmental Services, 2017a). Each country's individual law provides its country's disabled populace with protections while employed. All three laws guard against discrimination throughout the lifecycle of employment. Each law also protects people with disabilities against harassment and states that employers will provide those seeking employment, or those who are already employed, with the necessary reasonable accommodations (known as ‘reasonable adjustments’ in GB and NI), required to perform the essential duties of their jobs where applicable.
For this article, the simple existence of these laws does not constitute a proactive approach to inclusion. It is what the government has done with these laws that are of importance. Many of these laws have been in place for decades with little to no progress in increasing the representation of people with disabilities in the public sectors and are therefore not determined to be proactive approaches by themselves. For instance, from 1980 through 2010Footnote 1, a 30-year period, the US saw an increase of only 0.27% of employees with disabilities (Office of Personnel Management, 2016a) despite the existence of the Rehabilitation Act in 1973 and the creation of the American with Disabilities Act in 1990. The creation of these two laws alone would not be deemed as a proactive step to increase the representation in the US civil service.
Many of these laws are rooted in the government's attempt to institute standards for private employers to follow, and not as a mechanism for increasing its own representation of employees with disabilities in its own labour force. Numerous provisions in these laws and policies simply provide those with disabilities seeking to garner, or to maintain employment, with rights to access and accommodations that are not needed by those without disabilities (e.g., accessible buildings, accessible websites, interpreters, and accessible applications) and do not take the steps to real inclusion. True inclusion means giving value, equality, and opportunity to all, while simultaneously taking away discrimination, and other barriers, which may prevent these things from successfully occurring (Newton, Reference Newton2017).
Intent is important for measuring success. Governments must demonstrate intent to increase the representation of people with disabilities in its civil service so that it better reflects the population in the country it governs, but it is only part of the equation. Outcomes through established action is the other. This second action requires that the government has taken a verifiable action that clearly demonstrates through its data and reports that it has been successful at recruiting, hiring, and/or retaining people with disabilities.
This means that initiatives, such as the creation of press releases (The American Presidency Project, 1974), programs for action (Equal Opportunities Review, 1994), disability networks (Civil Service Disability Network, 2017) advisory boards (National Council on Disability, 2009), awareness dates (White House, President George W. Bush, 2002; NHS Employers, 2017), memoranda (The American Presidency Project, 1975), task forces (U.S. Presidential Task Force on the Employment of Adults with Disabilities, 1998), guidance (Gov.uk, 2017a), trainings (Federally Mandated Training for Federal Employees, 2013; HR University, 2017), or other actions, are not considered efforts to achieve inclusion. Issuing press releases, forming networks or boards, and the other efforts mentioned are steps to identifying barriers, but these actions in themselves do not remove barriers to involvement, nor have they been shown to increase the representation of people with disabilities within the civil service.
It should be noted that the primary focus of this research was on the previous 5 years (2012–2017)Footnote 2, although previous efforts, laws, and regulations are included if they are still valid and used. It should also be noted that GB and NI have two mostly distinct civil services. In statistical reporting GB only counts all home civil service employees. This classification excludes the NICS (Office for National Statistics, 2017a). The duty to report on the NICS data falls to the Northern Ireland Statistics and Research Agency (NISRA) and this agency's data and reports were utilised in combination with the others for this research.
The United States
The idea that governments should demonstrate to the private sector the value that people with disabilities bring to the labour market was re-emphasised by the WHO. In 2011, the WHO's World Disability Report clearly stated that, as employers, governments should lead by example and commit to the employment of disabled people in the public sector (WHO, 2011).
This was not a new idea or goal for the US Government. It had been undertaking efforts to achieve equal representation of people with disabilities in the federal service since 1973. This goal was originally set in the Rehabilitation Act of 1973 where the specific aim was to encourage and increase the numbers of those with disabilities employed in both the public and private sectors (EEOC, 2017c). More specifically, Section 501 of the Rehabilitation Act highlights the need for the government to provide employment to those with disabilities. It requires agencies of the Executive Branch to submit plans that articulate how they would hire, place, and advance those with disabilities within their agency (EEOC, 2017d). In the hopes of encouraging progress, these plans are required to be updated on an annual basis. This law had the intent to improve the representation of people with disabilities in the federal government. Its impact immediately following its issuance was indeterminate. In part because it was not until 1979, six years after the implementation of the Rehabilitation Act, when President Jimmy Carter instituted the Schedule A Hiring Authority through Executive Order 12125 (American Presidency Project, 1979) that true data on the population of employees with disabilities began to be collected. This new hiring authority not only provided that disabled people could obtain competitive status without a competitive examination (The American Presidency Project, 1979), but it also led to the widely implemented use of Standard Form 256 (Office of Personnel Management, 1987). Standard Form 256 was utilised to identify the type of disability a newly hired employee had and if the disability fell into the category of severely handicapped, mentally retarded, or after 1999, a psychiatric disability (American Presidency Project, 1999).
This form as a data collection device became a useful tool for the US Government to use in its understanding of the representation of people with disabilities within its labour force. For the first time, it could look at the data of those with disabilities employed within the public sector and compare it to those with disabilities represented within the general labour market and the private sector. The US Government utilised this data to benchmark its own inclusionary efforts and to determine if it was succeeding or failing at being an inclusive employer for those with disabilities.
Later this form would be used to track if the person had a ‘targeted disability’. Targeted disabilities include deafness; blindness; missing extremities; partial paralysis; complete paralysis; convulsive disorders; mental retardation; mental illness; and distortion of limb and/or spine (EEOC, 2017d); and are counted as a subset of overall disability data. The US EEOC began tracking the data for these specific disabilities, named as targeted, due to their low representation in employment and the issues that those with these disabilities faced with underemployment (EEOC, 2017d). As can be seen by the list, targeted disabilities are mostly disabilities that are obvious, and which can allow someone else to identify the person as disabled. Those with these types of disabilities would most likely neither be able to ‘pass’ as someone without a disability, nor would they be able to keep their disability hidden when seeking employment. Like those with other disabilities, obtaining data for this group allowed the US Government to track its own progress in providing opportunity for those with targeted disabilities as compared to others. It allowed the government to realise that despite all the efforts that it has made from 1980 through to 2010 that the representation of those with targeted disabilities only increased by 0.13% (Office of Personnel Management, 2016a).
The newest version of the Standard Form 256 (SF-256) takes data collection a step further. It states that if a person uses the Schedule A Hiring Authority then their disability is required to be identified on the SF-256. This is done by the newly hired employee identifying their status, or if they refuse, having the agency identify their status by obtaining the medical documentation provided by the employee that supported their appointment under the Schedule A Hiring Authority (Office of Personnel Management, 2016b). This hiring authority is marketed as an easier hiring method for the federal agency and the employee. Unlike standard federal hiring practices, it allows the agency to hire qualified individuals with disabilities into federal service and to promote individuals with disabilities to higher positions. Both can be done without opening the position up for applications from the rest of those in the agency or from the public. This can be beneficial for agencies. Bypassing the traditional, and sometimes prolonged, competitive hiring process it allows agencies to fill positions more quickly (United States Department of Labor, Office of Disability Employment Policy, 2016) and to advance people with disabilities into higher positions where they are underrepresented.
Despite the intentions of the Rehabilitation Act, the implementation of the Schedule A Hiring Authority in 1979, and the efforts of the federal government to reduce the disparities between the representations of people with disabilities, especially targeted disabilities, in the civil service as compared to the public workforce, these efforts had little effect. Data from the three decades following the issuance of the Schedule A Hiring Authority via the SF-256 demonstrates that people with disabilities in the civil service increased by a mere 0.27% and people with targeted disabilities increased by a meagre 0.13% (Report on the Employment of Individuals with Disabilities in the Federal Executive Branch, 2016).
This changed in 2010. At that time, President Barack Obama tried to expand the government's efforts to increase the representation of people with disabilities in the civil service by signing Executive Order 13548 (EO 13548). The EO 13548 re-established a goal for the federal government, originally created, yet never realised, under the Clinton Administrations Executive Order 13163. This goal was to hire 100,000 people with disabilities into the federal workforce. EO 13548 was another step in the government's attempt to establish the federal government as the model employer of people with disabilities (Obama, Reference Obama2010). A goal it had been attempting to reach for nearly four decades but had yet to accomplish.
EO 13548 mandated that specific efforts be made within a 5-year period from its signing. It instructed each executive level agency; to name a person responsible for its agency's goals, that agencies work to retain employees injured at work, and for each agency to submit a plan to hire, train, advance, and retain employees with disabilities. The EO 13548 also obligated each agency to set two goals. The first goal established the number of people with disabilities that the agency would hire over the next five years. The second goal identified the numbers of people with targeted disabilities that were to be hired as a subset of the first goal. At the end of this 5-year period, it was determined that the first goal was met and the second was not.
Great Britain
GB has taken steps through its legislation to recruit more people with disabilities into the civil service. Like the US Rehabilitation Act of 1973, Part 149 of the Equality Act of 2010 identifies that the UK has a ‘public sector duty for equality’. This portion of the legislation states that the public sector has an obligation to remove discriminatory actions, to promote equality, and to foster good relations (Legislation.gov.uk, 2016). Unlike the US Rehabilitation Act, under the Equality Act, disability is just one of eight protective characteristics and not its singular focus. Other protected characteristics under the Equality Act include age, gender reassignment, pregnancy and maternity, race, religion or belief, sex, and sexual orientation.
Like the Rehabilitation Act, the Equality Act 2010 (Specific Duties) Regulations of 2011 mandates that each public authority listed in the regulation is mandated to publish information which demonstrates its adherence to those duties imposed by Section 149(1) of the Equality Act (Legislation.gov.uk, 2011). This requirement is referred to as the Public-Sector Equality Duty (PSED), and like the US Rehabilitation Act requires public sector employers to provide reports of equality in their agency/office on an annual basis with the intention of tracking equality for those with the previously named characteristics identified in the Equality Act.
Under the Equality Act, people with disabilities are permitted the opportunity to compete for jobs. This does not mean that they will be guarantee a job, but the Guaranteed Interview Scheme (GIS) does mean that people with a disability, as defined under the Equality Act will be guaranteed an interview by the civil service (Gov.uk, 2015), if the applicant provides evidence that they meet the minimum criteria for the position and that they meet all the qualifications, skills or experience defined as essential for the position.
Outside of regulation, the UK Government established the ‘Disability Confident’ employer scheme in July 2013 (Gov.uk, 2013). The Disability Confident employer scheme offers three levels of certification of how disability confident an employer has worked to become (Gov.uk, 2017b). The scheme takes employers from Disability Committed (Level 1) to Disability Confident Employer (Level 2), progressing to Disability Confident Leader (Level 3; Rutnam, Reference Rutnam2016). On November 2, 2016, two years after its launch, all the Permanent Secretaries for the Civil Service departments pledged to partake in the Government's Disability Confident scheme (Rutnam, Reference Rutnam2016).
Northern Ireland
Although part of the UK, NI has not adopted the Equality Act as GB did. NI equality efforts still fall under the requirements established in the Disability Discrimination Act of 1995 (known as the DDA). The result is that GB has stronger disability equality legislation and offers a greater level of protection for those with disabilities in GB than their peers in NI (Northern Ireland Human Rights Commission, 2017).
Under the DDA, there are duties that public authorities are responsible to conduct. These are found in Section 49A and state that ‘Every public authority shall in carrying out its functions have due regard to— (a) the need to promote positive attitudes towards disabled persons; and (b) the need to encourage participation by disabled persons in public life’ (Legislation.gov.uk, 2006). This identification of duties does not feature a responsibility of inclusion in employment by public authorities.
Government departments, agencies, and councils must also consider Section 75 of the Northern Ireland Act of 2006 before taking actions. Like the DDA, Section 75 lists nine key groups that must be given consideration before any decisions are made (NIdirect Government Services, 2017a). One of these groups is people with disabilities. Like the DDA, the focus of Section 75 of the Northern Ireland Act is not on ensuring equality of employment, but rather equality in the consideration of those with disabilities when creating policies that may affect them. Section 75 concentrates on both equality of opportunity, and good relations (Equality Commission for Northern Ireland, 2017a). Like the DDA, Section 75 does not state that public entities have any obligation to ensure equality in the hiring, or representation, of people with disabilities in the public sector (NIdirect Government Services, 2017b). Although required to submit annual progress reports (Equality Commission for Northern Ireland, 2017b) concerning the implementation of their disability action plans, public authorities have no requirements to benchmark, set hiring goals, or increase the representation of people with disabilities if they are found to be underrepresented. A divergence from what is seen in the US and GB.
A prime example of this can be seen in what the Equality Commission for Northern Ireland feels are quality disability action plans. When these seven plans, deemed as exemplary, are examined only one mentions any aspect of employment as a goal and none of the plans featured sustained employment as a result. The largest focus of most of the plans was placed on training of staff to be sensitive to people with disabilities, on consultation with and participation by those with disabilities, to create positive attitudes, and to change attitudes (Equality Commission for Northern Ireland, 2017c).
This pattern of the noninclusion, or complete absence of public employment goals, is also seen in many government plans. The Economy 2030 plan created by the Department for the Economy discusses the desire to grow inclusively and to work towards ensuring employability (Department of the Economy, 2017) but it does not make a clear commitment to addressing employment inequalities for disabled people in general employment (Equality Commission for Northern Ireland, 2017d) nor does it mention increasing representation of people with disabilities in public sector employment.
Comparators of Success
Previous discussion has focused on the various laws, regulations, requirements, and efforts made the US, GB, and NI. The following discussion utilises relevant data to evaluate the effectiveness of these items in each country's civil service.
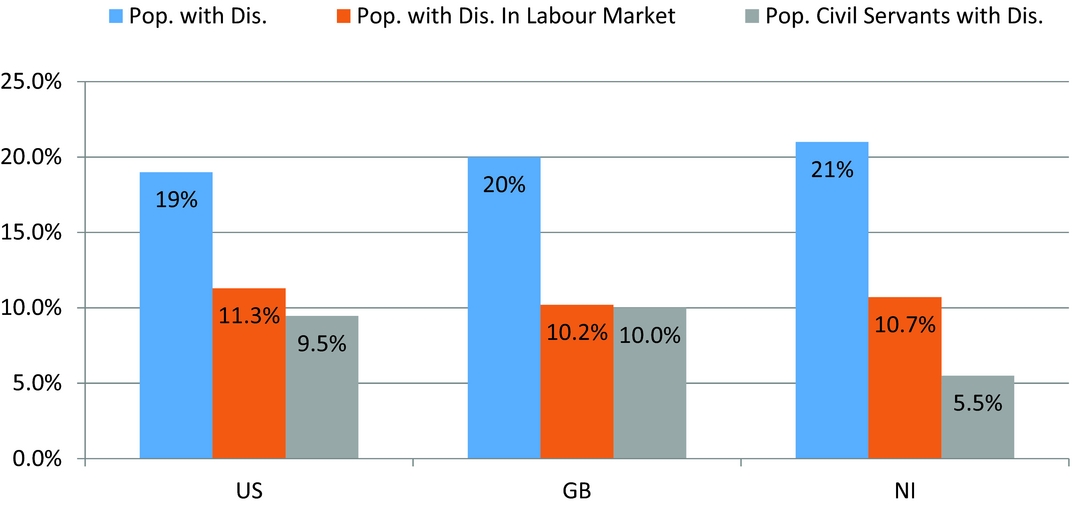
In the US, people with disabilities make up 19% of the population (United States Census Bureau, 2017), while in GB this number is 20% (Gov.uk, 2016a) and in NI this number is 21% (NISRA, 2012; see Figure 1). In each country, approximately 1 in 5 people have a disability.
Representation of people with disabilities in the population compared to active in the labour market and represented in the civil service.
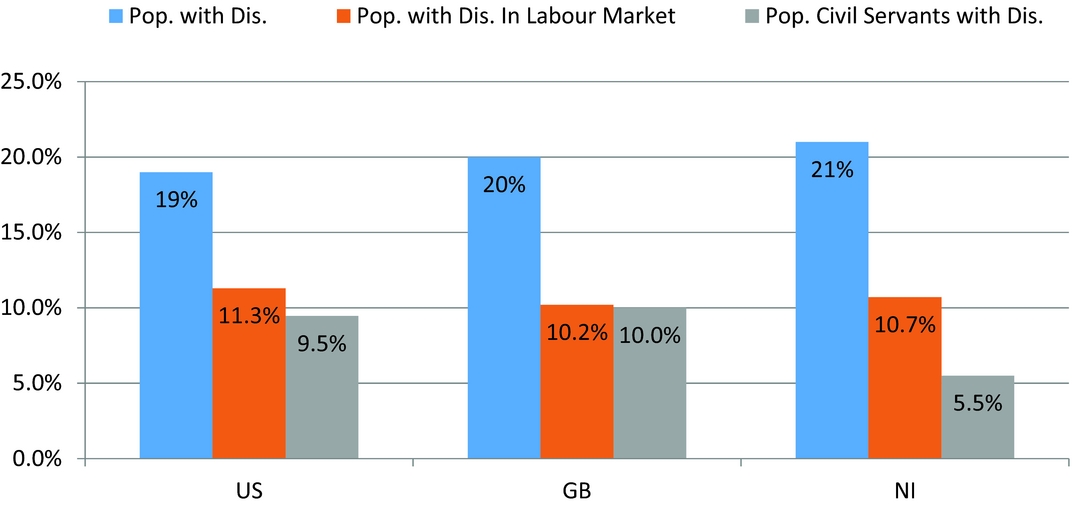
Of those with disabiliites, only a portion of these populations is considered to be active in the labour market. This means the portion of those with disabilities, between the ages of 16 and 64, were deemed to be either in employment, or actively seeking to become employed. As an example, the US removes 68.8% of those with disabilities from the labour force as they have been deemed as inactive (i.e., not seeking employment). In GB this number drops drastically to 46.1%, and in NI 59.4% of people with disabilities are not connected to the labour market.
Data from the US demonstrates that the current representation of people with disabilities (PWD) in its civil service is 9.5% (Office of Personnel Management, 2016a). GB's representation of those with disabilities in its civil service is similar to the US at 10% (Office for National Statistics, 2017a). Both of which are vastly different from the representation of people with disabilities in the NICS. The NICS has a mere 5.5% representation of persons with disabilities in its workforce (NISRA, 2017b; see Figure 1). This means that people with disabilities are represented 44% less in the NICS than the average representations of disabled people in the civil services of GB and the US.
Discussion
The data illustrate that NI falls well behind both the US and GB in its representation of those with disabilities in its civil service. Yet, reports from the NISRA indicate that the numbers of persons with disabilities is parallel to their expectations. In one report, the NISRA states that, ‘at 5.5% the proportion of [civil service] staff who declared a disability was broadly similar to the economically active population (4.7%)’ (NISRA, 2017b, p. 1). This report frames the representation of people with disabilities in its civil service as successful in that it is 0.8% higher than what it has determined to be those representative in its labour market. This was stated even though the NI population of people with disabilities who are of working age, and active in their labour force, is represented at 10.7% of NI's population. The method that NI employed to reach these conclusions is vastly different than those methods used by both GB and the US. In NI, they chose to exclude any of those with disabilities who are of working age and active in the labour market who do not possess specific educational requirements (NISRA, 2017b) and thus shrink the pool of those it deems eligible for public sector employment.
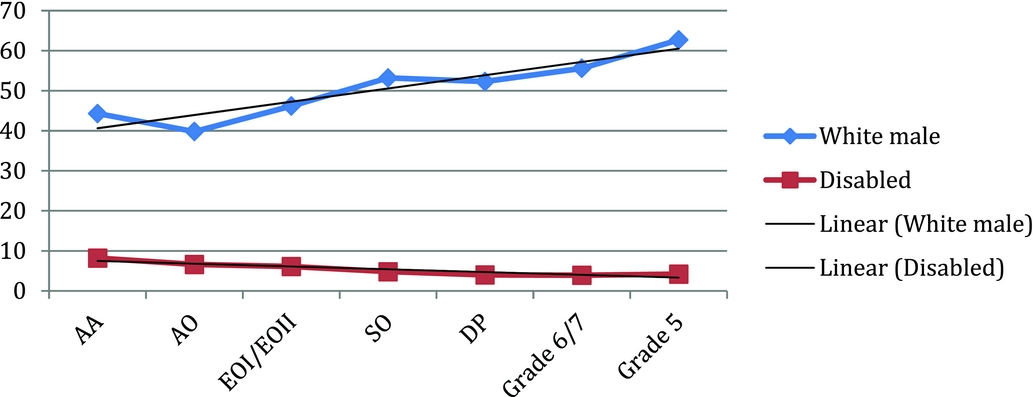
With NI being so overtly selective in their hirings and only seeking those from the disability community that are educated and qualified to their selective standards, one would expect to see that employees with disabilities have been able to progress to leadership positions equal to their nondisabled peers. Yet, this is not the case. In NI, the grade levels of employees are separated into general service grades. These begin at the level of Administrative Assistant (AA) and then progress up the scale through the following levels: Administrative Officer (AO), Executive Officer I (EOI), Executive Officer II (EOII), Staff Officer, Deputy Principal, Grade 6 (Senior Principal), Grade 7 (Principal), Grade 5 (Assistant Secretary). Data, and trend lines, demonstrate the divergent directions in advancement for those with disabilities in the NICS as compared to that of white males (see Figure 2).
Comparison of those with disabilities to white males by grade level.
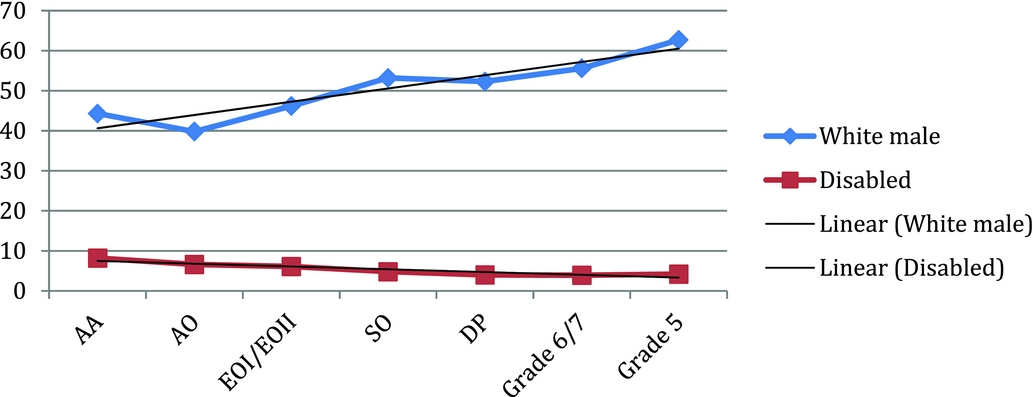
It must be noted that if the data in Figure 2 were compared to similar data from the US and GB's civil services analogous trend lines would be seen. However, GB and the US do not exclude portions of those with disabilities from their civil services who do not possess specific education levels. What makes these trend lines unique from those of the US and GB is that, for this population, NI has already taken measures to ensure that the employees on which they are reporting on are assessed as qualified (i.e., educated for inclusion at all levels). The US and GB do not make these distinctions in their data and therefore a divergence in representation at different levels may be expected. This is due to people with disabilities being approximately half as likely to possess a degree-level qualification (Gov.uk, 2014; Ryan & Bauman, Reference Ryan and Bauman2016). Without having as high a level of educational attainment as their nondisabled peers, those with a disability in professional careers may stagnate at lower levels and be ineligible for higher level positions because they lack specific educational requirements. This could be the cause of these types of divergent representations in the higher levels of the GB and the US civil services. However, in NI's workforce, for example, where all persons in the available labour pool, including those with disabilities, are considered as educated at a level for possible advancement, the trend lines should be parallel to white males and demonstrate equality throughout the various grades level. Yet the trend line in NI is the same as those seen in GB and the US. This demonstrates that the NICS is not providing equal opportunity for advancement for employees with disabilities and that even when they are included in the NICS people with disabilities remain partially fiscally excluded.
What makes the NICS's claim of success more surprising is that NI cites GB as a benchmark that demonstrates NI success, even though GB has access to newer data and has almost twice the representation of people with disabilities in its civil service (NISRA, 2017b).
Part of the issue may not just lie in the removal of a large portion of the labour market in NI's analysis but also in the age of the data it utilises to create its baseline. Appendix A from this NISRA report highlights that the data NI have used as its baseline are statistics that are over a decade old — from 2006. This is to be expected as it has been highlighted in several reports that NI does not possess quality data concerning people with disabilities. This insufficient data collection in NI has been shown to create barriers to planning and delivering services (McQuaid & Raeside, Reference McQuaid and Raeside2014), to evaluate the impact of public policy (Equality Commission for Northern Ireland, 2015), to evaluate quality of life of people with disabilities and to investigate other areas of interest related to living with a disability (Equality Commission for Northern Ireland, 2016).
The contradiction between what the NI Government has stated that it wishes to accomplish versus what it has accomplished highlights a large chasm. Under the DDA there are two major goals to be accomplished, which are:
• to promote positive attitudes towards disabled people
• to encourage participation by disabled people in public life (‘the disability duties’; Legislation.gov.uk, 1995).
The NI Government encourages and supports the achievement of these two goals in a very nominal way. The Disability Action Plans highlighted by the Equality Commission for Northern Ireland are a good example of this. The plans aim to promote positive attitudes towards disabled people and they do exactly that: they encourage others to be positive towards people with disabilities. What they do not do is set out true steps to inclusion through employment (Equality Commission for Northern Ireland, 2017c).
The second tenet aimed at encouraging participation of disabled people in public life is asking people with disabilities to provide their opinions on actions that the government, or others, are proposing to take that may affect those with disabilities. Whether those opinions are valued or utilised is left to the decision makers asking the questions (Gov.uk, 2016b). For example, an agency could gather people with disabilities into a meeting and state that it is the agency's intention to institute a policy to institute a healthcare charge of £200 a month for all of those with disabilities who are currently receiving healthcare from the NHS. They have crunched the numbers and the agency feels that it would save the government a lot of money to institute this policy and that those with disabilities should pay extra, as the agency feels that they utilised the NHS more than others. Due to requirements in the DDA, they have called this meeting to determine the effect that instituting such a policy would have on people with disabilities. The people with disabilities provide input that cites the devastating consequences of implementing such a policy would have on themselves, their families, and their ability to survive. The agency could then decide to continue to implement this policy despite the input of these individuals, even though the agency possesses full knowledge of the devastating ramifications for doing so. While the topic of this example is rooted in hyperbole, it highlights the fact that simply garnering input from those with disabilities in no way provides power to their voice, or inclusion into the process of safeguarding one's rights.
Further examples of marginalisation can be found in the minimalistic way NI collects data about people with disabilities and the methods of reporting this information in various reports. People with disabilities are usually referenced when they are grouped with other minority groups that are underrepresented in the civil service with no distinct plans for further inclusionary efforts. When people with disabilities are the highlight of a report, or are featured as a subsection of a report, the topic of discussion is typically how to more thoroughly train and educate people who are already employed by the civil service on the topics of disability (NICS, 2008). The focus is not on ways in which the civil service will set goals, remove barriers, or recruit more people with disabilities into the civil service.
Some topics do include encouraging more people with disabilities to apply for NICS positions, but no mention is given as to how to ensure that these applications turn into selections of qualified candidates. A surprising fact as recent as 2012, in a report from the Northern Ireland Assembly, stated that when it came to advancing through the hiring process, disabled and older candidates were less likely than others to progress to the next stage. It identified that those without disabilities performed better in 5 out of the 6 tests given, but did not address if this outcome was due to a bias in the test rather than other factors (Northern Ireland Assembly, 2012). Approximately a year later a follow-up report was issued on this topic. The follow-up report stated that the disparity first established in the previous report was less widespread than previously believed, concerning the issues of bias based on sex, ethnicity, and age. This report did not identify any error in the consistent inequality present in the assessment of applicants with disabilities (Northern Ireland Assembly, 2013) or remedy the problem the previous report deemed as significant.
This may be due to NI not having established laws, created in NI, that both include and protect people with disabilities in the public service. Unlike GB, which has dedicated efforts through its Civil Service Reform program, that established measures to eliminate barriers to success (Civil Service, 2015), or the US Rehabilitation Act, which seeks to make the US a model employer for disabled people, NI makes no such sweeping government-wide efforts dedicated to this topic nor does it demonstrate a willingness to alter hiring processes so that they are more inclusive of those with disabilities.
When examined through the lens of CDT, it becomes apparent that NI's governing body and civil service leadership are content with the marginalisation of people with disabilities and their exclusion from the NICS. The NI's governing body makes profound organisational assumptions and establishes a description of improvement (Devlin & Pothier, Reference Devlin and Pothier2006) to the inclusion of people with disabilities into its workforce, which is not supported by its own reports and other evidence to the contrary.
As a result of supporting misinformation concerning the inclusion of people with disabilities into its civil service, the main indicator for inequality has been manipulated thus avoiding the need for further discussion by the civil service into the topic, the need to reduce inequality, and the implementation of further hiring and inclusion efforts targeted towards people with disabilities.
If this inequality were identified, the NI Government would have the authority under Section 75 to act. This includes utilising affirmative-action to counteract the lack of inclusion currently present in its workforce (Murphy, as cited in Equality Commission for Northern Ireland, 2010):
Section 75 in no way calls into question the ability of public authorities to take affirmative action in appropriate cases to correct disadvantage. Affirmative action in appropriate circumstances is an important method of combating inequality, and it is our firm intention that that should remain so. The clause does not call that into question, and does not render unlawful what would be lawful affirmative action under current antidiscrimination legislation. Furthermore, Section 75 means that public authorities are bound to have regard to the need for affirmative action when considering their duty under the clause.
However, this lack of recognition of inequality continues in NI, despite the identification of people with disabilities, in Section 75 of the Northern Ireland Act of 1998 Guide for Public Authorities, as being a community, which may experience higher levels of inequality. Current reporting methods do not highlight such inequality and do not identify a need for affirmative action or positive action to occur. People with disabilities are not being recognised as a marginalised or underrepresented group within the NICS. Without the disadvantage being identified as being present, the NICS has de-obligated itself from making any further large inclusionary efforts. A decision that has resulted in 1,073 disabled people not being employed in the civil service (estimating representation at 10% instead of 5.5%).
The NI Government states that it will act to eliminate inequality when it is appropriately identified. One must wonder if that is indeed true. In 2016, a report highlighting vast inequality between males and females in the executive level of the NICS was created by Ulster University and presented to the Civil Service Commissioners of Northern Ireland. In response, the commissioners intend to use the findings in its new Executive Gender Equality Strategy (Civil Service Commissioners for Northern Ireland, 2016). But as we have seen, creating strategies, reports, announcements, and other documents accomplishes little without the implementation of goals, or action. Sadly, this level of no accomplishment appears to be the status quo when it comes to NICS's efforts to increase the number of disabled people in its labour force. The Civil Service Commissioners for Northern Ireland's Annual Report 2015–2016 is a perfect example. It states that it is proud that the NICS decided to appoint a Diversity Champion in every department as well as to choose Diversity Leaders to take forward specific issues relating to Disability, Lesbian Gay, Bisexual, and Transgender (LGBT), Black and Ethnic Minority (BEM) and Gender issues. Yet, this same report in no way addresses the fact that only 2.4% of all applicants are people with disabilities. A fact found in the same report. It also cites the launch of the Work Placements for People with Disabilities (WPPD) scheme as a positive achievement related to recruiting of people with disabilities. The guidance concerning the implementation of the WPPD reveals why this approach will not result in more disabled employees within the NICS. It states that the point of the WPPD is to offer people with disabilities work opportunities and experiences that they can then use to garner future employment; not to recruit people with disabilities into the NICS. It goes on to state that departments are not allowed to offer a permanent position to those with disabilities who complete their work placement (Carmichael, Reference Carmichael2016). So, while the commissioners’ report implies hope for an increase in inclusion, policy and guidance ensures that it will not come to fruition.
The proclamation by the NICS that it is inclusionary of people with disabilities in its workforce is incorrect. This is shown in the large difference in the representation of disabled employees within NICS as compared to those in the US and GB's civil services. This claim is also shown to be inaccurate when the number of those with disabilities, who are employed by the NCIS, are compared to the representation of disabled people within NI's population who are actively participating in NI's labour market. The NCIS's assertion that it is an inclusive employer is not supported by data. It presents itself as performing better than the private sector. This is not true. It only appears true due to the narrow scope of those that are counted as eligible for employment by the NCIS.
The employability of people with disabilities is an important issue in all countries, but even more so in NI. Due to the fear and horrors that numerous people within NI experienced during the years of sectarian violence, the percentage of the population with mental health issues has been shown to be 20% to 25% higher than those in the population of England (Northern Ireland Human Rights Commission, 2017). This data mixed with the fact that people with disabilities in NI are employed 15% less than those with disabilities in GB (Joseph Rowntree Foundation, 2016), and that people in NI have stated that they would be bothered if they had to work with people with psychological disabilities (Equality Commission for Northern Ireland, 2012), demonstrates that people with disabilities in NI have significant barriers to equality in employment. Barriers that the NICS presents itself as either having overcome or as being unaffected by. This NICS who must not be reading the reports that demonstrate that those with disabilities in NI see a larger presence of stigma and discrimination, including within its civil service, where organisations have found themselves unable to place people with disabilities (McQuaid et al., Reference McQuaid and Raeside2014).
If they were able to see the broader picture, they would see that this, and other research, clearly demonstrates that people with disabilities in NI must overcome a system entrenched with stigma against those with disabilities to become employed by the NICS. They must do this in a country that offers them less legal and social protections then those in the US and GB.
NI remains the only one of the three countries evaluated that states that its representation of people with disabilities in its civil service not only meets, but exceeds its expectations for representation of employees with disabilities as compared to those available in the labour market (NISRA, 2017b).
NI supports this claim by utilising methods and data weighting measures not considered standard practice in the US or even GB. Unlike the US and GB, NI has:
• not established special hiring authorities
• not produced clear plans for increasing the representation of people with disabilities in the civil service
• not provided for the lack of resources highlighted in its Employment Strategy for People with Disabilities (Northern Ireland Human Rights Commission, 2017)
• not demonstrated a hiring process that does not discriminates against disabled applicants (Northern Ireland Assembly, 2012)
• not created or implemented laws and regulations as strong as those seen in both the US and GB (EEOC, 2017b; Legislation.gov.uk, 2011) that explicitly state a public duty to include people with disabilities in the civil service.
Conclusion
This article began by discussing the important part public sector employment plays in improving employment opportunities for people with disabilities and the role that governments can play to be a model for the private sector. It explained CDT and why it was chosen as a theory of evaluation and how it seeks to garner new knowledge by comparing representation and reality. It explored the efforts conducted by the governing bodies of the US, GB and of NI to include people with disabilities into their civil services at a rate that reflects the population it represents. This included a review of current antidiscrimination laws, special hiring authorities, executive orders, reporting requirements, and other tools used by governments to discover, and improve upon the participation rate of people with disabilities in their civil services. It was shown that both the US and GB have similar representation of people with disabilities in their civil services that are representative of those active in the labour market as compared to the private sector. It was also shown that both the GB and the US have laws that clearly establish a public sector duty towards equality. It was confirmed that NICS has selected a method of statistical comparison that allows them to claim success by under counting those in an already marginalised group. Using CDT it was demonstrated that there is a clear disconnect between what the NICS has presented and reality.
As a critical theory, CDT provides a basis to question social structures that seem normal, but whose acceptance as normal, results in the domination of one group over another and limits the latter group's freedoms (Bohman, Reference Bohman and Zalta2005). This is especially true when it concerns the arena of disability and employment. The freedom of employment is often the most important factor in determining the quality of life for a person, their family, or those that they support. For people with disabilities, whether it be those who are born with a disability, or those who acquire disability later in life, employment is often the determining factor between living in dire poverty versus living a life in the mainstream (American Psychological Association, 2016), between living in an institution versus living in a home environment (Rosenthal & Kanter, Reference Rosenthal and Kanter2016), and between having the ability to afford the medical necessities to remain healthy versus the inability to purchase these goods, which in many cases can result in chronic illness and an early death.
For people with disabilities, employment can offer the ultimate freedom, the freedom of inclusion and full participation in life. However, this can only occur if the domination of those with disabilities is removed and the issues of discrimination are addressed by resolving issues of underrepresentation in the labour market. In NI, this will require the recognition that the successful inclusion of people with disabilities into the NICS has not been successful in a manner that truly reflects its population. It will also require the recognition by the NI Government and civil service that there are blatant and hidden means of oppression within the law (Hosking, Reference Hosking2008), in this case the DDA and its supporting regulations that are presented as ensuring equality for disabled people, but which clearly do not provide such protections. If this law is not changed, it will require both the NI Government and civil service leadership to recognise the disparity and to implement true strategies, benchmarks, and goals to remedy them.
Other countries have been successful at removing some of the inequalities seen in their civil services between those in their employ, as compared to those available both in their labour market and as employed within the private sector. NI should consider adopting similar policies and practices to remedy the underrepresentation of people with disabilities within their own civil service and at its senior levels. They could begin to accomplish this by establishing hiring goals; recruiting talented individual with disabilities from universities; creating hiring authorities targeted at disabled people; effectively using affirmative action to hire and advance people with disabilities; evaluating and ensuring equality at all levels, including senior level positions and management. NI could also create work environments where people with disabilities feel safe to disclose their disability; encourage the creation of disability advisory groups made up of NICS employees with disabilities within the NICS to advise leadership of barriers to successful employment and retention; have leadership make a commitment to reaching disability hiring and retention goals; and create accountability in the system by naming those accountable for the success or failure of these inclusionary efforts.
There are numerous other steps that the NICS could take to become a model employer of people with disabilities and to be an example to the private sector. They can serve as a catalyst for large scale social change; however, the first step is for the NCIS to identify that an issue exists. Current laws and policies do not show that they have done so. Intent is important for success and thus far, the NICS's intentions are to ignore people with disabilities.
Acknowledgement
Financial support received from Ulster University and the US-UK Fulbright Commission.