Introduction
Understanding the processes that structure biological communities remains a central objective in ecology. Traditionally, ecological research has emphasised spatial variation by examining how habitat characteristics, landscape configuration and environmental heterogeneity shape species distributions and community composition. However, for organisms with short generation times and rapid responses to environmental change, temporal variation may be equally, or even more, influential than spatial heterogeneity. Disentangling the relative contributions of temporal and spatial drivers is particularly important in tropical ecosystems, where seasonal climatic fluctuations strongly regulate resource availability, species interactions and population dynamics (Hamer et al. Reference Hamer, Hill, Mustaffa, Benedick, Sherratt, Chey and Maryati2005; Morellato et al. Reference Morellato, Alberton, Alvarado, Borges, Buisson, Camargo, Cancian, Carstensen, Escobar, Leite, Mendoza, Rocha, Soares, Silva and Staggemeier2016; Wolda Reference Wolda1988).
Butterflies are especially sensitive to environmental variation because their life cycles are tightly linked to climatic conditions and host-plant phenology. Rainfall influences the production of young foliage required by larval stages and the availability of nectar resources used by adults, while temperature and humidity affect flight activity, reproduction and survival (Boggs Reference Boggs2016; Kingsolver and Woods Reference Kingsolver and Woods2016). Consequently, butterfly communities often exhibit pronounced seasonal fluctuations in abundance, species richness and behaviour that closely track changes in environmental conditions. Their rapid ecological responses and well-resolved taxonomy have led to butterflies being widely recognised as reliable indicators of ecosystem condition and environmental change (Bonebrake et al. Reference Bonebrake, Ponisio, Boggs and Ehrlich2010; Kharouba et al. Reference Kharouba, Ehrlén, Gelman, Bolmgren, Allen, Travers and Wolkovich2018).
Most previous studies of butterfly community dynamics have focused on spatial gradients associated with forest disturbance, habitat fragmentation, land-use change and vegetation structure (Barlow et al. Reference Barlow, Gardner, Araujo, Ávila-Pires, Bonaldo, Costa, Esposito, Ferreira, Hawes, Hernandez, Hoogmoed, Leite, Lo-Man-Hung, Malcolm, Martins, Mestre, Miranda-Santos, Nunes-Gutjahr, Overal, Parry, Peters, Ribeiro-Junior, Silva, Motta and Peres2007; Grøtan et al. Reference Grøtan, Lande, Engen, Sæther and Devries2012; Han et al. Reference Han, Wang, She, Sun and Yin2025). These studies have substantially improved understanding of the habitat characteristics that influence butterfly diversity and distribution. In contrast, comparatively few investigations have evaluated the relative importance of temporal environmental variation, particularly within tropical African ecosystems. Growing evidence suggests that rainfall-driven changes in vegetation productivity and resource availability strongly influence tropical insect communities, yet few studies have simultaneously examined the effects of seasonality and habitat type within a unified analytical framework (Farwig et al. Reference Farwig, Böhning-Gaese and Bleher2006; Maraia et al. Reference Maraia, Jorge, Wagia and Sam2025). Consequently, it remains unclear whether butterfly communities in tropical forests are structured primarily by habitat characteristics or by seasonal climatic variability.
This question can be examined within two complementary ecological frameworks. The environmental filtering hypothesis proposes that abiotic conditions, including rainfall, humidity and temperature, determine which species can establish, persist and reproduce under prevailing environmental conditions (Kraft et al. Reference Kraft, Adler, Godoy, James, Fuller and Levine2015). From this perspective, seasonal climatic shifts should produce consistent changes in butterfly communities irrespective of habitat type. In contrast, the habitat template hypothesis proposes that habitat structure and resource distribution provide the primary framework within which ecological communities develop (Southwood Reference Southwood1977; Townsend and Hildrew Reference Townsend and Hildrew1994). Under this framework, differences among habitat types are expected to outweigh seasonal variation, with the magnitude of seasonal responses depending on local habitat characteristics. Together, these frameworks generate contrasting, testable predictions regarding the relative importance of temporal climatic variability and habitat heterogeneity in structuring butterfly communities.
The Kakamega Forest ecosystem in western Kenya provides an ideal natural laboratory for evaluating these alternative hypotheses. As the easternmost remnant of the Guineo–Congolian rainforest, Kakamega comprises a heterogeneous mosaic of natural forest, regenerating secondary forest, plantation forest, forest-edge habitats, grassland openings and agroforestry systems within a relatively compact landscape (Bleher et al. Reference Bleher, Uster and Bergsdorf2006; Mitchell and Schaab Reference Mitchell and Schaab2008; Tsingalia Reference Tsingalia1988). At the same time, the region experiences a pronounced bimodal rainfall regime that generates substantial seasonal variation in vegetation productivity, flowering phenology and microclimatic conditions (Nicholson Reference Nicholson2018). The coexistence of marked habitat heterogeneity and predictable seasonal climatic variation provides an exceptional opportunity to disentangle the relative contributions of habitat type and temporal environmental change to butterfly community dynamics.
Understanding seasonal responses has become increasingly important under contemporary climate change. Across East Africa, climate projections indicate increasing variability in rainfall timing and intensity, longer dry periods and a greater frequency of extreme weather events (IPCC 2021; Niang et al. Reference Niang, Ruppel, Abdrabo, Essel, Lennard, Padgham, Urquhart and Barros2014). Because butterfly populations are closely synchronised with seasonal pulses of host-plant growth and floral resource availability, alterations in rainfall regimes may disrupt community composition, reproductive activity and long-term population persistence, even where habitat structure remains largely unchanged. Determining the extent to which butterfly communities are regulated by seasonal climatic variation is therefore essential for predicting ecological responses to future climate change and for designing biodiversity monitoring programmes capable of detecting emerging environmental change.
This study investigated butterfly abundance, species richness, diversity, community composition and behavioural activity across six forest cover types within the Kakamega Forest landscape during the transition from the dry season to the onset of the long rains. Specifically, we addressed four questions: (1) Does seasonal variation exert a stronger influence on butterfly abundance and diversity than habitat type? (2) Do butterfly communities respond consistently to seasonal transitions across contrasting habitat types? (3) How do feeding, mating and other behavioural activities vary between dry and wet periods? and (4) Which environmental variables best explain temporal patterns in butterfly abundance? Based on the environmental filtering hypothesis, we predicted that wet–dry seasonal transitions would exert stronger effects on butterfly communities than habitat type and that these responses would be broadly consistent across all forest cover types.
Materials and methods
Study area and climatic setting
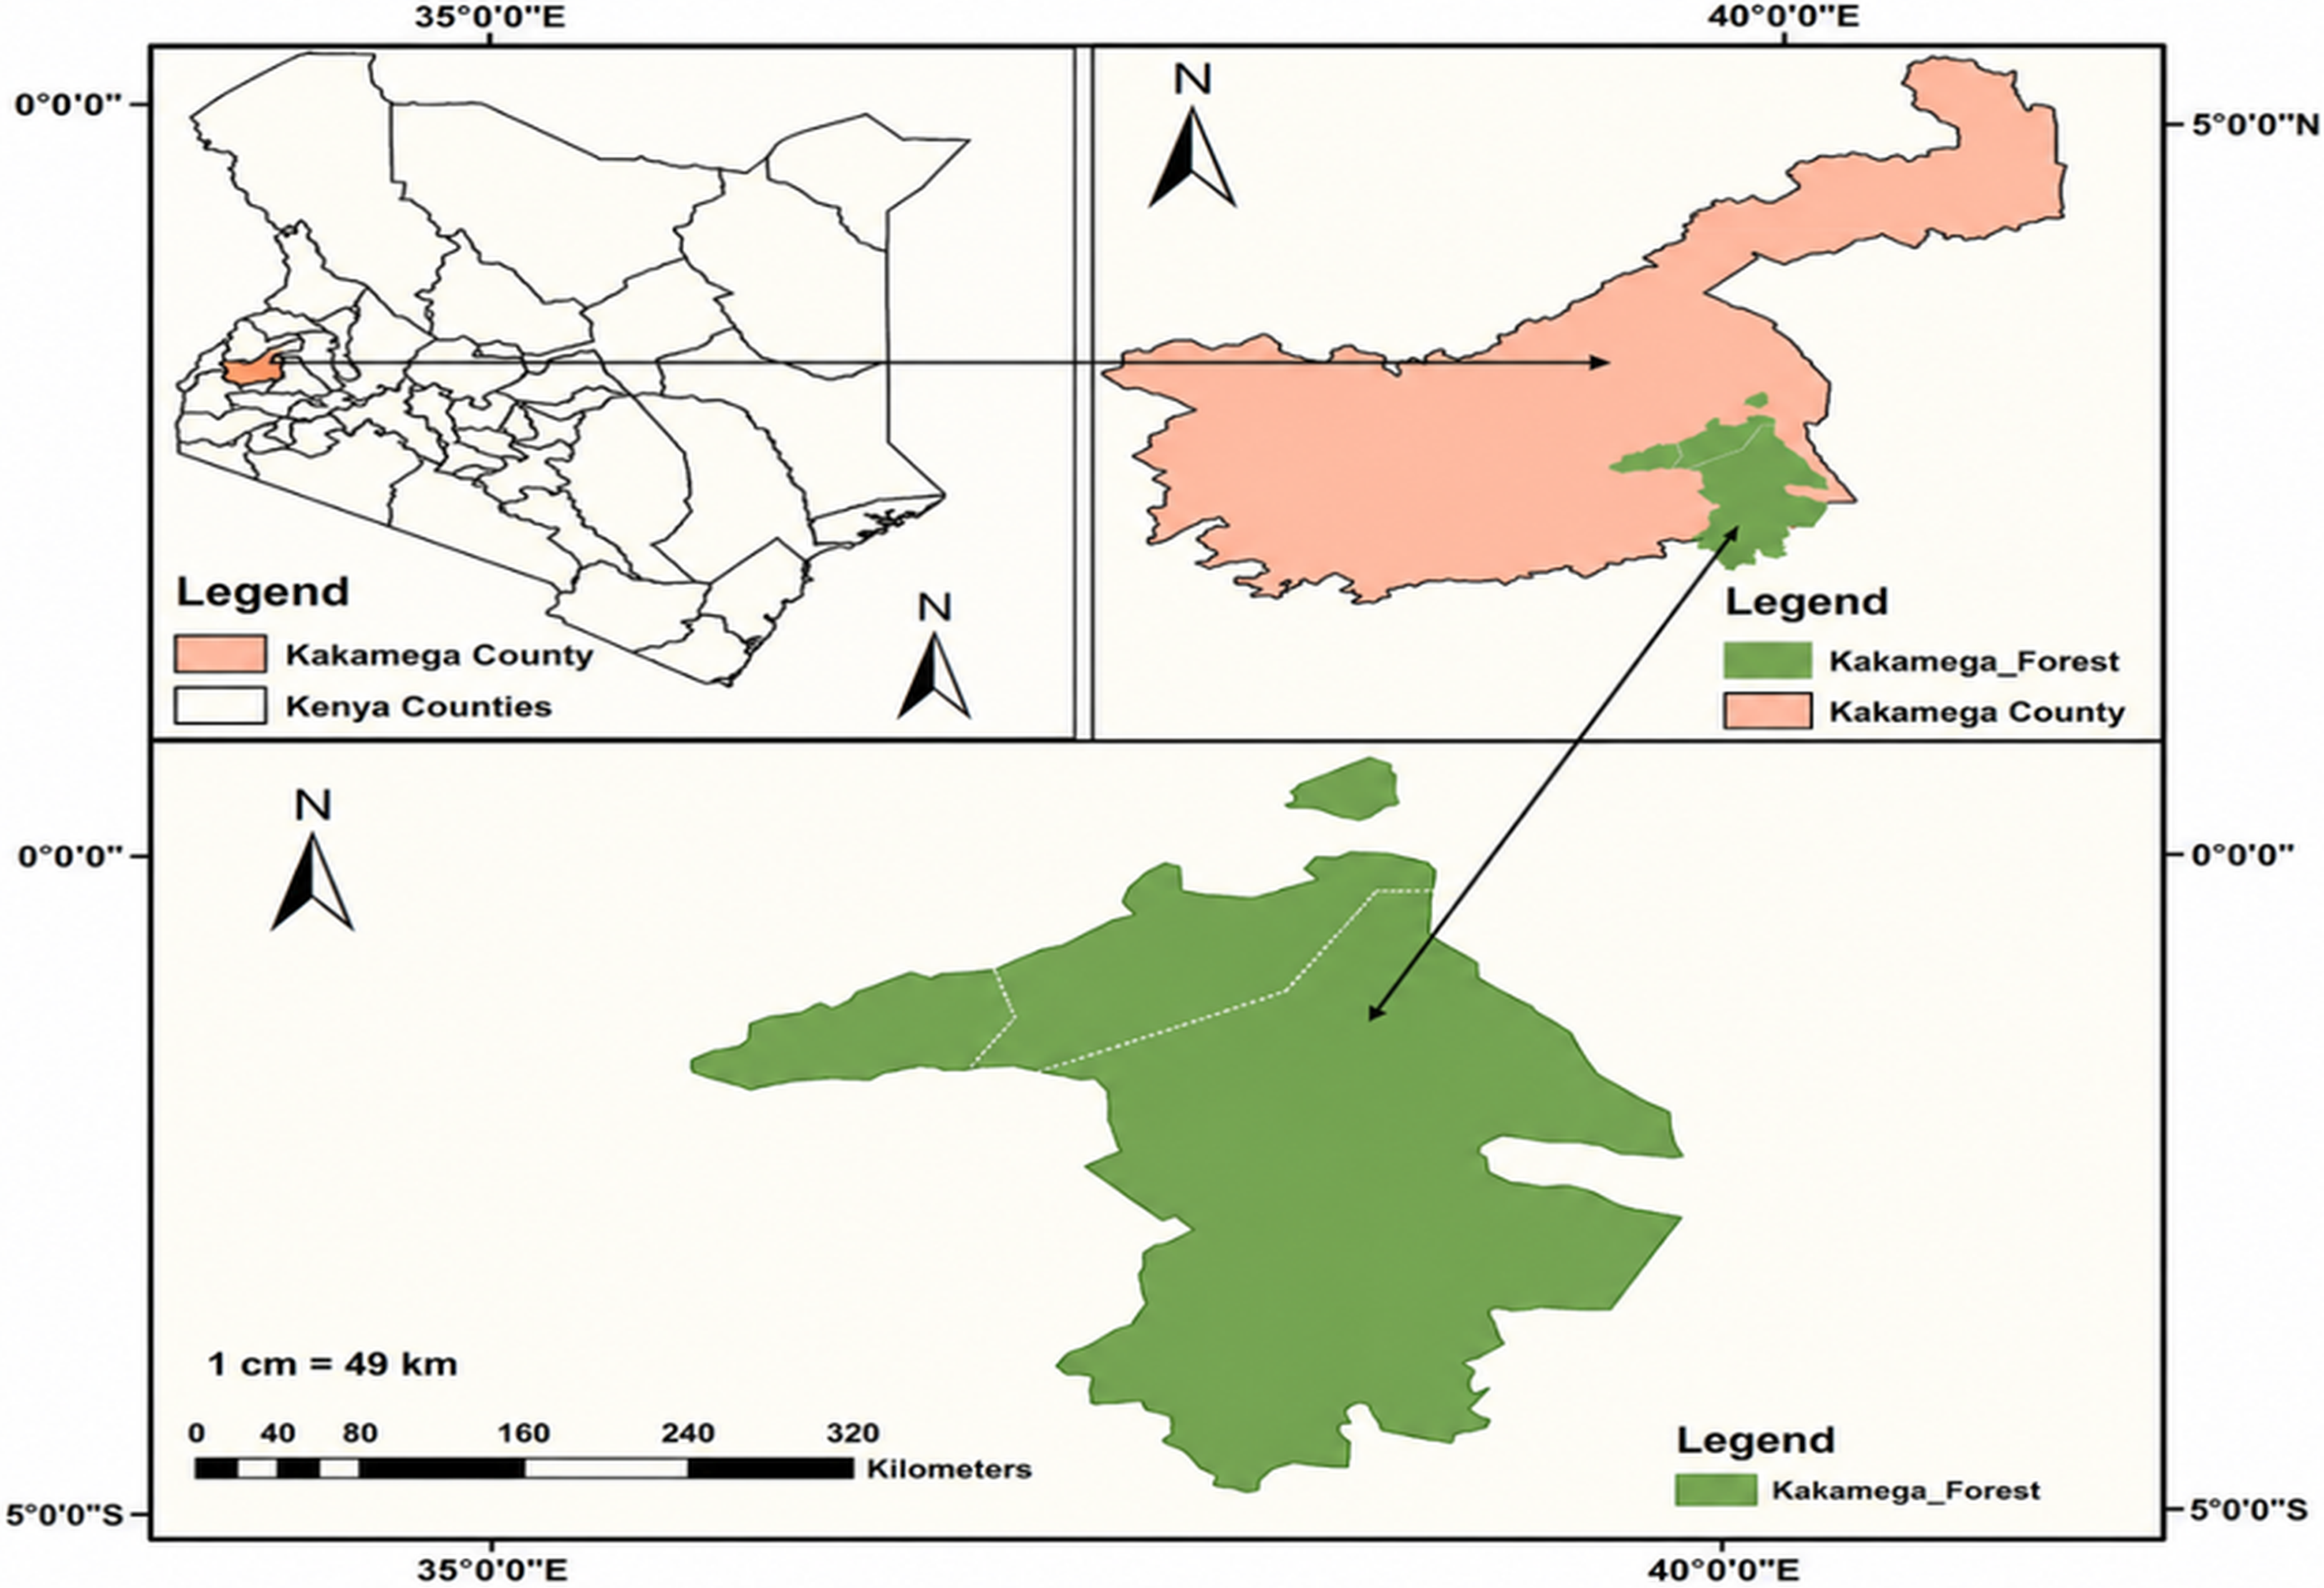
The study was conducted in the Kakamega Forest ecosystem, western Kenya (0°15′N, 34°51′E; 1,520–1,680 m a.s.l.; Figure 1), the easternmost remnant of the Guineo–Congolian rainforest and the only tropical rainforest in Kenya (Beentje Reference Beentje1994; Tsingalia Reference Tsingalia1988).
Location of the study area. (a) Kenya’s counties, with Kakamega County (orange) highlighted. (b) Kakamega County (orange) and Kakamega Forest (green) within it. (c) Kakamega Forest.
Covering approximately 44,600 ha, the forest comprises a heterogeneous mosaic of natural forest, regenerating secondary forest, plantation stands, forest-edge habitats, grassland openings and adjacent agricultural landscapes. Owing to its location at the eastern limit of the Guineo–Congolian biome, Kakamega supports exceptionally high biodiversity and contains one of the richest butterfly faunas in East Africa.
The climate is characterised by a bimodal rainfall regime driven by the seasonal migration of the Inter-Tropical Convergence Zone (ITCZ). Mean annual rainfall ranges from 1,900 to 2,100 mm, with the long rains occurring between March and June and the short rains between October and November. A pronounced dry season extends from December to February, followed by a shorter dry period between July and August. Mean annual temperature is approximately 19°C, although local temperatures vary with elevation and canopy cover. Relative humidity generally exceeds 60% throughout the year but increases substantially during the rainy seasons.
The surrounding landscape is one of the most densely populated rural regions in sub-Saharan Africa, resulting in varying degrees of anthropogenic disturbance across the forest mosaic. Six forest cover types were selected to represent this environmental gradient: natural forest, secondary forest, forest edge, grassland forest, Bischofia javanica plantation and shamba agroforestry systems. Natural forest was characterised by a closed, multi-layered canopy and high plant diversity. Secondary forest comprised regenerating areas previously affected by selective logging and agricultural encroachment. Forest-edge habitats represented transitional zones between closed forest and adjacent open areas. Grassland forest consisted of open-canopy patches with a grass-dominated understorey occurring within or adjacent to the forest boundary. Bischofia javanica plantations were dominated by mature stands of the introduced tree species, whereas shamba systems comprised smallholder farms supporting annual crops interspersed with fruit trees and remnant indigenous trees.
Butterfly sampling
Butterflies were surveyed using the standardised Pollard Walk method (Pollard and Yates Reference Pollard and Yates1993), which provides a repeatable approach for monitoring butterfly communities across contrasting habitats. Two belt transects (500 × 20 m) were established within each forest cover type, giving a total of 12 transects. Transects were positioned to represent the dominant vegetation characteristics of each habitat while avoiding obvious ecotonal overlap. Adjacent transects were separated by at least 300 m to minimise repeated observations of the same individuals.
Sampling was conducted weekly from January to June 2024, encompassing the transition from the dry season to the onset of the long rains. This design generated 24 surveys per transect and a total of 288 sampling occasions. All surveys were undertaken by the same two trained observers to minimise observer bias and ensure consistency in species identification and behavioural observations.
Each transect was surveyed during periods of peak butterfly activity (08:00–11:00 h and 14:00–17:00 h). Observers walked at a constant pace, recording all butterflies detected within 5 m on either side of the transect and up to 5 m ahead. Individuals were identified to species using regional taxonomic guides (Larsen Reference Larsen1991, Reference Larsen1996). Where field identification was uncertain, specimens were captured using hand nets, identified and released. A small number of individuals requiring confirmation were retained as voucher specimens and deposited in the Masinde Muliro University of Science and Technology Natural History Collection (MMUST-NHC), Kakamega, Kenya.
For each observation, butterfly behaviour was assigned to one of five mutually exclusive categories: feeding, flying, resting, basking or mating. Feeding included nectaring and host-plant visitation; flying referred to active directional movement; resting denoted inactive perching; basking represented thermoregulatory wing-spreading; and mating included both courtship and copulation. Behavioural observations were recorded concurrently with butterfly counts and were subsequently used to quantify seasonal changes in activity patterns.
Seasonal classification
The study focused on the ecologically important transition between the dry and wet seasons rather than a complete annual cycle. Surveys conducted between January and March were classified as the dry season, whereas those undertaken between April and June were classified as the wet season. Classification was based on long-term climatic records from the Kenya Meteorological Department and rainfall measurements collected during the study. Monthly precipitation remained below 100 mm during the dry season and exceeded 100 mm during the wet season.
Because sampling was restricted to a six-month period, the results describe community responses during a single wet–dry transition rather than full annual seasonality. Consequently, interpretations are confined to this seasonal transition and should not be extrapolated to interannual patterns without additional long-term monitoring.
Environmental measurements
Environmental variables potentially influencing butterfly communities were measured at the start of each survey. Ambient temperature (°C), relative humidity (%), and wind speed (m s-1) were recorded using a calibrated Kestrel WIND2-M Pocket Weather Meter (Nielsen-Kellerman, Boothwyn, Pennsylvania, USA). Cloud cover (%) was estimated visually following standard meteorological procedures.
Monthly precipitation data were obtained from the Kenya Meteorological Department station at Kakamega and verified using a manual rain gauge installed within the study area. Environmental variables were selected because previous studies have consistently identified rainfall, humidity and temperature as major determinants of butterfly abundance, diversity and activity. To evaluate delayed ecological responses mediated through vegetation dynamics, one-month lagged values of precipitation and relative humidity were calculated and included in subsequent analyses.
Statistical analyses
All analyses were performed in R version 4.6.1 (R Core Team Reference Team2024). Community analyses were conducted using the vegan package (Oksanen et al. Reference Oksanen, Simpson, Blanchet, Kindt, Legendre, Minchin, OHara, Solymos, Stevens, Szoecs, Wagner, Barbour, Bedward, Bolker, Borcard, Carvalho, Chirico, De Caceres and Durand2024), mixed-effects models were fitted using lme4 (Bates et al. Reference Bates, Mächler, Bolker and Walker2015) with lmerTest (Kuznetsova et al. Reference Kuznetsova, Brockhoff and Christensen2017), post hoc comparisons were performed using emmeans (Lenth Reference Lenth2024), and figures were produced using ggplot2 (Wickham Reference Wickham2016). Statistical significance was assessed at α = 0.05.
Butterfly abundance was defined as the total number of individuals recorded during each transect survey. Species diversity was quantified using the Shannon–Wiener diversity index (H′), while behavioural activity was expressed as the number of observations assigned to each behavioural category.
Because transects were surveyed repeatedly, transect identity was included as a random intercept in all mixed-effects models to account for temporal non-independence. The general model structure was Response ∼ Season × Habitat type + (1 | Transect).
Butterfly abundance was analysed using generalised linear mixed-effects models (GLMMs) with a Poisson error distribution and log-link function. Where overdispersion was detected, negative binomial models were fitted. Species diversity and behavioural activity were analysed using linear mixed-effects models (LMMs) fitted by restricted maximum likelihood. Fixed effects were evaluated using Type III Wald χ 2 tests for GLMMs and Type III F-tests for LMMs. Pairwise comparisons were performed using Tukey-adjusted estimated marginal means, and effect sizes were calculated as partial eta squared (η 2 p).
Model assumptions were evaluated using residual diagnostics, quantile–quantile plots and tests of homogeneity of variance. Overdispersion was assessed for count models using residual deviance diagnostics. Variance inflation factors (VIFs) were calculated using the car package (Fox and Weisberg Reference Fox and Weisberg2019), with values >3 indicating potentially problematic multicollinearity.
Species richness was evaluated using both sample-based accumulation curves and individual-based rarefaction analyses. Species accumulation curves were generated using the specaccum function in vegan with 1,000 random permutations. Rarefaction curves were standardised to the smallest sample size, and 95% confidence intervals were estimated by bootstrap resampling (999 iterations).
Variation in community composition was examined using non-metric multidimensional scaling (NMDS) based on Bray–Curtis dissimilarities calculated from fourth-root transformed species abundance data. Ordination quality was assessed using stress values, with values <0.20 considered acceptable. Differences in community composition were tested using permutational multivariate analysis of variance (PERMANOVA) implemented in the adonis2 function with 999 permutations.
Environmental drivers of butterfly abundance were evaluated using GLMMs incorporating precipitation, one-month-lagged precipitation, relative humidity, one-month-lagged relative humidity, temperature, wind speed and habitat type as explanatory variables, with transect included as a random effect. Candidate models were ranked using Akaike’s Information Criterion corrected for small sample size (AICc), and the most parsimonious model was selected from those within two AICc units of the best-supported model (Figure 6).
Seasonal differences in behavioural composition were analysed using multivariate analysis of variance (MANOVA) based on arcsine square-root transformed proportional data. Where significant multivariate effects were detected, follow-up univariate analyses identified the behavioural categories contributing most strongly to seasonal differences.
Ethical considerations
Butterfly surveys were conducted using non-destructive observational methods wherever possible. Specimens were collected only when required for taxonomic verification, and voucher material was curated according to institutional biodiversity research guidelines. All necessary research permits were obtained from the relevant Kenyan authorities responsible for research and biodiversity conservation within the Kakamega Forest ecosystem.
Results
Seasonal variation in environmental conditions
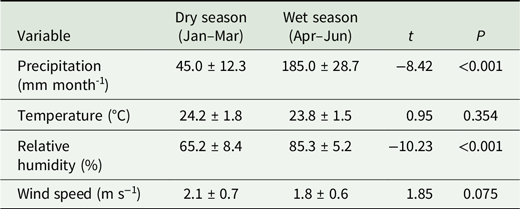
Environmental conditions differed markedly between the dry (January–March) and wet (April–June) phases of the study (Table 1). Mean monthly precipitation increased more than fourfold during the wet season, rising from 45.0 ± 12.3 mm month−1 in the dry season to 185.0 ± 28.7 mm month−1 during the wet season (p < 0.001). Relative humidity also increased significantly, from 65.2 ± 8.4% to 85.3 ± 5.2% (p < 0.001). In contrast, mean air temperature and wind speed showed only minor seasonal variation and did not differ significantly between seasons (p > 0.05). These findings indicate that the transition to the long rains was characterised primarily by increased moisture availability rather than substantial changes in thermal conditions.
Mean (±SD) environmental conditions recorded during the dry (January–March) and wet (April–June) phases of the study in Kakamega Forest, western Kenya. Values are based on monthly observations obtained from field measurements and meteorological records. Statistical comparisons were performed using independent t-tests
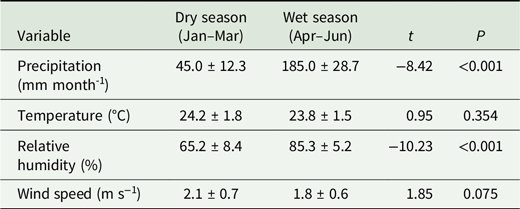
Table 1. Long description
A table comparing environmental conditions during dry and wet seasons in Kakamega Forest, western Kenya. The table has four rows and five columns. The columns are labeled Variable, Dry season (Jan-Mar), Wet season (Apr-Jun), t, and P. The rows are labeled Precipitation (mm month^-1), Temperature (°C), Relative humidity (%), and Wind speed (m s^-1). Row 1: Precipitation (mm month^-1), 45.0 ± 12.3, 185.0 ± 28.7, -8.42, <0.001. Row 2: Temperature (°C), 24.2 ± 1.8, 23.8 ± 1.5, 0.95, 0.354. Row 3: Relative humidity (%), 65.2 ± 8.4, 85.3 ± 5.2, -10.23, <0.001. Row 4: Wind speed (m s^-1), 2.1 ± 0.7, 1.8 ± 0.6, 1.85, 0.075.
Species richness estimation and sampling completeness
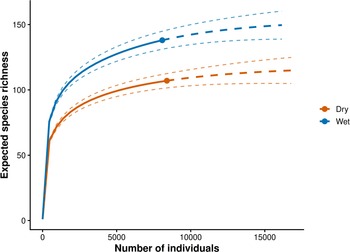
Species accumulation and individual-based rarefaction analyses indicated that sampling adequately captured butterfly diversity across the study period. Species accumulation curves for both seasons approached asymptotic saturation, suggesting that additional sampling would yield relatively few additional species (Figure 2). This pattern demonstrates a high level of sampling completeness despite the large spatial and temporal extent of the survey.
Individual-based rarefaction curves showing expected butterfly species richness (±95% confidence intervals, dashed lines) as a function of the number of individual butterflies sampled in Kakamega Forest during the wet season (dark blue) and dry season (red-orange). Observed species richness was 124 species in the wet season and 90 species in the dry season.
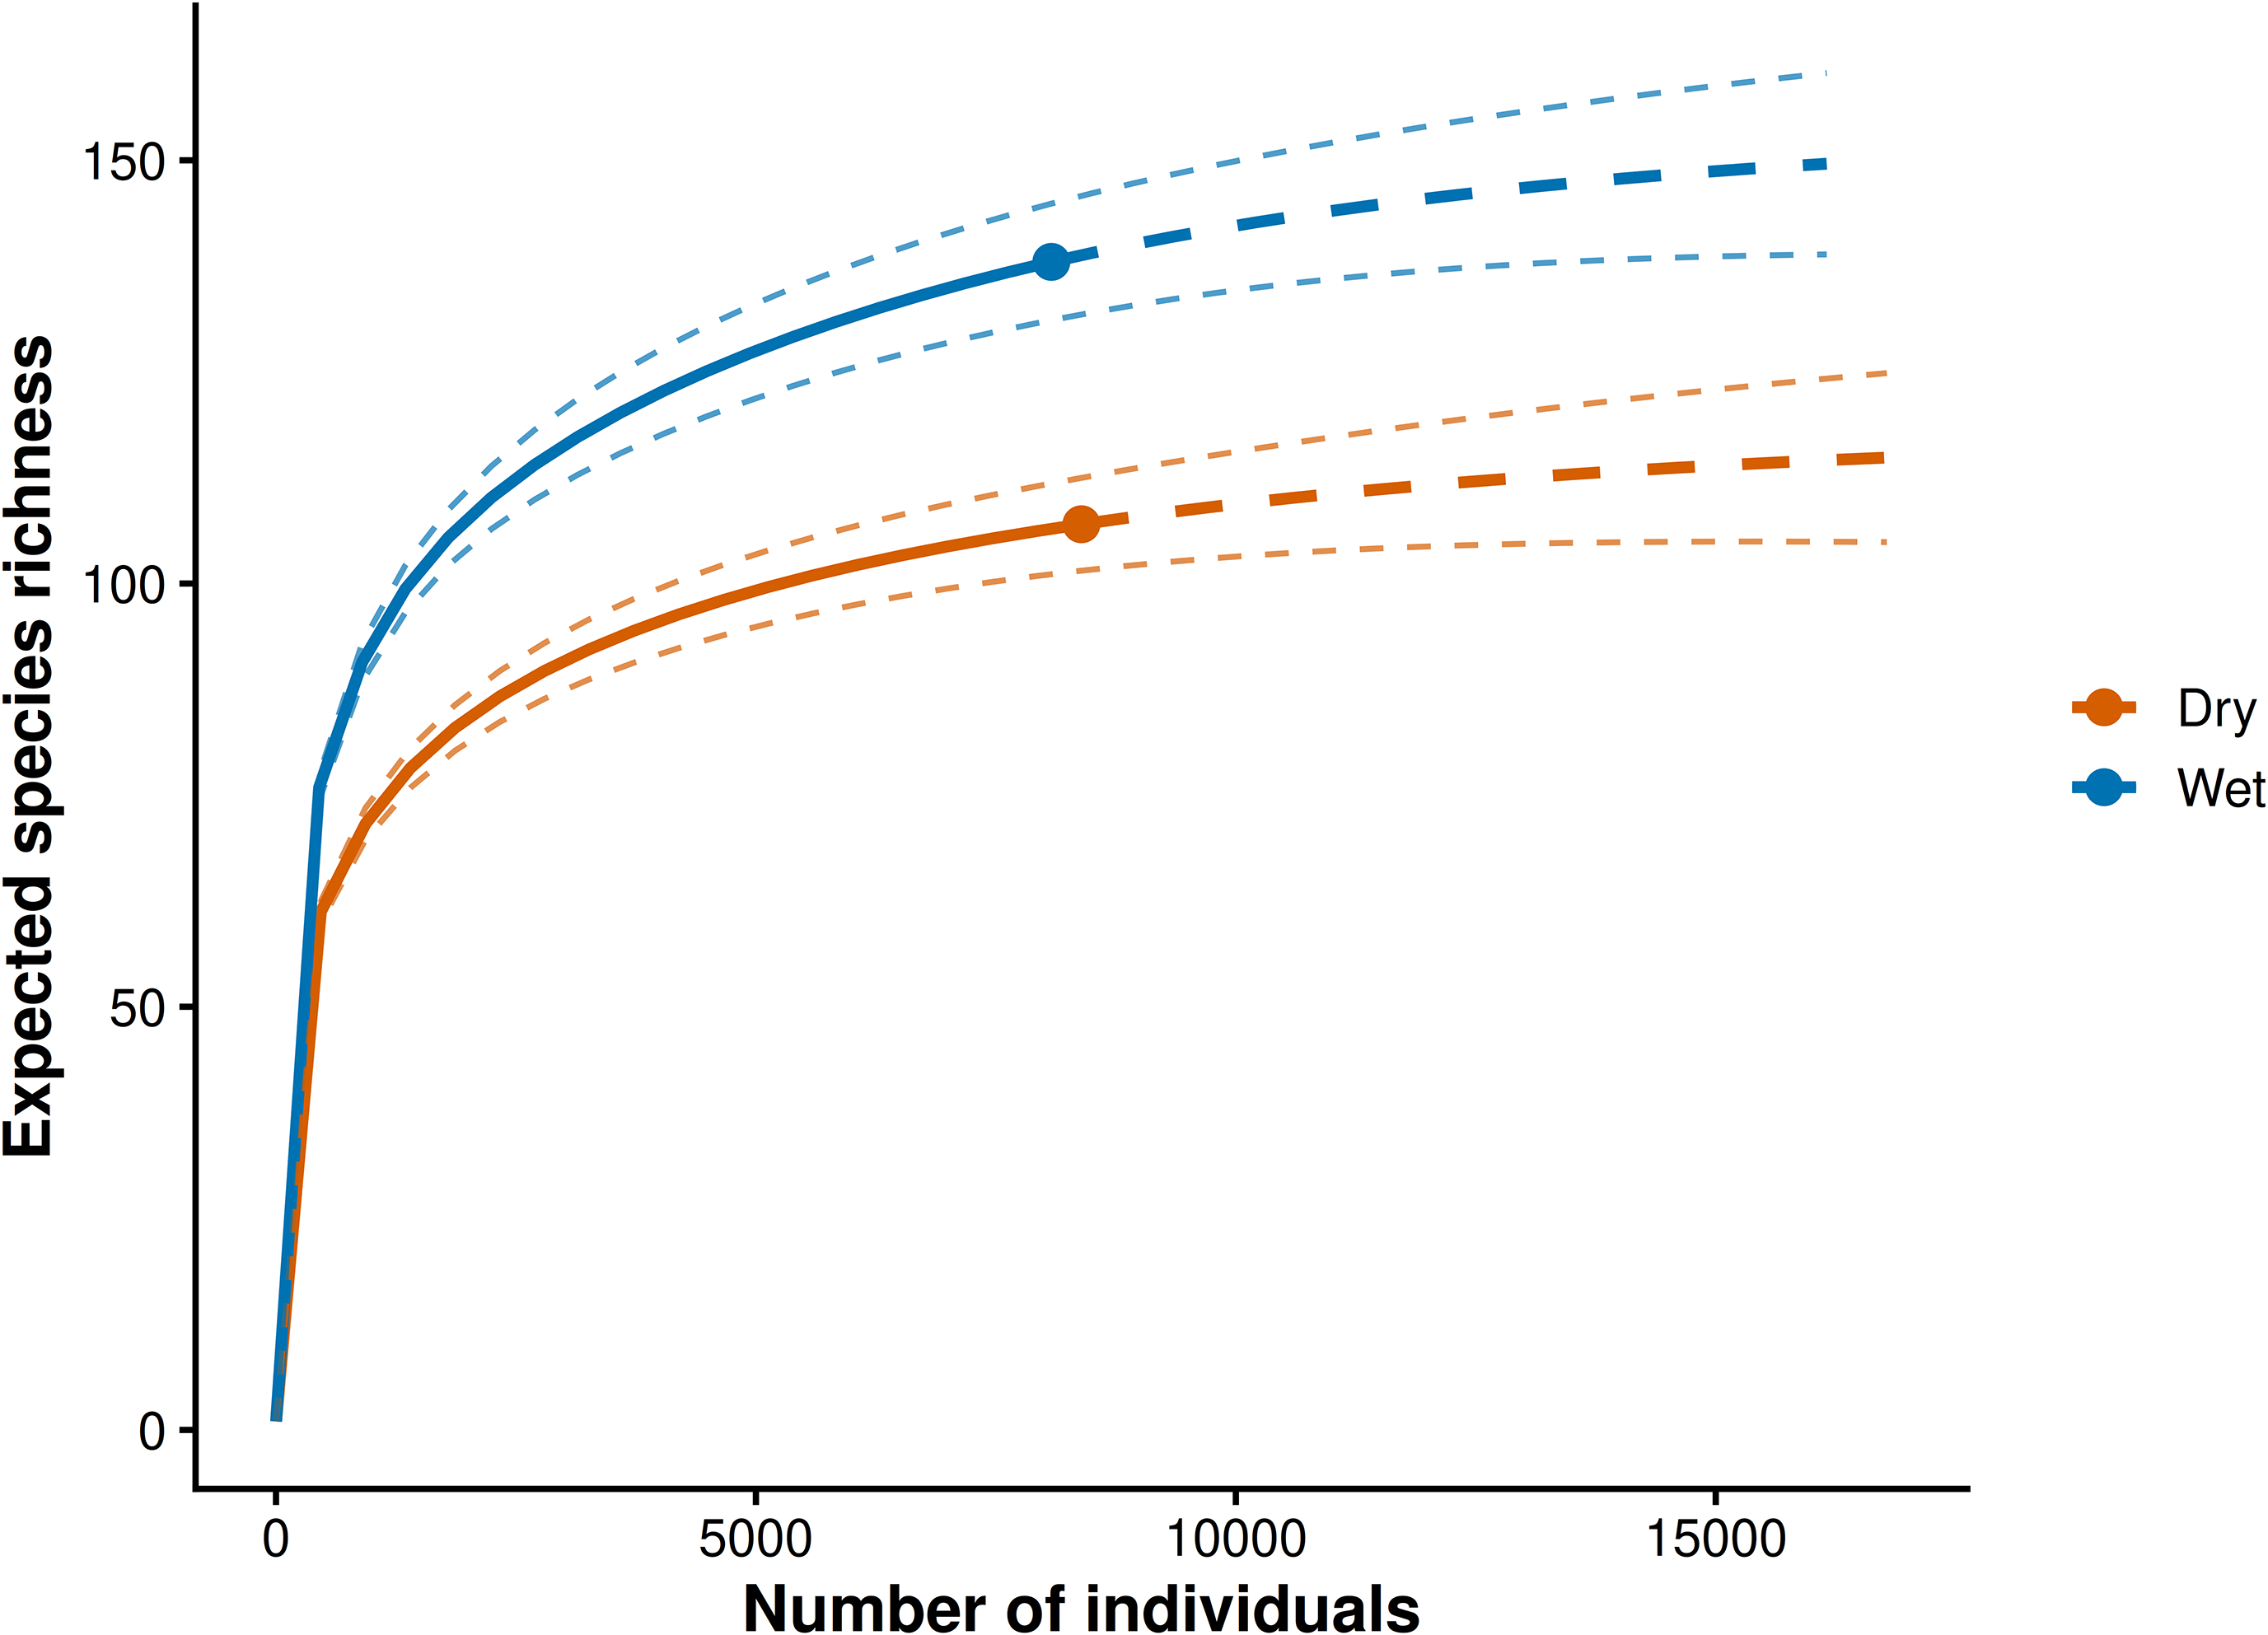
Individual-based rarefaction further showed that the higher species richness observed during the wet season was not an artefact of greater sampling intensity or larger numbers of individuals. After standardising sampling effort, wet-season assemblages consistently supported higher species richness than dry-season assemblages. Across the entire study, 146 butterfly species were recorded, representing a substantial proportion of the regional butterfly fauna associated with the Kakamega Forest landscape during the wet–dry seasonal transition.
Although the wet-season accumulation curve continued to increase gradually towards the end of the sampling period, its near-asymptotic trajectory suggests that only a small number of rare species remained undetected. Collectively, these analyses demonstrate that the observed seasonal differences in species richness reflect genuine ecological variation rather than differences in sampling effort.
Butterfly abundance, richness and diversity across forest cover types
A total of 10,334 butterfly individuals representing 146 species were recorded across the six forest cover types. Natural forest supported the highest butterfly abundance (2,185 individuals), followed by secondary forest (1,990) and forest-edge habitats (1,968), whereas shamba agroforestry systems supported the fewest individuals (1,370).
Species richness showed a similar pattern, with natural forest and forest-edge habitats supporting the greatest numbers of species, whereas grassland forest recorded the lowest richness. Shannon diversity was consistently high across all habitats, ranging from H′ = 3.58 in shamba agroforestry systems to H′ = 3.99 at forest edges (Figure 3).
Seasonal variation in butterfly community metrics across six forest cover types in Kakamega Forest, Kenya. Panels show (a) abundance (number of individuals), (b) species richness, and (c) Shannon diversity (H′). Blue bars represent the dry season and orange bars the wet season. Error bars indicate ± SE where applicable.
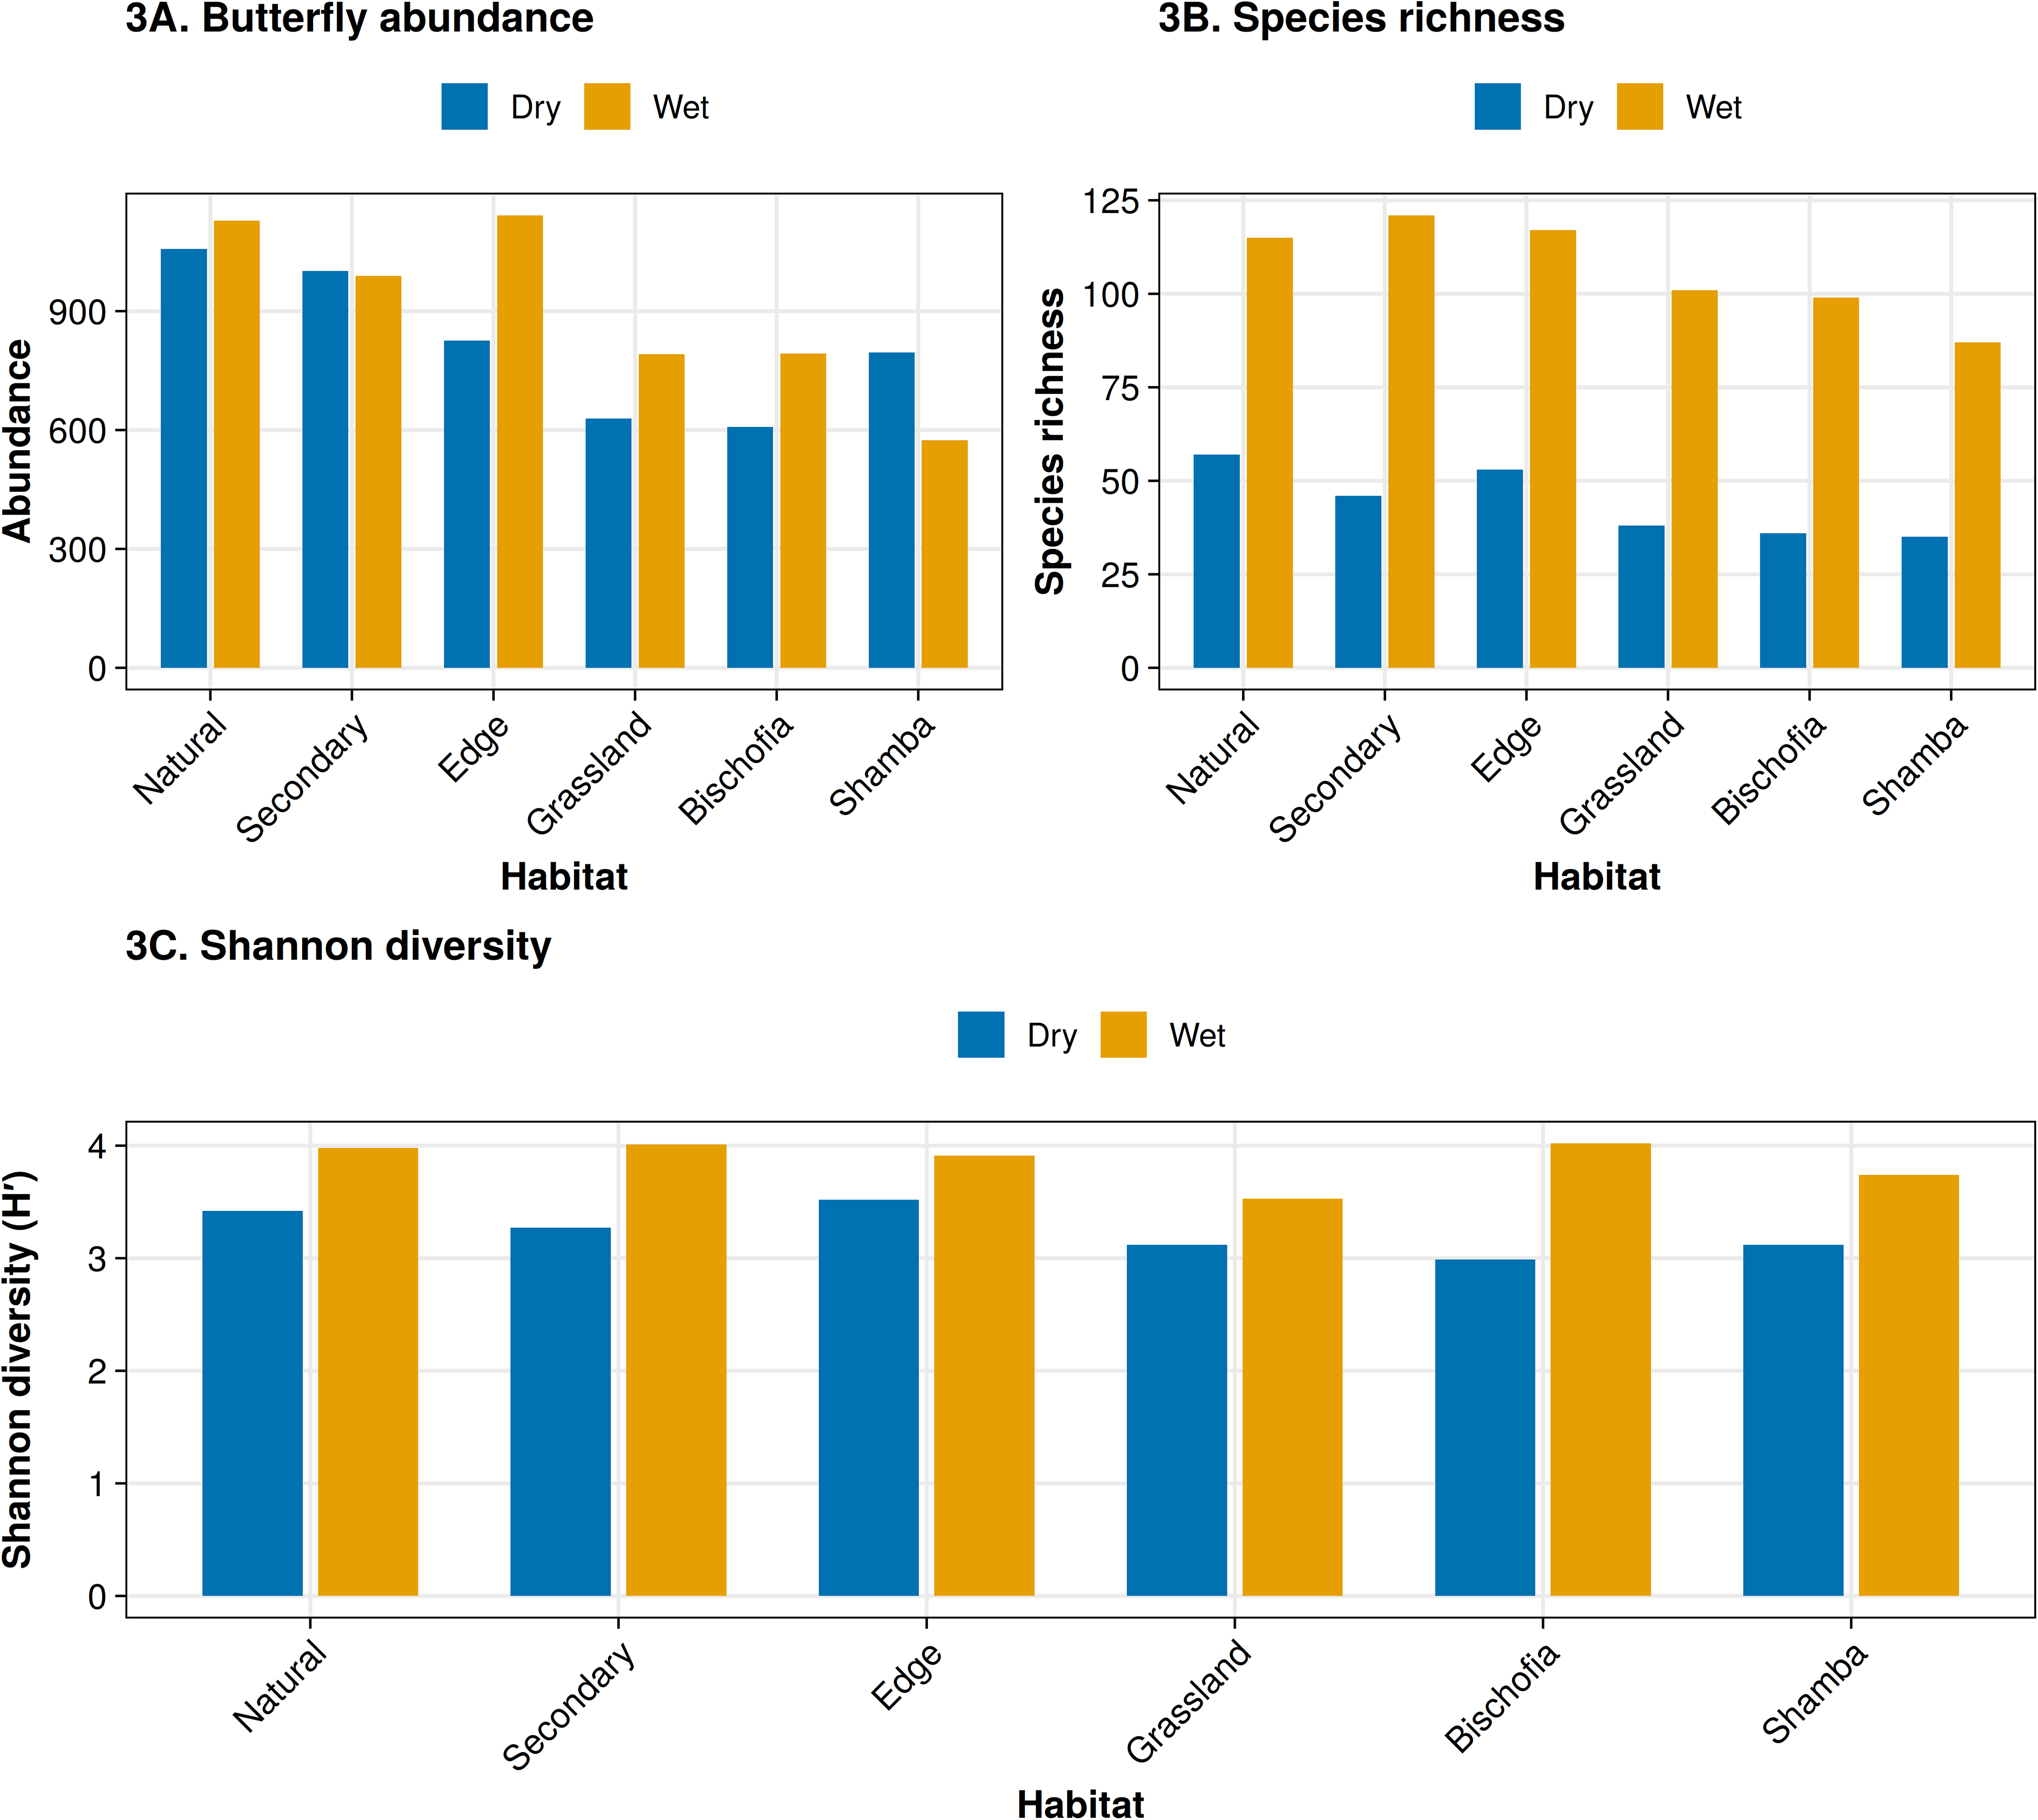
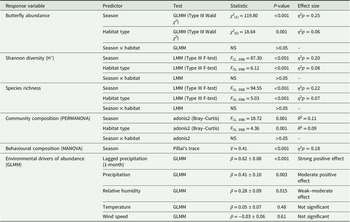
Mixed-effects modelling demonstrated significant effects of both season and habitat type on butterfly abundance, species richness and Shannon diversity (Table 2). However, season consistently explained a larger proportion of the observed variation than habitat type. Effect sizes for season (η 2 p = 0.20–0.25) were approximately three to four times greater than those associated with habitat type (η 2 p = 0.06–0.08). In contrast, no significant season × habitat interactions were detected for any community metric, indicating that seasonal responses were broadly consistent across all forest cover types.
Summary of statistical analyses evaluating the effects of season and habitat type on butterfly community structure in Kakamega forest
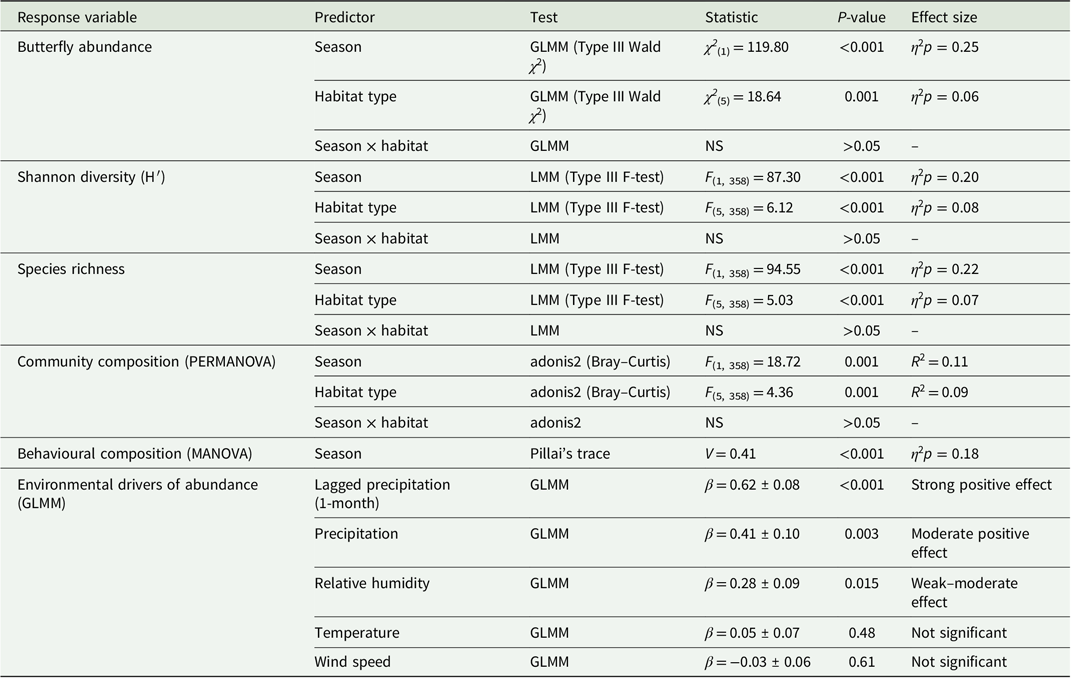
Table 2. Long description
The table presents statistical analyses evaluating the effects of season and habitat type on butterfly community structure. It has 6 rows and 6 columns. The columns are labeled Response variable, Predictor, Test, Statistic, P value, and Effect size. The rows are labeled Butterfly abundance, Shannon diversity (H’), Species richness, Community composition (PERMANOVA), Behavioural composition (MANOVA), and Environmental drivers of abundance (GLMM). Each row provides detailed statistical results for different response variables, including the predictor, test type, statistic value, P value, and effect size. Notable trends include significant effects of season and habitat type on butterfly abundance, species richness, and Shannon diversity, with season explaining a larger proportion of the observed variation than habitat type. No significant season-habitat interactions were detected for any community metric.
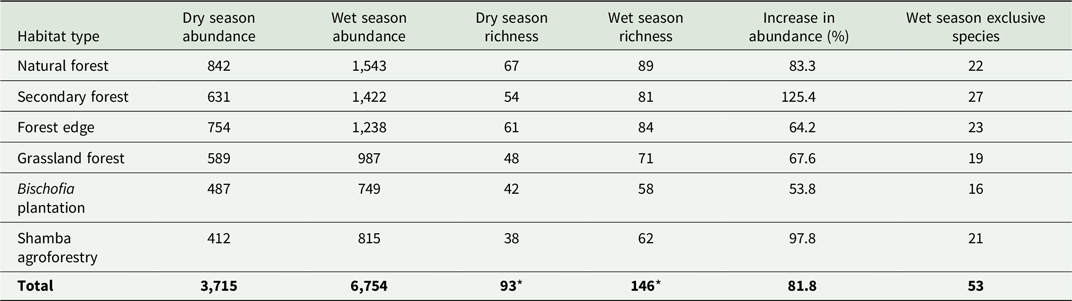
Habitat-specific summaries further illustrate these patterns (Table 3). Butterfly abundance increased between the dry and wet seasons in every habitat, with increases ranging from 53.8% in Bischofia plantations to 125.4% in secondary forest. Wet-season assemblages also contained substantially more species, including numerous taxa recorded exclusively during the rainy period.
Habitat-specific abundance, richness, and seasonal turnover of butterfly communities. Richness values represent total species recorded within each habitat and are not species-unique across habitats
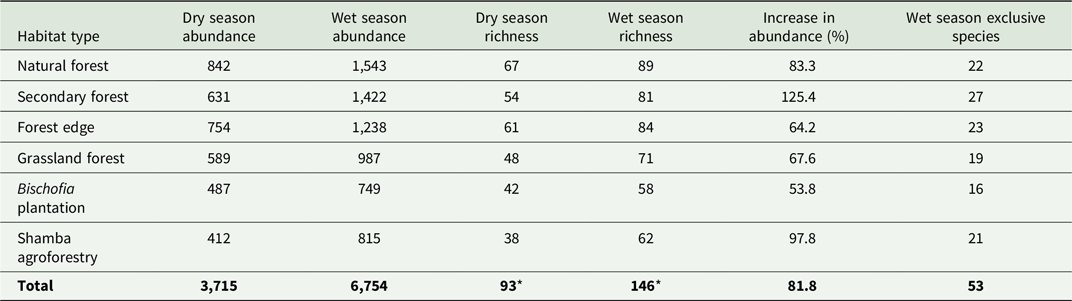
Table 3. Long description
A table comparing butterfly community metrics across different habitats during dry and wet seasons. The table has 7 rows and 8 columns. Column headers are Habitat type, Dry season abundance, Wet season abundance, Dry season richness, Wet season richness, Increase in abundance (%), Wet season exclusive species. Row 1: Habitat type, Natural forest; Dry season abundance, 842; Wet season abundance, 1543; Dry season richness, 67; Wet season richness, 89; Increase in abundance (%), 83.3; Wet season exclusive species, 22. Row 2: Habitat type, Secondary forest; Dry season abundance, 631; Wet season abundance, 1422; Dry season richness, 54; Wet season richness, 81; Increase in abundance (%), 125.4; Wet season exclusive species, 27. Row 3: Habitat type, Forest edge; Dry season abundance, 754; Wet season abundance, 1238; Dry season richness, 61; Wet season richness, 84; Increase in abundance (%), 64.2; Wet season exclusive species, 23. Row 4: Habitat type, Grassland forest; Dry season abundance, 589; Wet season abundance, 987; Dry season richness, 48; Wet season richness, 71; Increase in abundance (%), 67.6; Wet season exclusive species, 19. Row 5: Habitat type, Bischofia plantation; Dry season abundance, 487; Wet season abundance, 749; Dry season richness, 42; Wet season richness, 58; Increase in abundance (%), 53.8; Wet season exclusive species, 16. Row 6: Habitat type, Shamba agroforestry; Dry season abundance, 412; Wet season abundance, 815; Dry season richness, 38; Wet season richness, 62; Increase in abundance (%), 97.8; Wet season exclusive species, 21. Row 7: Habitat type, Total; Dry season abundance, 3715; Wet season abundance, 6754; Dry season richness, 93; Wet season richness, 146; Increase in abundance (%), 81.8; Wet season exclusive species, 53.
Note: Species richness values represent pooled habitat-level richness and are therefore not additive across habitats or seasons. Gamma diversity represents the total number of species recorded during the entire study period.
Seasonal variation in behavioural activity
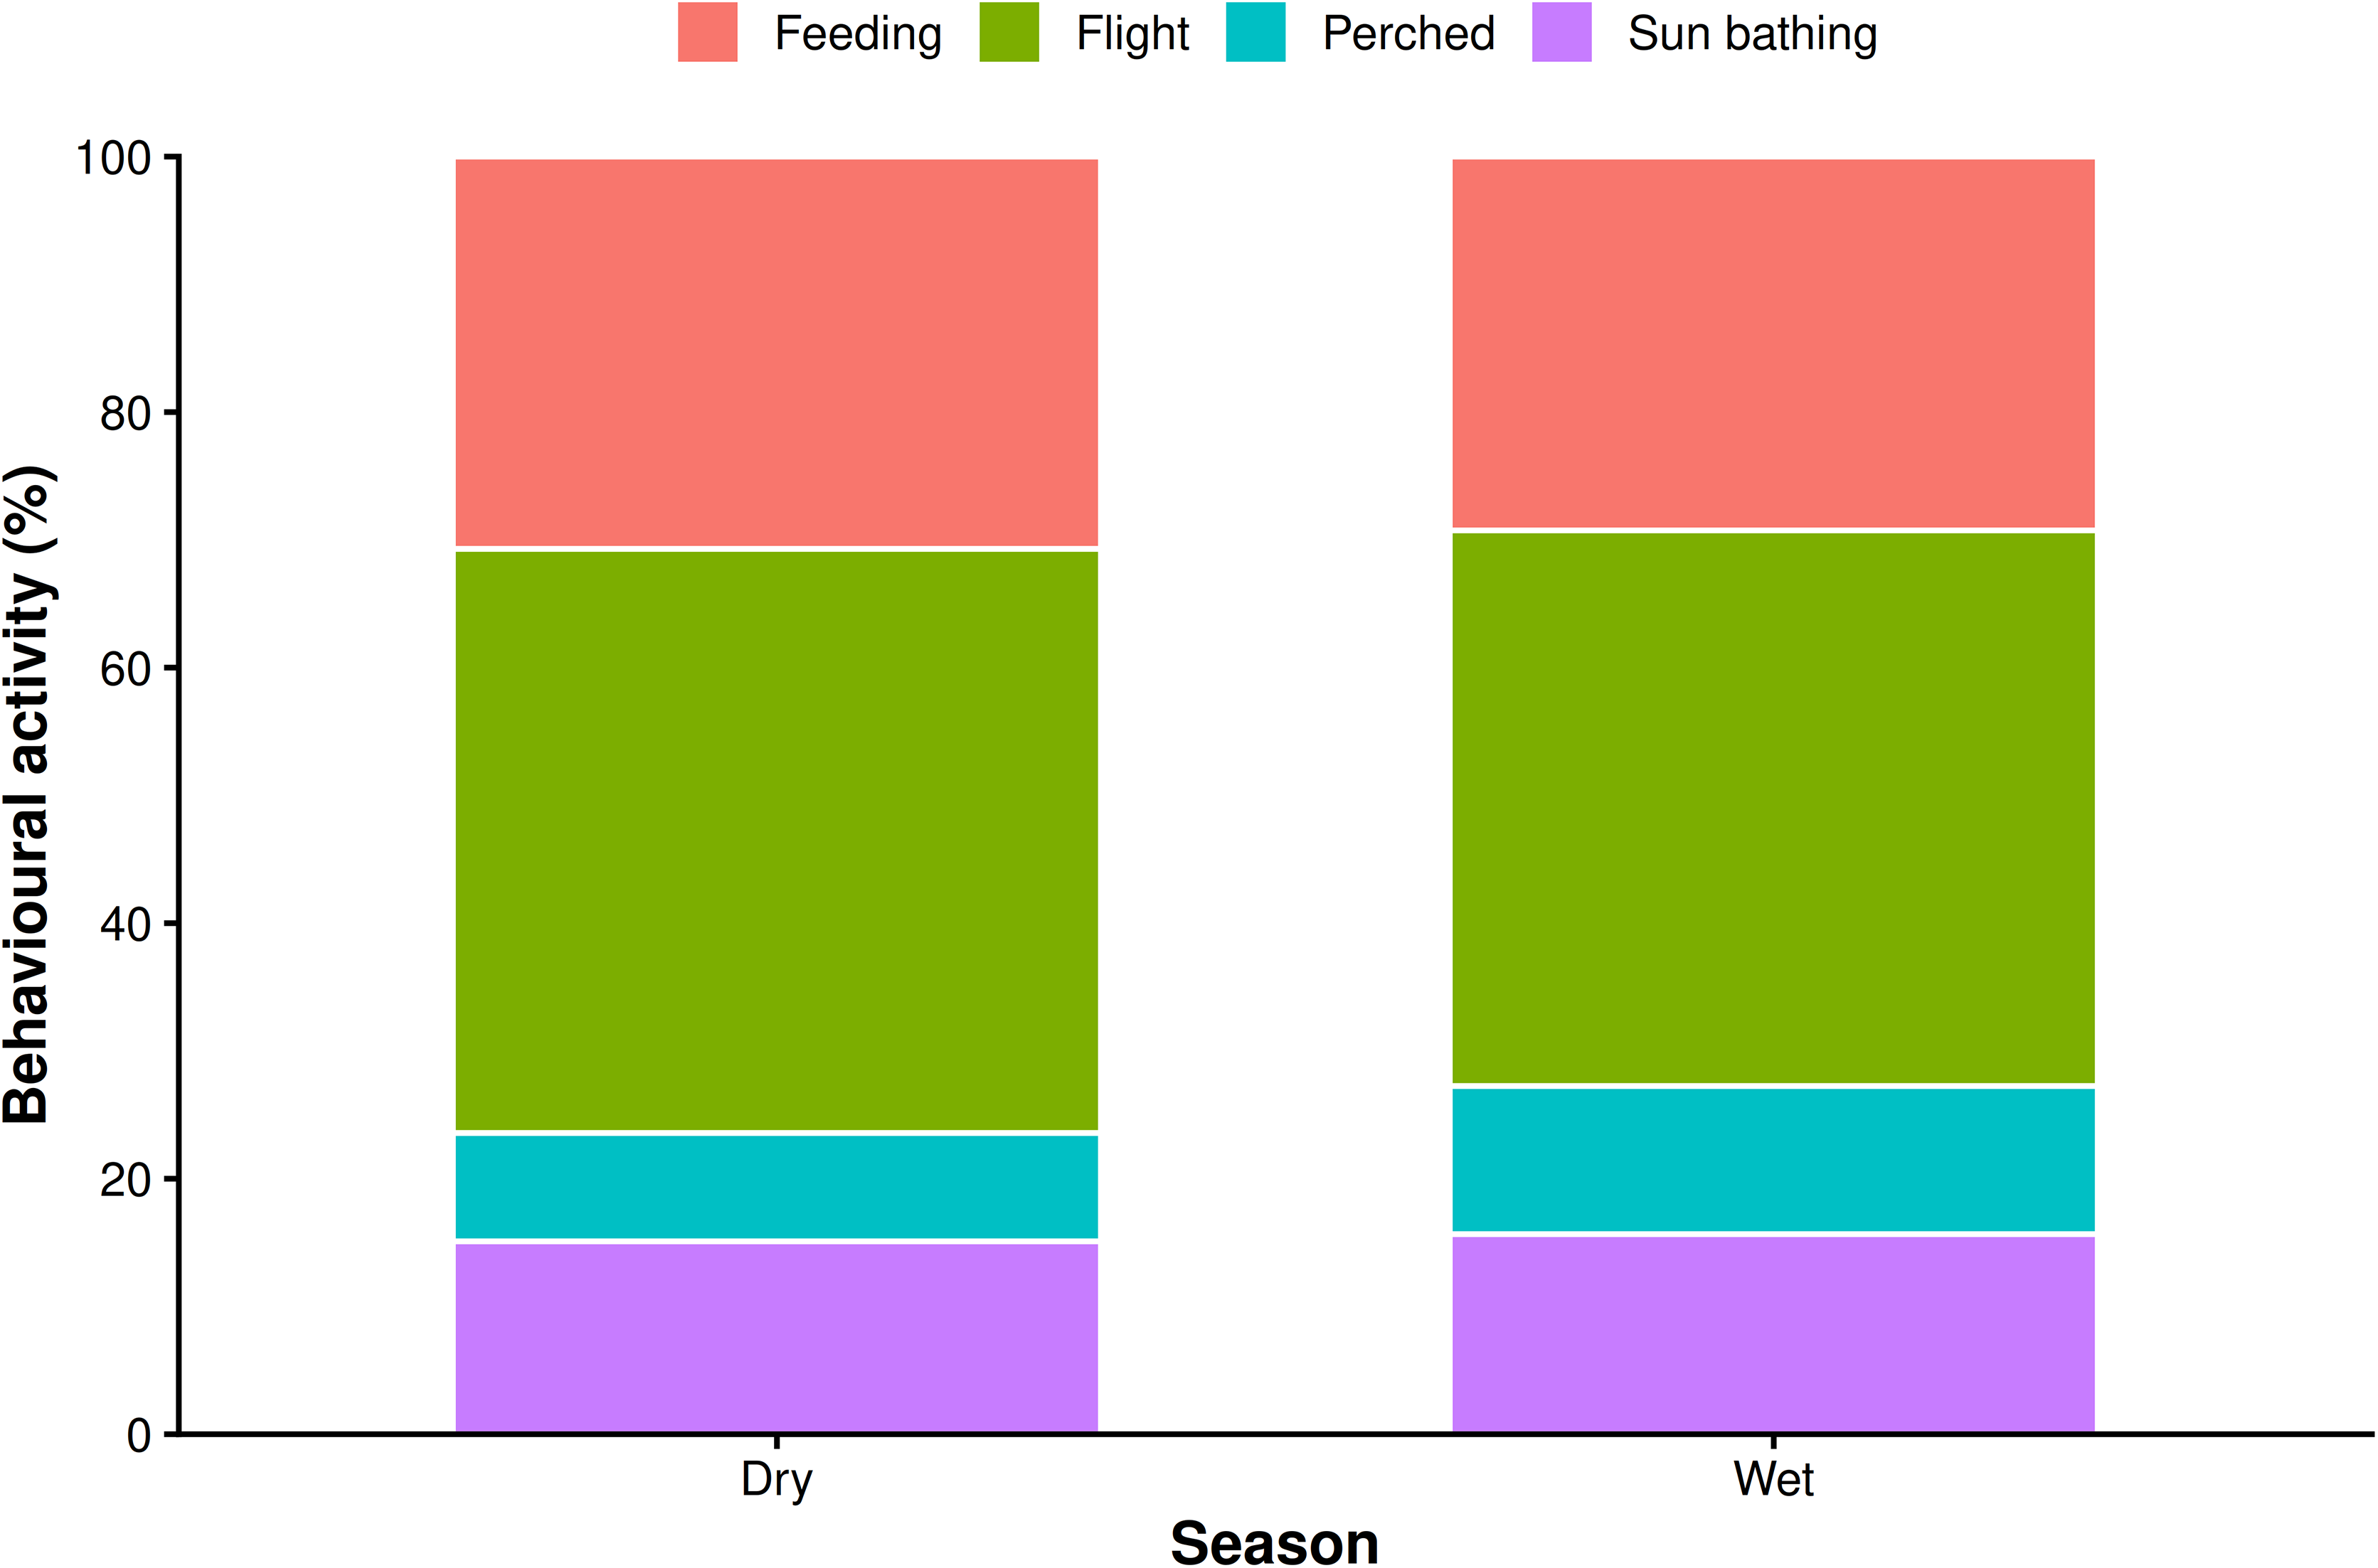
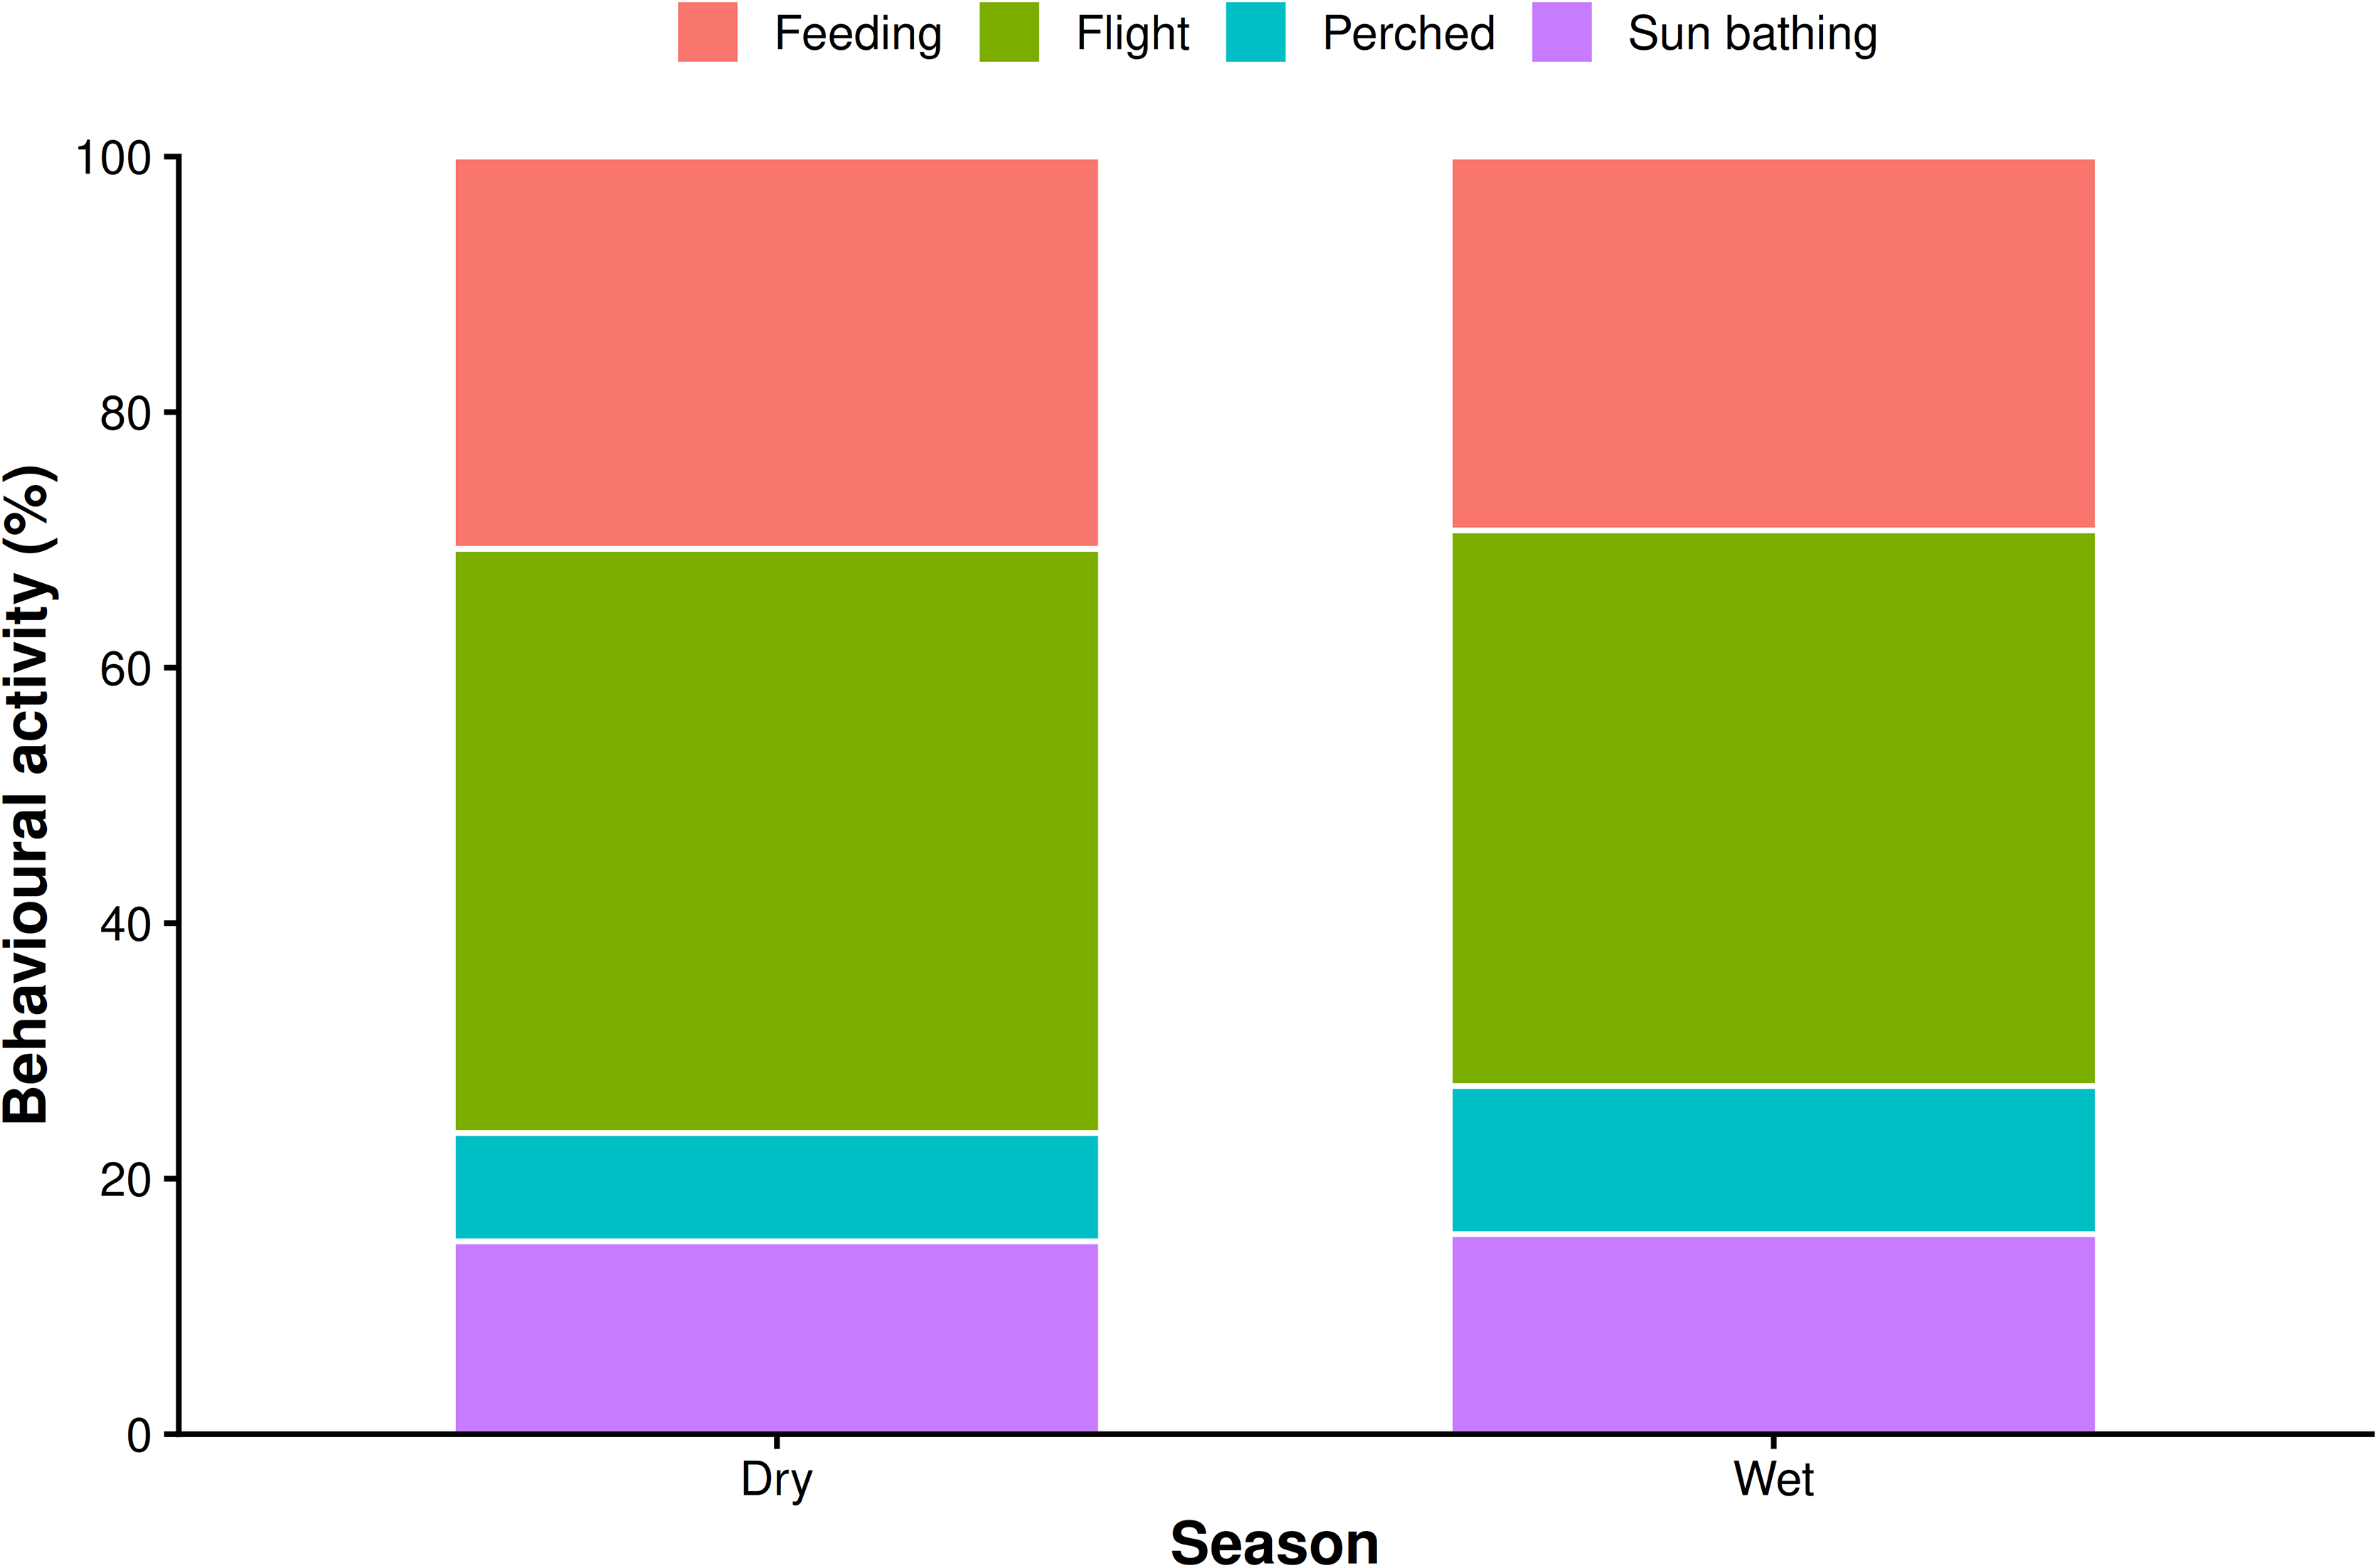
Butterfly behavioural activity varied significantly between dry and wet seasons (Table 2; Figure 4). Proportional representation of butterfly behavioural activities showed some seasonal variation in activity structure (Figure 4). Flight was the most frequently recorded activity in both seasons, accounting for 45.7% of observations during the dry season and 43.5% during the wet season, followed by feeding, which accounted for 30.7% and 29.3%, respectively. Perching increased from 8.5% during the dry season to 11.6% during the wet season, whereas sun bathing showed little seasonal change, increasing slightly from 15.1% to 15.7%.
Seasonal variation in butterfly behavioural activities showing the proportional frequencies of feeding, flight, perching and sun bathing during dry and wet seasons.
Multivariate analysis of behavioural composition confirmed a significant overall effect of season (Table 2).
Seasonal and habitat effects on community composition
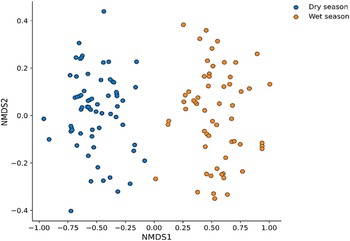
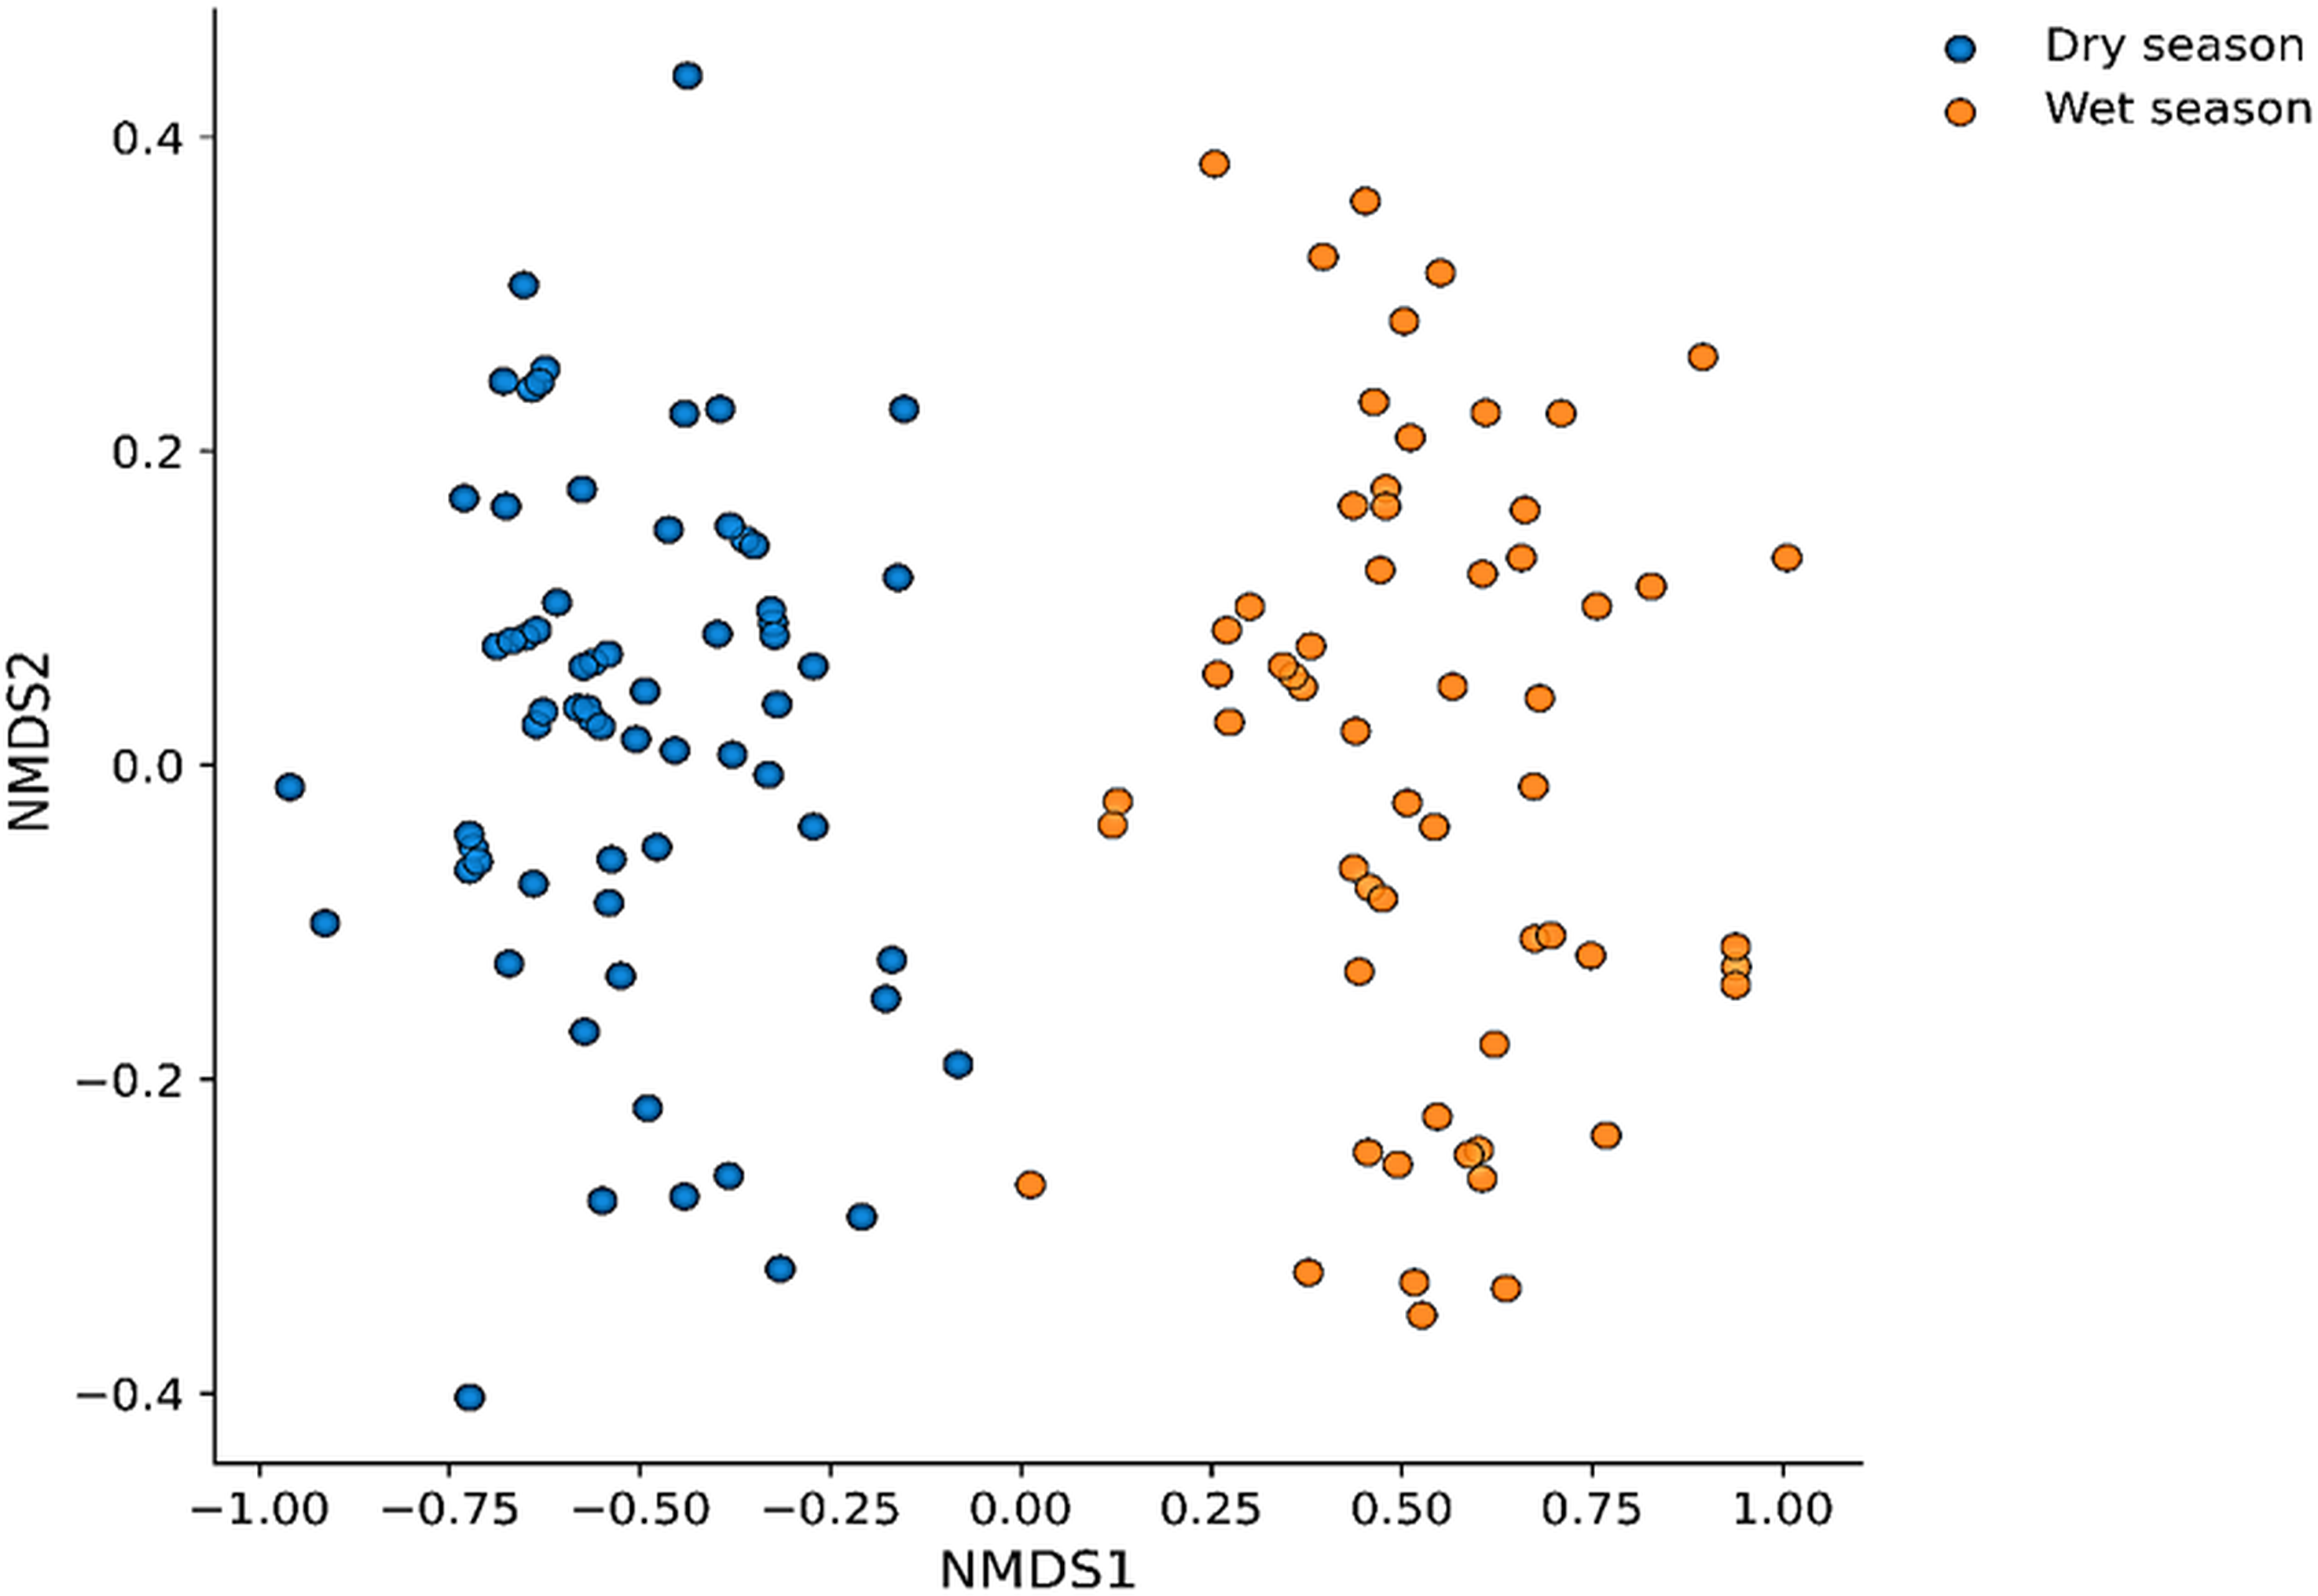
NMDS based on Bray–Curtis dissimilarities revealed clear seasonal structuring of butterfly assemblages (stress = 0.14; Figure 5). Samples collected during the wet season formed partially distinct clusters from those collected during the dry season along the primary ordination axis, indicating pronounced seasonal turnover in community composition.
Non-metric multidimensional scaling (NMDS) ordination illustrating butterfly community composition during dry and wet seasons. Points representing wet-season samples cluster separately from dry-season samples, indicating seasonal turnover in community composition.
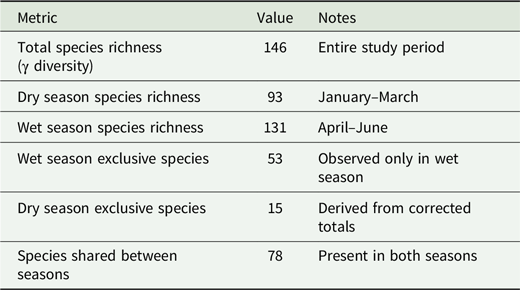
Seasonal turnover statistics supported the ordination results (Table 4). Of the 146 butterfly species recorded, 53 occurred exclusively during the wet season, whereas only 15 species were restricted to the dry season. Seventy-eight species were shared between both seasons, demonstrating that seasonal turnover involved both species replacement and persistence of a core assemblage.
Seasonal species turnover and composition of butterfly assemblages between dry and wet periods in Kakamega Forest, Kenya (2024), showing gamma diversity, shared species, and season-exclusive taxa. Values are species-level counts based on pooled occurrences across habitats
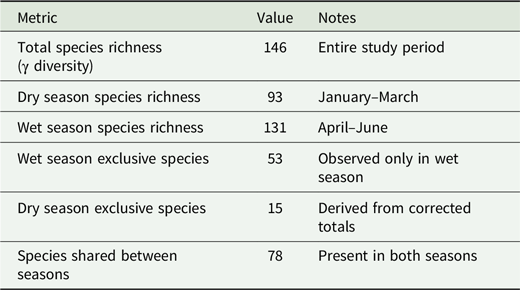
Table 4. Long description
A table comparing butterfly species richness between dry and wet seasons in Kakamega Forest, Kenya. The table has 6 rows and 3 columns. The columns are labeled Metric, Value, and Notes. The rows are as follows: Row 1: Metric, Total species richness (gamma diversity); Value, 146; Notes, Entire study period. Row 2: Metric, Dry season species richness; Value, 93; Notes, January-March. Row 3: Metric, Wet season species richness; Value, 131; Notes, April-June. Row 4: Metric, Wet season exclusive species; Value, 53; Notes, Observed only in wet season. Row 5: Metric, Dry season exclusive species; Value, 15; Notes, Derived from corrected totals. Row 6: Metric, Species shared between seasons; Value, 78; Notes, Present in both seasons.
In contrast, samples from different forest cover types exhibited substantial overlap in ordination space, indicating comparatively weak habitat-associated differentiation. PERMANOVA further confirmed that season explained a greater proportion of variation in community composition than habitat type, while the interaction between season and habitat type was not significant (Table 2). Together, these findings demonstrate that temporal variation associated with seasonal climatic change exerted a stronger influence on butterfly community composition than spatial differences among habitat types.
Environmental drivers of butterfly abundance
Generalised linear mixed models identified moisture-related variables as the principal drivers of butterfly abundance (Table 2). One-month-lagged precipitation emerged as the strongest predictor (β = 0.62 ± 0.08, p < 0.001), followed by contemporaneous precipitation (β = 0.41 ± 0.10, p = 0.003) and relative humidity (β = 0.28 ± 0.09, p = 0.015). In contrast, temperature and wind speed did not contribute significantly after accounting for moisture-related variables.
Model predictions showed positive relationships between butterfly abundance and increasing rainfall, particularly when rainfall was incorporated as a one-month lag. These results indicate that butterfly populations responded more strongly to antecedent environmental conditions than to contemporaneous weather, suggesting indirect effects mediated through vegetation productivity and resource availability. Overall, the environmental models reinforce the importance of rainfall-mediated environmental filtering in structuring butterfly communities within the Kakamega Forest ecosystem.
Discussion
The present study demonstrates that seasonal climatic variation exerts a stronger influence on butterfly communities than habitat heterogeneity within the Kakamega Forest ecosystem. Across six contrasting forest cover types, season consistently explained a greater proportion of the variation in butterfly abundance, species richness, diversity, behavioural activity and community composition than habitat type. Moreover, the absence of significant season × habitat interactions indicates that butterfly assemblages responded similarly to seasonal climatic transitions irrespective of habitat characteristics. Together, these findings support the environmental filtering hypothesis and indicate that temporal climatic variability is a dominant driver of butterfly community dynamics in this tropical rainforest landscape.
The pronounced seasonal responses observed are consistent with current understanding of tropical insect ecology. Butterflies are highly responsive to environmental fluctuations because their development, survival, reproduction and phenology are closely linked to climatic conditions and resource availability (da Silva et al. Reference da Silva, Fialho, Primo, Filho, Rezende, Campanha, de Souza Barros and de Oliveira2024; Gotthard et al. Reference Gotthard, Berger and Rohner2026; Halali et al. Reference Halali, Halali, Barlow, Molleman, Kodandaramaiah, Brakefield and Brattström2021). Rainfall is particularly important because it stimulates leaf flushing, flowering and nectar production, thereby increasing the availability of larval host plants and adult food resources (Bonebrake et al. Reference Bonebrake, Boggs, Stamberger, Deutsch, Ehrlich and Green2014; Miya et al. Reference Miya, Shrestha, Dhakal, Shrestha, Karki, Thapa, Simkhada, Chataut, Tamang and Chhetri2025). The marked increase in butterfly abundance, species richness and diversity following the onset of the long rains therefore most likely reflects enhanced resource availability rather than direct physiological responses to rainfall itself. Comparable rainfall-driven seasonal dynamics have been reported from tropical forests in Southeast Asia, South America and Nepal (Grøtan et al. Reference Grøtan, Lande, Engen, Sæther and Devries2012; Hamer et al. Reference Hamer, Hill, Mustaffa, Benedick, Sherratt, Chey and Maryati2005; Miya et al. Reference Miya, Shrestha, Dhakal, Shrestha, Karki, Thapa, Simkhada, Chataut, Tamang and Chhetri2025), suggesting that the mechanisms observed in Kakamega are broadly representative of tropical butterfly communities.
The environmental models provide further support for this interpretation. Among all climatic variables examined, one-month-lagged precipitation emerged as the strongest predictor of butterfly abundance, exceeding the explanatory power of contemporaneous rainfall and other environmental variables. This lagged response is ecologically plausible because precipitation initiates vegetation growth, leaf production and flowering before influencing butterfly populations through increased larval survival and adult resource availability. Consequently, butterfly populations respond to the ecological consequences of rainfall rather than to rainfall itself. Similar delayed responses have been documented in tropical insect communities, where climatic variability influences herbivores indirectly through vegetation-mediated pathways (Eckert et al. Reference Eckert, Gaigher, Pryke and Samways2022; Grøtan et al. Reference Grøtan, Lande, Engen, Sæther and Devries2012; Maicher et al. Reference Maicher, Sáfián, Murkwe, Przybyłowicz, Janeček, Fokam, Pyrcz and Tropek2018). Relative humidity also contributed significantly to butterfly abundance, reflecting its importance in maintaining insect water balance, flight performance and survival under tropical conditions (Bonebrake et al. Reference Bonebrake, Ponisio, Boggs and Ehrlich2010; Gotthard et al. Reference Gotthard, Berger and Rohner2026). In contrast, temperature and wind speed explained little additional variation once moisture-related variables were included, probably because thermal conditions remained comparatively stable throughout the study period.
Although habitat type significantly affected butterfly abundance and diversity, its influence was consistently weaker than that of season. Natural and secondary forests supported the highest butterfly abundance and diversity, whereas Bischofia javanica plantations and shamba agroforestry systems generally supported fewer species and individuals. These differences are consistent with extensive evidence showing that structurally complex forests provide greater habitat heterogeneity, more stable microclimates and a wider diversity of host plants and nectar resources than simplified land-use systems (Boyle et al. Reference Boyle, Bonebrake, Dias da Silva, Dongmo, Machado França, Gregory, Kitching, Ledger, Lewis, Sharp, Stork, Williamson and Ashton2025; Eckert et al. Reference Eckert, Gaigher, Pryke and Samways2022; Maicher et al. Reference Maicher, Sáfián, Murkwe, Przybyłowicz, Janeček, Fokam, Pyrcz and Tropek2018; Wagner et al. Reference Wagner, Habel, Fungomeli, Teucher and Schmitt2026). Within the Kakamega Forest landscape, the structural complexity of natural and regenerating forests is therefore likely to buffer butterfly populations against environmental stress while supporting a broader range of ecological niches (Obonyo et al. Reference Obonyo, Tsingalia and Agevi2023). Nevertheless, the relatively modest effect sizes associated with habitat type indicate that these spatial differences were superimposed upon a stronger landscape-wide seasonal signal. Even habitats that differed markedly in vegetation structure exhibited parallel increases in butterfly abundance and diversity following the onset of the long rains, suggesting that regional climatic processes can temporarily override local habitat effects.
A particularly noteworthy result was the absence of significant season × habitat interactions across all major community metrics. Had habitat characteristics strongly modified seasonal responses, seasonal changes would have differed among habitat types. Instead, butterfly assemblages responded consistently across the landscape despite substantial differences in vegetation structure and land-use intensity. This finding provides strong empirical support for environmental filtering theory by demonstrating that broad-scale climatic conditions constrain community structure irrespective of local habitat context. It also suggests that seasonal rainfall acts as a synchronising force across the landscape, producing remarkably consistent community responses in both relatively undisturbed forests and more heavily modified habitats.
Seasonal changes in behavioural activity provide additional insight into the mechanisms underlying these community responses. Feeding and mating increased substantially during the wet season, whereas resting and basking were more common during the dry season. Increased feeding activity is likely to reflect greater nectar availability associated with widespread flowering after the onset of the rains, while increased mating suggests that butterflies concentrate reproductive effort during periods of favourable environmental conditions. Conversely, the predominance of resting and basking during the dry season probably represents behavioural strategies that conserve energy and facilitate thermoregulation when resources are limited. Such behavioural plasticity is widely recognised as an important mechanism enabling butterflies to cope with seasonal environmental variability (Halali et al. 2021; Tsai et al. Reference Tsai, Childers, Shi, Ren, Pelaez, Bernard, Pierce and Yu2020).
Community composition also changed substantially between seasons. The clear separation of dry- and wet-season assemblages in the NMDS ordination, together with the large number of season-exclusive species, indicates pronounced temporal turnover within the butterfly fauna. Seasonal changes in community composition probably reflect differences in emergence phenology, reproductive timing, resource availability and species-specific environmental tolerances. Importantly, rarefaction analyses demonstrated that the higher richness observed during the wet season was not an artefact of increased sampling effort, confirming that seasonal differences represented genuine ecological change. These findings reinforce the importance of incorporating temporal replication into biodiversity surveys, as assessments conducted during a single season are likely to underestimate both species richness and community turnover.
The results have important implications for biodiversity conservation in tropical forests. Conservation strategies have traditionally focused on maintaining habitat quality and landscape connectivity, often assuming that habitat structure is the principal determinant of biodiversity. While habitat integrity remains fundamental, the present study demonstrates that temporal climatic variability can exert an equally important, and in this case stronger, influence on butterfly communities. Effective conservation planning should therefore recognise the importance of ecological processes that sustain seasonal resource availability, including the maintenance of diverse flowering plants and larval host species throughout the year. These considerations are becoming increasingly important as climate change alters rainfall patterns and the timing of seasonal resource pulses across tropical Africa (IPCC 2021).
Projected increases in rainfall variability, prolonged droughts and more frequent extreme weather events may disrupt the synchrony between butterfly life cycles and resource availability, with consequences for reproduction, population persistence and community composition. Because butterfly communities in Kakamega responded primarily to rainfall-mediated environmental conditions, changes in seasonal precipitation regimes may alter ecological dynamics even where habitat structure remains relatively intact. Maintaining structurally diverse forests capable of buffering climatic extremes may therefore become increasingly important for sustaining butterfly populations under future climate scenarios.
Several limitations should be acknowledged. First, the study encompassed a single dry-to-wet seasonal transition and therefore did not capture interannual climatic variability. Second, although repeated surveys provided excellent temporal resolution, spatial replication was limited to two transects per habitat type. Finally, the analyses focused on community-level responses rather than species-specific demographic processes or host-plant associations that may explain differences among taxa. Long-term monitoring across multiple years, together with studies integrating butterfly demography, plant phenology and host-plant availability, would provide a more comprehensive understanding of the mechanisms linking climatic variability to tropical butterfly communities.
Overall, this study provides strong evidence that temporal climatic variation is a primary determinant of butterfly community structure within the Kakamega Forest ecosystem. By demonstrating that seasonal transitions exert stronger effects than habitat type on butterfly abundance, diversity, behaviour and community composition, the study highlights the central role of environmental filtering in tropical insect ecology. These findings also emphasise that biodiversity monitoring programmes should explicitly incorporate seasonal dynamics if they are to provide reliable assessments of ecological change under an increasingly variable climate.
Conclusions
This study demonstrates that seasonal climatic variation is a stronger determinant of butterfly community dynamics than habitat type within the Kakamega Forest ecosystem. Across six contrasting forest cover types, the transition from the dry season to the onset of the long rains consistently produced larger changes in butterfly abundance, species richness, diversity, behaviour and community composition than differences among habitats. Although natural and secondary forests supported relatively richer and more abundant butterfly assemblages than plantation and agroforestry habitats, the influence of habitat heterogeneity was consistently secondary to that of seasonal environmental change.
The study further showed that butterfly communities responded remarkably consistently to seasonal transitions across habitats. The absence of significant season × habitat interactions indicates that the onset of the rainy season triggered broadly synchronous responses throughout the landscape, irrespective of forest cover type. This finding provides strong empirical support for the environmental filtering hypothesis, suggesting that regional climatic conditions impose broad ecological constraints that override many local habitat differences during seasonal transitions.
Moisture-related environmental variables, particularly one-month-lagged precipitation, emerged as the strongest predictors of butterfly abundance. These results indicate that butterflies respond primarily to rainfall-mediated changes in vegetation productivity, host-plant availability and floral resource dynamics rather than to immediate changes in weather conditions. The observed lag effect highlights the importance of indirect ecological pathways linking climate, plant phenology and insect population dynamics.
Seasonal changes also extended beyond community structure to butterfly behaviour. Increased feeding and mating activity during the wet season, coupled with greater resting and basking during the dry season, demonstrate that butterflies adjust their behavioural strategies in response to changing environmental conditions and resource availability. Likewise, the marked seasonal turnover in species composition indicates that many species are active only during particular phases of the annual climatic cycle. These findings emphasise that assessments based on a single sampling season may substantially underestimate butterfly diversity and fail to capture important ecological processes operating within tropical forest ecosystems.
From a conservation perspective, the results underscore the need to integrate temporal ecological dynamics into biodiversity monitoring and management. Conservation planning has traditionally focused on maintaining habitat quality and structural heterogeneity, yet this study demonstrates that preserving the ecological processes underpinning seasonal resource availability may be equally important. As projected climate change is expected to alter rainfall timing, duration and intensity across East Africa, disruptions to seasonal precipitation regimes could affect butterfly populations even where habitat conditions remain relatively intact. Long-term monitoring programmes that explicitly incorporate seasonal climatic variability will therefore be essential for detecting ecological change and informing adaptive conservation strategies.
Overall, this study provides robust evidence that temporal environmental variability plays a dominant role in structuring tropical butterfly communities within the easternmost Guineo–Congolian rainforest. By demonstrating that seasonal climatic transitions consistently outweigh habitat differences in shaping butterfly abundance, diversity, behaviour and community composition, the study contributes new empirical evidence from tropical Africa to the growing body of literature highlighting the central importance of climatic seasonality in insect ecology. These findings reinforce the need for biodiversity monitoring programmes and conservation policies that explicitly recognise the dynamic nature of tropical ecosystems under increasingly variable climatic conditions.
Effects of climatic variables and habitat type on butterfly abundance derived from the best-supported generalised linear mixed-effects model (GLMM). (a) Standardised regression coefficients (β) with 95% confidence intervals; significance levels are indicated by ***P < 0.001, *P < 0.01, P < 0.05 and ·P < 0.10. (b) Predicted relationship between one-month-lagged precipitation and butterfly abundance. (c) Predicted relationship between contemporaneous precipitation and butterfly abundance. Shaded bands represent 95% confidence intervals.
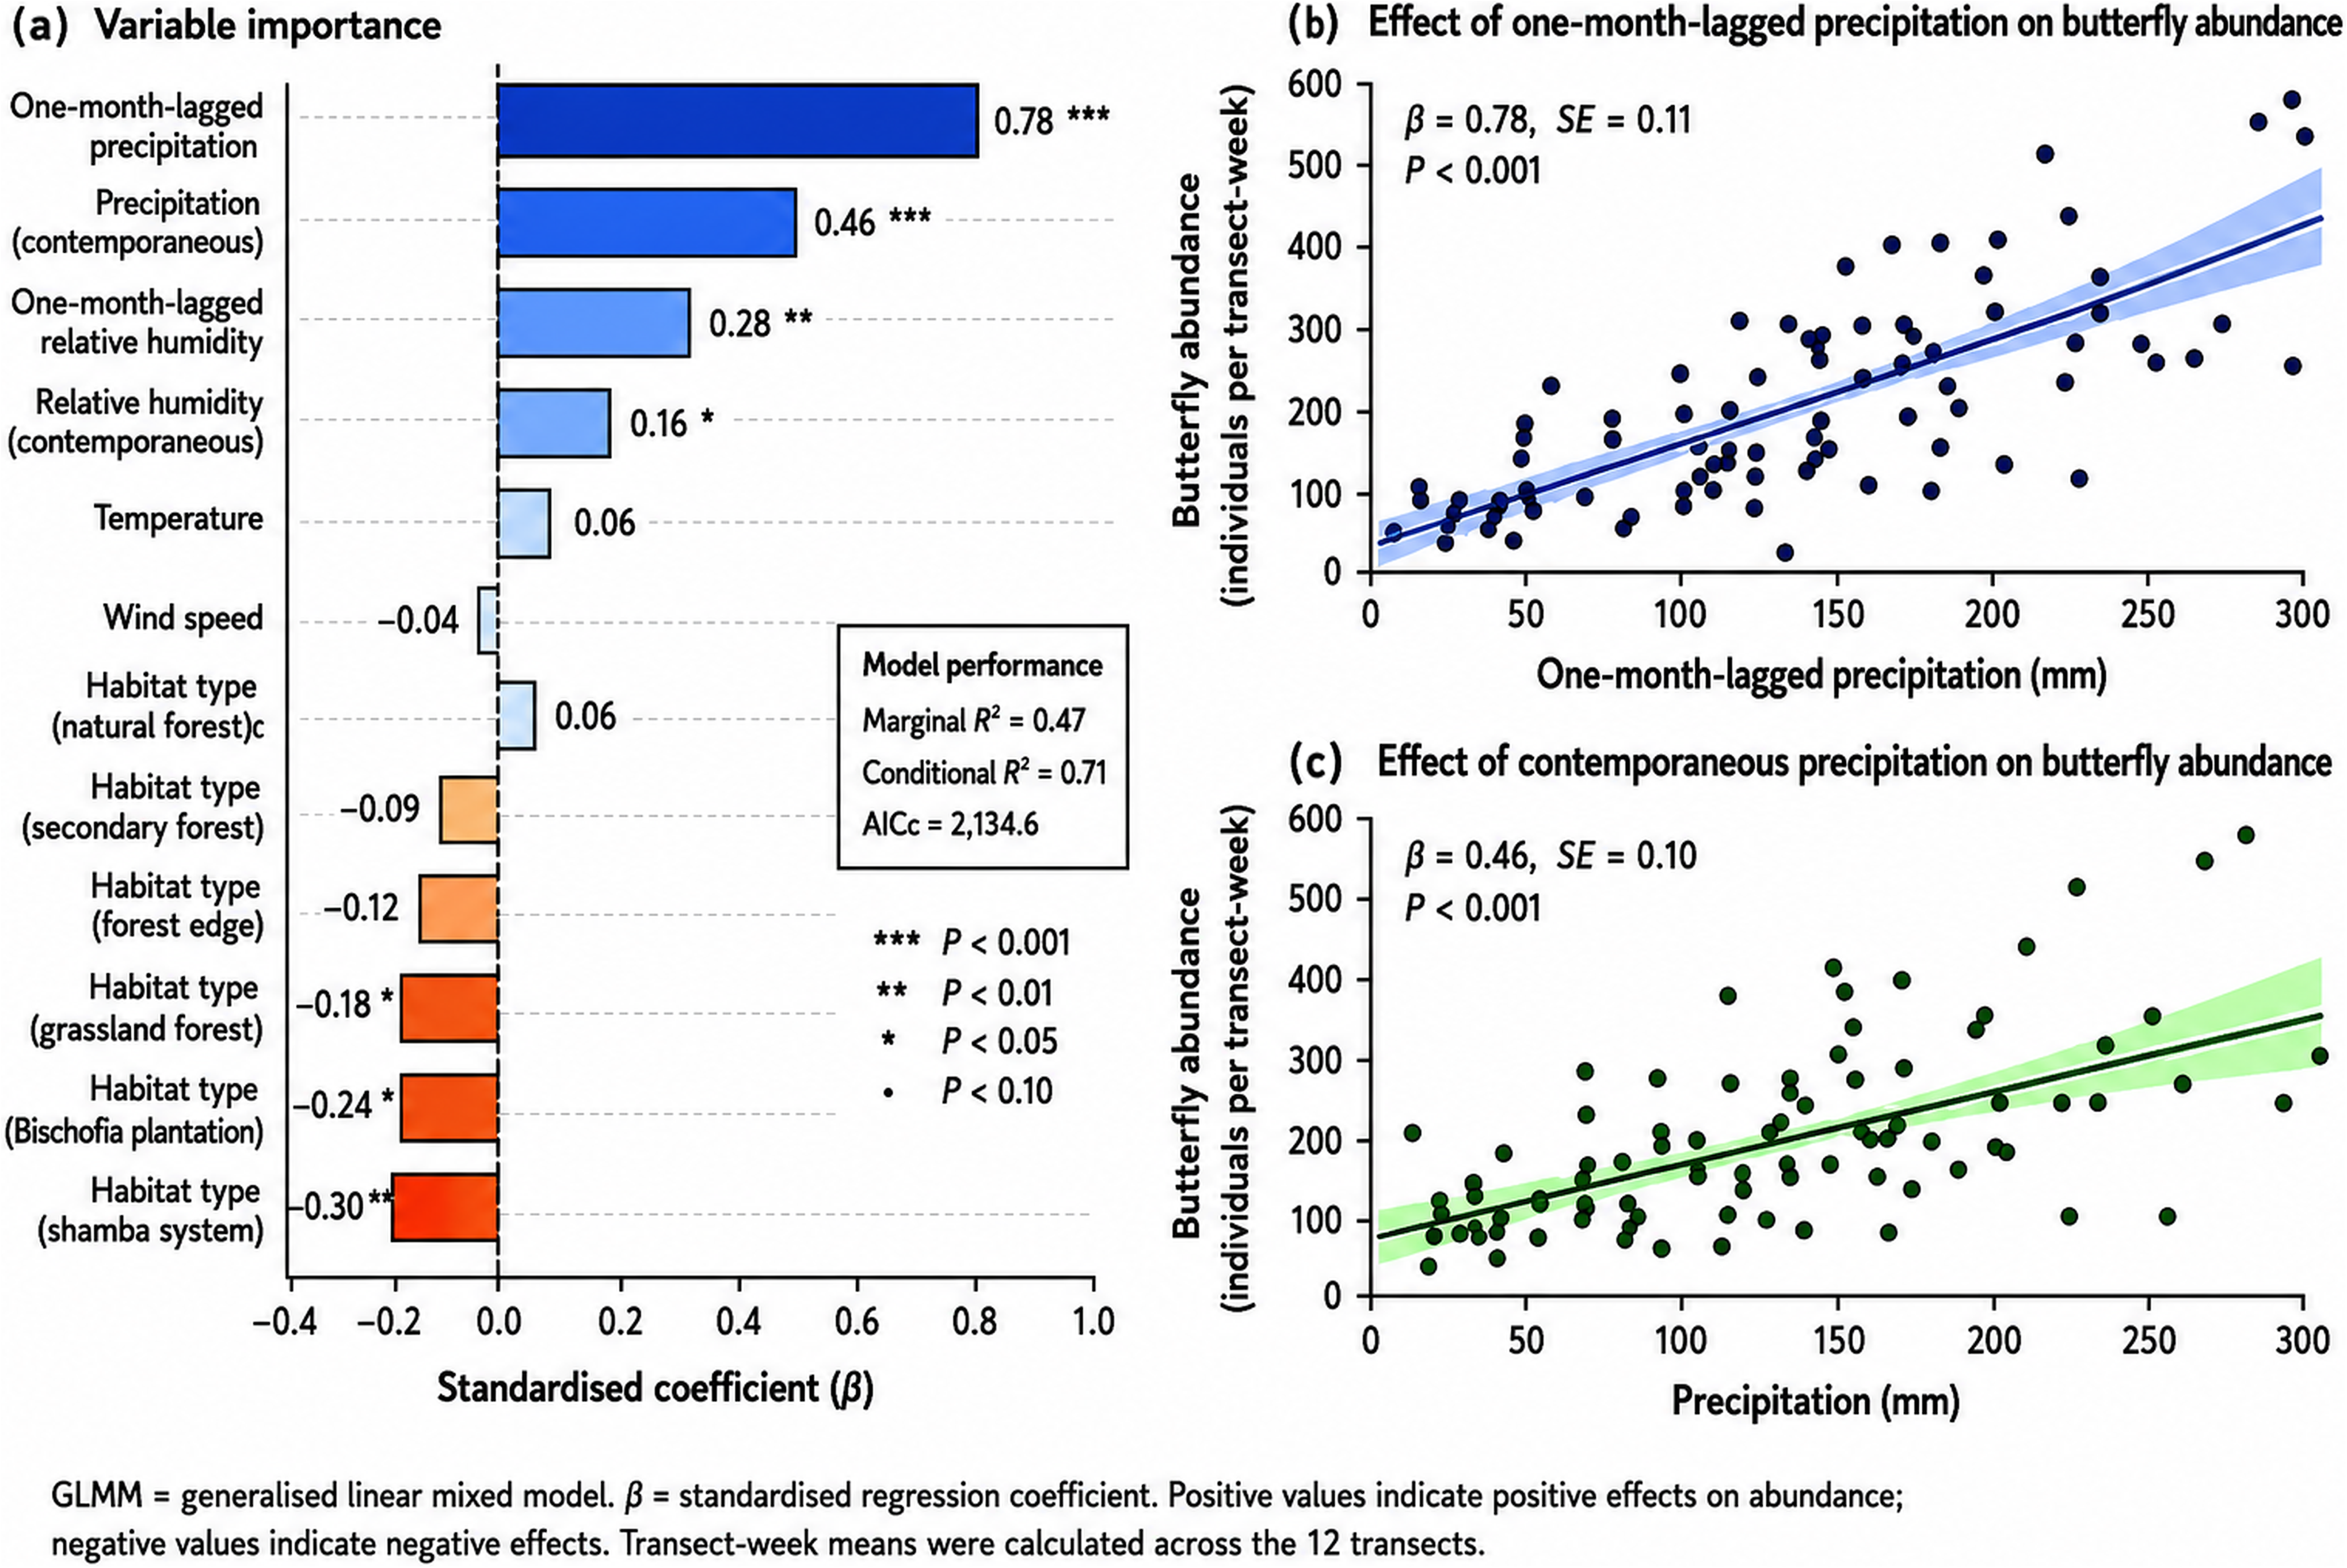
Figure 6. Long description
Panel A: A horizontal bar graph displays the standardized regression coefficients (β) with 95% confidence intervals for various climatic variables and habitat types. The x-axis represents the standardized coefficient (β), and the y-axis lists the variables. Positive values indicate positive effects on butterfly abundance, while negative values indicate negative effects. Significant levels are marked with asterisks. Panel B: A scatter plot shows the predicted relationship between one-month-lagged precipitation and butterfly abundance. The x-axis is labeled ‘One-month-lagged precipitation (mm)’, and the y-axis is labeled ‘Butterfly abundance (individuals per transect-week)’. A trend line with a shaded 95% confidence interval is included. Panel C: Another scatter plot illustrates the predicted relationship between contemporaneous precipitation and butterfly abundance. The x-axis is labeled ‘Precipitation (mm)’, and the y-axis is labeled ‘Butterfly abundance (individuals per transect-week)’. A trend line with a shaded 95% confidence interval is also included.
Acknowledgements
We thank Nixon Sajita for invaluable field assistance throughout data collection. We are grateful to Masinde Muliro University of Science and Technology (MMUST) and its Department of Biological Sciences for institutional support and to the Kenya Wildlife Service (KWS) for permission to conduct fieldwork in Kakamega Forest.
Financial support
This research received no specific grant from any funding agency, commercial or not-for-profit sectors.
Competing interests
The authors declare none.
AI use statement
AI assistance was employed for the following specific tasks: restructuring and editing of manuscript text for clarity, flow, and consistency with journal style; drafting and refining the point-by-point response to reviewer and editor comments; formatting of the reference list in Cambridge A style; and assistance with literature searching to identify relevant citations.
All scientific content, data collection and analysis, interpretation of results, and intellectual conclusions are entirely the work of the named authors. No AI tool was used to generate, fabricate, or substitute for any research data or findings. All AI-generated text was critically reviewed, substantially revised, and verified for accuracy by the authors before incorporation into the manuscript. The authors take full responsibility for the integrity, accuracy, and originality of this work, including all portions that were assisted by AI tools.