Implications
Replacing soya bean meal with dehydrated lucerne as a protein source for dairy cows receiving grass silage- or maize silage-based diets probably has little effect on methane emissions, but results in a shift from urinary N to faecal N losses, which may prove environmentally positive. Dehydrated lucerne and grass silage also lead to improved milk fatty-acid composition because of higher linolenic acid content.
Introduction
Reducing environmental impacts is a major issue for livestock farming. Some of the impacts are from the animals and from animal feeds and associated upstream processes (Steinfeld et al., Reference Steinfeld, Gerber, Wassenaar, Castel, Rosales and De Haan2006). Major compounds derived from animal production that have a negative environmental impact are methane (CH4), produced by rumen fermentation (Martin et al., Reference Martin, Morgavi and Doreau2010) and by faecal organic matter (OM) fermentation, and nitrous oxide and ammonia, produced from faecal and urinary N by different microbial mechanisms in soils (Schils et al., Reference Schils, Eriksen, Ledgard, Vellinga, Kuikman, Luo, Petersen and Velthof2013). Strategies have been proposed for mitigating emission of these pollutants, among which changes in animal feeding may be promising, but such changes will find practical use only if they do not impair animal performance or other characteristics, such as product quality. Studies are often focused either on mitigating enteric CH4 or on decreasing urinary N, but a holistic approach is less frequent. We analysed the effects of protein source on animal performance, manure composition and enteric CH4 emission.
The most common protein sources for ruminant diets are oilseed by-products, primarily soya bean. In several countries, dehydrated lucerne is used as a protein-rich concentrate feed. Dehydrated lucerne is an alternative to lucerne hay or silage in countries where cropping lucerne is not possible in cattle farming areas, or where feed production is remote from livestock production (e.g. Spain, France). It has been shown that dehydrated lucerne, despite its low energy value, is a valuable protein source that does not have an impact on dairy cow performance when used as concentrate replacement at an inclusion level of up to 25% of total diet on a dry matter (DM) basis (Christensen and Cochran, Reference Christensen and Cochran1983; Price et al., Reference Price, Satter and Jorgensen1988). Lucerne also contains significant amounts of linolenic acid, and its inclusion in the diet of dairy cows improves milk fatty-acid (FA) composition, although published data remain scarce. Linolenic acid potentially has positive effects on human health (Riediger et al., Reference Riediger, Othman, Suh and Moghadasian2009). Increasing beneficial FAs in milk by dietary means is limited, but it may contribute to a nutritional improvement of the human diet. It has been suggested that feeding lucerne could reduce CH4 emissions compared with grass. Although no specific effect of legumes was evidenced in a recent meta-analysis on temperate forages (Archimède et al., Reference Archimède, Eugène, Marie Magdeleine, Boval, Martin, Morgavi, Lecomte and Doreau2011), a mitigating effect of lucerne on pasture was shown by McCaughey et al. (Reference McCaughey, Wittenberg and Corrigan1999) when lucerne partially replaced grasses. The use of lucerne may also lower nitrous oxide emissions through the absence of N fertilisation (Rochette and Janzen, Reference Rochette and Janzen2005). When excreted by animals, mineral forms such as ammonia N result in higher nitrous oxide emissions than organic forms (Eckard et al., Reference Eckard, Grainger and de Klein2010), and volatilise ammonia, unlike organic forms. These possible decreases in emissions may be offset by the energy cost of dehydration (Nguyen et al., Reference Nguyen, van der Werf, Eugène, Veysset, Devun, Chesneau and Doreau2012), but dehydration companies are making progress in lowering this cost. At the animal level, a deeper understanding is needed of how using dehydrated lucerne affects CH4 emissions and N losses.
Our objective was to compare the environmental impact of dehydrated lucerne and soya bean meal by determining their effects on CH4 emissions and faecal and urinary N output by dairy cows fed diets based on either maize silage or grass silage. Milk production and FA composition, together with diet digestibility, were measured to provide a general evaluation of these nutritional strategies.
Material and methods
Experimental design, animals and feeding
Eight primiparous Holstein cows were used after peak lactation in a replicated 4×4 Latin square design, with two cows receiving the same diet at each period. Average cow liveweight was 582±38 kg, and cows were 148±14 days in milk at mid-experiment. Each period lasted 4 weeks, and measurements were taken during the last week. The four diets were based on either maize silage (M) or grass silage (G), and the main protein source was either soya bean meal completed with beet pulp (SP) or dehydrated lucerne (L), forming diets MSP, ML, GSP and GL.
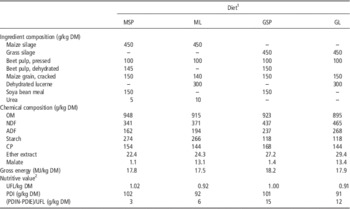
Diets were calculated so that forage-to-concentrate ratio (45 : 55) was the same for each diet, to limit possible bias in rumen function owing to a difference in the proportion of concentrate. All diets contained more than 34% NDF on a DM basis to minimise the risk of acidosis. Slowly degradable starch was supplied by all four diets, and the starch proportion was similar for the same forage. Dietary protein was not limiting for milk production and was similar for the same forage. In each diet, ~45% of CP was supplied by either soya bean meal or dehydrated lucerne. As a consequence, diets contained either 30% of dehydrated lucerne or 15% soya bean meal completed with 15% beet pulp. Beet pulp was chosen because it was rich in NDF, although NDF in beet pulp is more digestible than that in lucerne. However, as protein content of dehydrated lucerne is much lower than that of soya bean meal, a difference in CP and PDI between L and SP diets could not be avoided. In the same way, when forages were compared, grass silage was substituted with maize silage plus urea to avoid a difference in ruminal degradable protein. Diet composition was calculated using the French feeding systems, UFL as net energy unit corresponding to 7.106 MJ net energy for lactation, and PDI as digestible protein unit (INRA, 2007). The ratio between digestible protein and net energy of the diet, PDI/UFL, and the available fermentable N in the rumen estimated as (PDIN-PDIE)/UFL, were similar in all four diets. Maize silage was harvested at the vitreous stage in excellent growing conditions (45% average DM content). Grass was a semi-mountain natural grassland (altitude 850 m, Auvergne, Central France) harvested as direct cut (average DM content 19%) and ensiled without preservative. Grassland contained more than 80% grasses, the most frequent being Lolium perenne, Dactylis glomerata and Festuca sp. Lucerne was wilted for 12 to 24 h before harvesting, and its DM content was 25% to 35% before dehydration. Air temperature was 400°C to 700°C and 90°C to 120°C at the input and output of the dryer, respectively. After grinding, lucerne was pelleted as 6 mm pellets; protein content was 21.6% of DM. Ingredient composition and chemical composition of diets are presented in Table 1. Chemical composition of forages and concentrates is presented in Supplementary Table S1.
Ingredient and chemical composition of diets

DM=dry matter; OM=organic matter.
1 MSP, maize silage and soya bean meal plus beet pulp; ML, maize silage and dehydrated lucerne; GSP, grass silage and soya bean meal plus beet pulp; GL, grass silage and dehydrated lucerne.
2 UFL and PDI are units for net energy and digestible protein, respectively, in the French feeding systems for ruminants (INRA, 2007); 1 UFL represents 7.106 MJ of net energy; (PDIN-PDIE)/UFL is a criterion of the availability of fermentable N in the rumen calculated from feedstuff N ruminal degradability.
Cows were housed in a tie-stalled barn and thus fed individually. During the last 2 weeks of each experimental period, diet was offered in limited amounts just below voluntary intake, which was determined for each cow during the first 2 weeks of each period. When refusals were observed, they were collected. Animals received 200 g/day of mineral–vitamin premix (Galaphos midi duo, Aurillac, France). The ration was offered twice a day, at 0900 and 1600 h (2/3 and 1/3 of the diet, respectively) as a total mixed ration. Water and a salt block were offered ad libitum.
Milk production and composition
Milk production was determined throughout the experiment. The average for the final week of each period is reported. A milk sample was automatically collected at each milking over 2 days in week 4. A 50 ml aliquot containing potassium bichromate (Merck, Fontenay-sous-Bois, France) was analysed for fat and protein by IR spectrophotometry (MilkoScan; Foss Electric, Hillerod, Denmark). Urea was assayed by p-dimethylaminobenzaldehyde colorimetry (AOAC, 1990). Additional milk samples (3 ml) were collected over two consecutive milkings, stored at −20°C, lyophilised (Thermovac TM-20; Froilabo, Ozoir-La-Ferrière, France), and used to determine FA composition. Lyophilised morning and evening milks were pooled (60 and 40 mg of morning and evening samples, respectively) to provide a daily composite sample for each cow. FAs in 100 mg samples of lyophilised milk were methylated directly, according to Lerch et al. (Reference Lerch, Ferlay, Shingfield, Martin, Pomiès and Chilliard2012). The fatty acid methyl esters (FAMEs) recovered were analysed by GC using a Trace-GC 2000 Series gas chromatograph equipped with a flame ionisation detector (Thermo Finnigan, Les Ulis, France) and a 100 m fused silica capillary column (i.d. 0.25 mm) coated with a 0.2 μm film of cyanopropyl polysiloxane (CP-Sil 88; Chrompack, Middelburg, The Netherlands). Injector temperature was maintained at 250°C and detector temperature at 255°C. The FAMEs were separated using a gradient programme (initial oven temperature 70°C held for 1 min, ramped to 100°C at 5°C/min, held for 2 min, ramped to 175°C at 10°C/min, held for 42 min, and then ramped at 5°C/min to a final temperature of 225°C held for 22 min). Hydrogen was used as carrier and fuel gas. Injector pressure was held at 158.6 kPa. Peaks were routinely identified by comparing retention times against commercial authentic standards.
Feed intake and chemical composition, cow live weight and energy balance
Feed offered and feed refusals were recorded daily. DM content of feeds and refusals was determined on days 2 and 5 of week 4 of each period by oven-drying at 103°C for 24 h. The DM content of silage was corrected for losses of volatile compounds when oven-drying by determining volatile fatty acids (VFAs), alcohols and ammonia in silages, and then applying a coefficient for losses of each component, depending on volatile compounds at harvest and pH of silage (Dulphy and Demarquilly, Reference Dulphy and Demarquilly1981). In this experiment, the coefficient was 1.05 and 1.025 for grass and maize silage, respectively. A daily sample of each feed was taken and then pooled weekly for week 4 of each period, and kept at −20°C for silages and pressed beet pulp and at 4°C for dry feeds until N analysis. A subsample of each feed was dried at 60°C for 48 h, and ground through a 1 mm screen for other chemical analyses.
CP (N×6.25) was determined on fresh samples using the Kjeldahl method. OM was determined by ashing at 550°C for 6 h. NDF and ADF were determined sequentially according to Van Soest et al. (Reference Van Soest, Robertson and Lewis1991) using a stable amylase and exclusive of residual ash. Starch was determined by an enzymatic method (Faisant et al., Reference Faisant, Planchot, Kozlowski, Pacouret, Colonna and Champ1995), gross energy by isoperibolic calorimetry (C200 model; IKA, Staufen, Germany), ether extract using petroleum extract (AOAC, 1990) and malate by an enzymatic method according to Callaway et al. (Reference Callaway, Martin, Wampler, Hill and Hill1997).
The cows were weighed at the beginning of each experimental period and at the end of the experiment. Owing to uncertainty related to BW change measurement in 4-week periods, we estimated the change in body reserves by energy balance. Energy balance, that is, the difference between net energy supply and net energy requirements for maintenance and production, was calculated using the French net energy (UFL) system according to INRA (2007).
Digestibility and N balance
Measurements were made by total collection of faeces and urine for 6 days in week 4 of each period. Urine was separated from faeces by a device maintained around the vulva, and collected in a 30 l bottle containing 500 ml of 10% sulphuric acid. The device was a polyethylene tube connected to a piece of leather, which was stuck with neutral glue to the cow’s skin. Faeces and urine were weighed daily.
A daily sample of 1% of faeces weight was taken for measurement of DM at 103°C for 24 h. A 0.5% daily sample was frozen, and N determined on the pooled sample after thawing. Another 1% daily sample was oven-dried at 60°C for 72 h and then ground through a 1 mm mesh for analyses of N, NDF, ADF and starch, which were performed as described above. An aliquot of 0.5% of urine weight was taken every day and frozen to make up a pooled sample for N determination as described above.
Enteric CH4 production
Enteric CH4 production was measured using the SF6 tracer method according to the procedure described by Martin et al. (Reference Martin, Rouel, Jouany, Doreau and Chilliard2008). Brass permeation tubes (12.5×40 mm i.d.) were loaded with about 600 mg of SF6 at liquid nitrogen temperature (−196°C) and calibrated by regular weighing (twice a week) for an 8-week period. Tubes were kept immersed in a water bath at 39°C. They were then fitted in the rumen 1 week before the first measurements and left in place for the whole experiment. Tube lifetime was 4 months longer than the duration of the experiment. Permeation rate of SF6 from the tubes was on average 1.645 mg/day (s.d. 0.085 mg/day). Representative breath samples from each animal were sampled in pre-evacuated (91.2 kPa) yoke-shaped PVC collection devices (~2.5 l) via capillary and Teflon tubing fitted to a halter, with the sampling tube tip held close to the nostrils. Animals were habituated to the halter 1 week before the beginning of measurements, which were made on 6 successive days in week 4 of each period. The collection devices were changed every day before the morning feeding. The devices containing the samples were immediately transported to the lab and over-pressured with N2 gas to about 142.0 kPa before SF6 and CH4 analyses. Background concentrations of these gases were also measured in ambient air samples collected daily in the shed. Daily CH4 production by each animal was calculated using the known permeation rate of SF6 for each animal and the concentrations (above background) of SF6 and CH4 in the breath samples, as: CH4 (g/day)=SF6 permeation rate (g/day)×[CH4]/[SF6], where gas concentrations were expressed in µg/m3.
Concentrations of SF6 and CH4 in breath and ambient air samples were determined by gas chromatography as described by Martin et al. (Reference Martin, Rouel, Jouany, Doreau and Chilliard2008). A gas chromatograph (CP-9003; Varian-Chrompack, Les Ulis, France) fitted with an electron capture detector and a gas chromatograph (Autosystem XL; Perkin Elmer Instruments, Courtaboeuf, France) fitted with a flame ionisation detector were used to determine SF6 and CH4 concentrations, respectively. The samples were run on chromatographs equipped either with a molecular sieve 0.5 nm column (3 m×3.2 mm i.d.) maintained at 60°C for the SF6 analysis, or with a Porapak N 80-100 mesh column (3 m×3.2 mm i.d.) maintained at 40°C for the CH4 analysis. Flow rate of the carrier gases was 30 ml/min of N2 for the SF6 analysis and 40 ml/min of He for the CH4 analysis. Chromatographic analyses were performed after calibration with standard gases (Air Liquide, Mitry-Mory, France) for SF6 (202 ppt) and CH4 (99.9 ppm).
Rumen fermentation
On day 6 in week 4 of each period, a 50 ml sample of rumen liquid was taken by rumenocentesis at 1100 h. Ruminal pH was immediately determined under magnetic stirring with a digital pH-meter (Ag/AgCl electrode). The liquid was then filtered (250 µm nylon filter). A 0.8 ml sample was conserved with 0.5 ml of a 0.5 N HCl solution containing 2% (w/v) metaphosphoric acid and 0.4% (w/v) crotonic acid, and then frozen for VFA analysis. A 5 ml sample was conserved with 0.5 ml 5% orthophosphoric acid, and then frozen for ammonia analysis. A 3 ml sample was conserved with 3 ml of methyl green–formalin–saline solution (0.92 mM methyl green, 0.14 M sodium chloride, 35 ml/l formaldehyde) stored in darkness at room temperature for protozoa counts.
VFAs were analysed by GLC (CP 9002; Chrompack) using a fused silica column (length 25 m, inside diameter 0.25 mm) CP-wax 58 FFAP CB (Varian, Middelburg, The Netherlands) and crotonic acid as internal standard. Ammonia content was determined by Berthelot’s reaction using phenol and sodium hypochlorite by spectrophotometry (Infinity M200, Tecan, Grödig, Austria) in 96-well plates. Protozoa were counted by microscopy using a Neubauer counting chamber (glass slide fitted with a grid delimiting square areas). The volume used for counting protozoa was 0.4 µl for entodiniomorphs <100 µm and 15 µl for other protozoa.
Calculations and statistical analyses
Manure CH4 emissions were calculated according to Intergovernmental Panel on Climate Change (IPCC, 2006) using equation 10.23 and table 10.17, assuming that slurry was stored at 15°C and had no natural crust cover, with the measured data on faecal OM digestibility and the estimated urinary OM from urinary N in place of the theoretical data proposed in the equations
 $${\rm The\ statistical\ model\ was}\,Y=\mu {\plus}F_{i} {\plus}N_{j} {\plus}P_{k} {\plus}A_{l} {\plus}FN_{{ij}} {\plus}e,$$
where Y is the dependent variable, µ the mean, F the type of forage, N the protein source, P the period, A the animal, FN the interaction between forage and protein source, and e the error. Statistical analysis was performed using the Mixed procedure of Statistical Analysis Software (SAS, 1997) software. Forage, protein source, their interaction and period were fixed effects. Animal was a random effect. Significance was set at P<0.05. When the interaction between forage and protein source was significant, separation between diets was calculated using the PDIFF t-test option.
Results
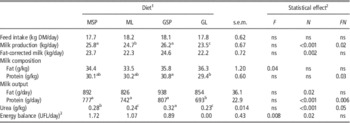
Total feed intake did not change among diets. Replacing SP with L decreased milk yield, with the effect being greater with GS than MS diets (1.1 v. 2.7 kg/day; interaction P=0.02) (Table 2). Milk fat content was higher for cows fed G diets than for those fed M diets. Milk protein content was not significantly modified by forage or protein source, but there was a significant interaction between these factors: protein content was lower for cows fed L than for those fed SP by 1.4 g/kg for G diet and differed by 0.1 g/kg for M diet. Fat and protein yields were lower for cows fed L diets than for those fed SP diets. Milk urea was lower for cows fed L diets than for those fed SP diets, especially when grass silage was the forage source (significant interaction). Calculated energy balance was higher for cows fed M diets than for those fed G diets, and higher for cows fed SP diets than for those fed L diets.
Effect of forage and protein source on feed intake, milk production and composition, and energy balance in cows

DM=dry matter; ns=not significant; UFL=feed unit for lactation (French net energy unit).
1 MSP, maize silage and soya bean meal plus beet pulp; ML, maize silage and dehydrated lucerne; GSP, grass silage and soya bean meal plus beet pulp; GL, grass silage and dehydrated lucerne.
2 F, forage source; N, protein source; FN, interaction between forage source and protein source. When FN was significant, separation between diets has been mentioned; values followed by different letters in a same row were significantly different (P<0.05). ns means P>0.05.
3 UFL is the unit for net energy in the French feeding systems for ruminants (INRA, 2007); 1 UFL represents 7.106 MJ of net energy.
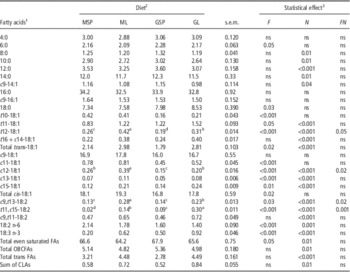
Compared with G diets, M diets resulted in higher cis-18:1, trans-18:1 and 18:2 n-6 (linoleic acid), and lower 6:0, 18:0 (stearic acid), t11,c15-18:2 and 18:3 n-3 (linolenic acid) in percentage of total FAs (Table 3). Among the major 18:1 isomers, c9 (oleic acid) did not vary with forage type, t10 was higher for cows fed M diets, and t11 (vaccenic acid) was lower for cows fed M diets. Compared with SP diets, L diets resulted in higher trans-18:1, total conjugated linoleic acids, c9,t11-18:2 (rumenic acid), t11,c15-18:2, 18:3 n-3, and lower short- and medium-chain saturated FAs (i.e. FAs with 14 carbons and fewer) and 18:2 n-6. The percentage of 16:0 (palmitic acid), 18:0 and total cis-18:1 did not vary between protein sources. Total odd- and branched-chain FAs did not vary with the nature of forage, but some of them were higher for cows fed M diets (13:0, ante iso-17:0), whereas others were lower for cows fed M diets (ante iso-13:0, iso-13:0, iso-14:0, 15:0, iso-15:0, iso-16:0) (Supplementary Table S2). Total and most individual odd- and branched-chain FAs (iso-13:0, 13:0, iso-15:0, ante iso-15:0, iso-17:0 and ante iso-17:0) were higher for cows fed SP diets than for cows fed L diets.
Effect of forage and protein source on main milk FA composition in cows

ns=not significant; FA=fatty acid; CLA=conjugated linoleic acid; OBCFA=odd- and branched-chain fatty acid.
1 Total trans 18:1 includes isomers 4 5 6 7 8 9 10 11 12 and the coelution t16+c14; total cis 18:1 includes isomers 9 11 12 13 15, total even saturated FAs includes all c4 to c24 even saturated FAs; total OBCFAs includes all OBCFAs detailed in Supplementary Table S2, sum of CLAs includes the following conjugated linoleic acids: c9,t11 t11,t13, t9,c11, c9,c11 and an unidentified t,t CLA.
2 MSP, maize silage and soya bean meal plus beet pulp; ML, maize silage and dehydrated lucerne; GSP, grass silage and soya bean meal plus beet pulp; GL, grass silage and dehydrated lucerne.
3 F, forage source; N, protein source; FN, interaction between forage source and protein source. When FN was significant, separation between diets has been mentioned; values followed by different letters in the same row are significantly different (P<0.05). ns means P>0.05.
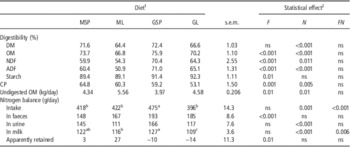
OM, fibre and starch digestibility were significantly higher for cows fed G diets than for cows fed M diets. DM, OM and fibre digestibility were higher for cows fed SP diets than for cows fed L diets (Table 4). For G diets, N intake was lower for cows fed L than for cows fed SP, but lower for dehydrated lucerne than for soya bean meal plus beet pulp only for cows fed diets G. Faecal nitrogen losses were higher for cows fed G diets than for cows fed M diets. Protein source did not result in changing N output in faeces, but N output in urine was much lower for cows fed L diets than for cows fed SP diets (Table 4). Consequently, urinary N-to-faecal N ratio decreased from 0.91 to 0.64 when soya bean meal plus beet pulp was replaced with dehydrated lucerne.
Effect of forage and protein source on digestibility, undigestible OM and nitrogen balance in cows

DM=dry matter; ns=not significant; OM=organic matter.
1 MSP, maize silage and soya bean meal plus beet pulp; ML, maize silage and dehydrated lucerne; GSP, grass silage and soya bean meal plus beet pulp; GL, grass silage and dehydrated lucerne.
2 F, forage source; N, protein source; FN, interaction between forage source and protein source. When FN was significant, separation between diets has been mentioned; values followed by different letters in the same row are significantly different (P<0.05). ns means P>0.05.
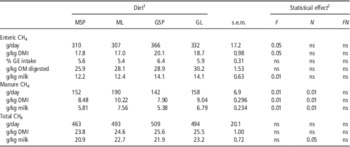
Enteric CH4 production was lower for cows fed M diets than for those fed G diets when expressed per day, per kg DM intake or per kg milk (Table 5), but did not differ among diets when expressed in % of gross energy intake and was higher for cows fed L diets than for those fed SP diets when expressed per kg digestible OM. No interaction between forage source and protein source was found regardless of the mode of expression. Calculated manure CH4 emissions, expressed in g/day, g/kg DMI or g/kg milk, were related to faecal OM and were higher for cows fed L diets than for those fed SP diets and higher for cows fed M diets than for those fed G diets. Total CH4 emissions did not differ among diets when expressed per day or per kg DM intake, and were higher for cows fed L diets than for those fed SP diets when expressed per kg milk.
Effect of forage and protein source on enteric and manure CH4 production in cows

ns=not significant; DMI=dry matter intake; GE=gross energy.
1 MSP: maize silage and soya bean meal plus beet pulp; ML: maize silage and dehydrated lucerne; GSP: grass silage and soya bean meal plus beet pulp; GL: grass silage and dehydrated Lucerne.
2 F: forage source; N: protein source; FN: interaction between forage source and protein source. ns means P>0.05.
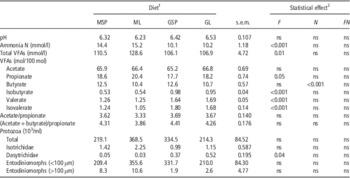
There was no change in rumen pH according to forage or protein source. Ammonia N was lower for cows fed G diets than for those fed M diets. Ammonia N did not change with protein source (Table 6). Total VFAs and propionate proportion in VFAs were higher for cows fed M diets than for those fed G diets. Butyrate proportion in VFAs was higher for cows fed SP diets than for those fed L diets. The ratios of acetate to propionate, and of (acetate+butyrate) to propionate, the latter characterising methanogenic v. non-methanogenic VFAs, did not vary with either forage or protein source. Among the protozoa population, only Dasytrichidae were less abundant for cows fed M diets than for those fed G diets, but these species represented a very minor fraction of protozoal biomass.
Effect of forage and protein source on pH, ruminal fermentation and protozoa population in cows

VFA=volatile fatty acid.
1 MSP: maize silage and soya bean meal plus beet pulp; ML: maize silage and dehydrated lucerne; GSP: grass silage and soya bean meal plus beet pulp; GL: grass silage and dehydrated lucerne.
2 F: forage source; N: protein source; FN: interaction between forage source and protein source. ns means P>0.05.
Discussion
Performance and milk composition
Regardless of the forage type in the diet, milk production was higher for cows fed SP diets than for those fed L diets, but this effect was greater with G (+2.7 kg) than with M (+1.1 kg). This change in milk production with protein source is consistent with the change in digestibility, which was higher for cows fed SP diets than for those fed L diets, and with a higher net energy supply as predicted by INRA (2007) feed tables. However, the limited milk production found in this trial was unexpected, as high amounts of dehydrated lucerne do not generally impair dairy cow performance (Christensen and Cochran, Reference Christensen and Cochran1983; Price et al., Reference Price, Satter and Jorgensen1988), and all the diets resulted in a positive or null energy balance, which suggests that the decrease in performance may not be fully explained by an energy shortfall (128.6 v. 117.0 MJ net energy for SP and L diets, respectively). Peyraud and Delaby (Reference Peyraud and Delaby1994) did not observe a decrease in production of cows averaging 30 kg milk daily when dehydrated lucerne replaced formaldehyde-treated oilseed meals, and represented 22% of the diet. The lower milk production for cows fed L diets in this study may be partly because of a lower intestinal protein digestibility, which remains to be demonstrated. Irrespective of the case, it is assumed that differences in production of cows fed L and SP diets are because of the protein source, and not to beet pulp supplied along with SP diets.
Milk FA composition
The M diets induced higher concentrations of cis-18:1 and 18:2 n-6 and lower concentrations of t11,c15-18:2 and 18:3 n-3 in milk fat because maize silage contains higher levels of c9-18:1 and 18:2 n-6 and lower levels of 18:3 n-3 than grass silage (Dewhurst et al., Reference Dewhurst, Shingfield, Lee and Scollan2006). The higher levels of t10-18:1 for cows fed M diets than for cows fed G diets could be linked to a decrease in milk fat content. Diets that result in a decrease in milk fat content could alter ruminal lipid metabolism, with a shift towards the formation of t10-18:1 at the expense of t11-18:1. The dietary conditions causing this shift could be linked to the higher starch content with M diets (Shingfield et al., Reference Shingfield, Bernard, Leroux and Chilliard2010).
There is a lack of information on the effect of protein source on milk FA composition, probably because these two factors are not directly linked. The higher milk trans-18:1, and c9,t11-18:2 concentrations for cows fed L diets suggest a partial biohydrogenation of polyunsaturated FAs, especially linolenic acid, with L diets. In addition, the higher milk 18:3 n-3 content for cows fed L diets, and for cows fed G diets, are probably because of the high 18:3 n-3 content of grass silage and lucerne compared with maize silage, as stated by Chilliard et al. (Reference Chilliard, Ferlay and Doreau2001) and Kliem et al. (Reference Kliem, Morgan, Humphries, Shingfield and Givens2008).
The higher milk level of ante iso-17:0 and lower levels of iso-14:0 and iso-15:0 for cows fed M diets agrees with the results of Vlaeminck et al. (Reference Vlaeminck, Fievez, Cabrita, Fonseca and Dewhurst2006). Branched-chain FAs are synthesised de novo in rumen bacteria, and microbial protein synthesis is more efficient with maize silage than with grass silage in most cases (Vlaeminck et al., Reference Vlaeminck, Fievez, Cabrita, Fonseca and Dewhurst2006). In addition, these authors reported a negative correlation between milk iso-14:0 and iso-15:0 concentrations and dietary starch content, in agreement with our results.
Effect of type of forage on CH4 production
The well-known positive relationship between the fibre-to-starch ratio in the diet and enteric CH4 production often results in a lower CH4 production with maize silage than with grass silage or hay (Beauchemin et al., Reference Beauchemin, McAllister and McGinn2009, Doreau et al., Reference Doreau, Martin, Eugène, Popova and Morgavi2011). Few experiments have focused on the influence of type of forage on CH4 production. Chung et al. (Reference Chung, He, McGinn, McAllister and Beauchemin2011) in dry cows observed higher CH4 production for cows fed barley silage than for cows fed hay, without changes in the VFA pattern. Conversely, C. Martin, A. Ferlay, Y. Chilliard and M. Doreau (unpublished results) found, in two experiments on dairy cows conducted with the same design, that CH4 production per kg DM was higher by 15% on average for cows fed permanent grassland hay-based diets than for those fed maize silage-based diets with or without lipid supplementation. This is in line with results from the present experiment in which M and G diets differed in NDF and starch concentrations. In this study, differences between M and G diets are probably related to a higher OM digestibility for G than for M diets, as G and M diets did not differ in terms of the ratio of methanogenic VFAs (acetate and butyrate) to non-methanogenic VFAs (propionate) or protozoa population (related to hydrogen production). Given the complexity of mechanisms of methanogenesis, which depend on factors other than fermented OM and VFA patterns, the origin of the difference in CH4 production in this experiment is unclear. Owing to the wide variation of digestibility among both maize silages and grass silages, extensive additional research is needed to assess and elucidate the influence of forage type on CH4 production. A broad range of quality of grass and maize silages, included in different types of ration, should be explored.
Dietary effects on CH4 should always include both enteric and manure emission. However, as measuring enteric and manure emission separately in individual animals is very difficult, scientists determine either enteric CH4 alone, or total CH4, generally in groups of animals. In this experiment, we combined measured enteric CH4 with calculated manure CH4. It must be noted that IPCC estimates are rough; in particular, undigestible OM is considered as a whole, whereas the potential of CH4 emission depends on the nature of undigestible OM, so that results are interpreted cautiously. As OM digestibility is lower for cows fed M diets than for those fed G diets, more OM remains for manure fermentation, with the result that calculated manure CH4 emissions are higher for cows fed M diets and offset lower enteric CH4 emissions. This underlines the utility of adding manure CH4 estimates to enteric CH4 measurements for measuring OM digestibility to provide more accurate aggregated values for CH4 emissions than when using default IPCC (2006) values. In other respects, the trade-off between enteric and manure CH4 emissions is highly dependent on the type of manure. Calculations were made for slurry, but in the case of solid manure, the trade-off would have been lower because of a lower CH4 conversion factor (IPCC, 2006).
Effect of protein source on enteric CH4 production
A putative decrease in CH4 emission with lucerne might be because of a specific effect of this feedstuff and not a general effect of legumes. No change in CH4 emission has been found with other legumes (see Van Dorland et al., Reference Van Dorland, Wettstein, Leuenberger and Kreuzer2007; Hammond et al., Reference Hammond, Hoskin, Burke, Waghorn, Koolaard and Muetzel2011) with clover, and in the meta-analysis by Archimède et al. (Reference Archimède, Eugène, Marie Magdeleine, Boval, Martin, Morgavi, Lecomte and Doreau2011), comparing grasses and legumes. A decrease in enteric CH4 production with high amounts of lucerne was expected based on literature data such as McCaughey et al. (Reference McCaughey, Wittenberg and Corrigan1999), who showed that the partial replacement of grasses with lucerne for grazing beef cows decreased CH4 production per kg DM by 22%. These authors suggested that the lower CH4 production with lucerne in their trial might have been because of a higher ruminal passage rate with lucerne than with grasses; an increase in ruminal passage rate decreases CH4 enteric production. In our trial, it is unlikely that the passage rate was higher with L diets than SP diets, as both were given in concentrate form, and with similar intake. Another hypothesis to explain the effect of lucerne on CH4 production is the high malate content of lucerne; malate often decreases CH4 production (Martin et al., Reference Martin, Morgavi and Doreau2010). However, recent data (Foley et al., Reference Foley, Kenny, Callan, Boland and O’Mara2009) showed that malate was efficient at a dose of 7.5% in DM but not at lower amounts as in this study (1.3% of DM in L diets). A putative effect of malate in lucerne on mitigating enteric CH4 may occur when lucerne is grazed, or represents a major part of the diet, but not when lucerne is included in the diet as a protein source. Differences in chemical composition, especially in fibre, did not result in significant changes in the VFA pattern and thus did not contribute to changes in CH4.
Effect of protein source on N losses
It is assumed that the effect on N losses observed for SP diets is because of soya bean meal rather than the complementary beet pulp, owing to the difference in dietary N between these two feedstuffs. Differences in dietary N concentration result in similar differences in milk N, with the result that the ratio between milk N and dietary N is in the 27% to 29% range for both diets. This is not surprising, as this ratio is closely related to N intake (Kebreab et al., Reference Kebreab, France, Beever and Castillo2001). For a similar N intake, faecal N depends on ruminal N balance and intestinal N digestibility, whereas urinary N also depends on other factors such as the amino-acid uptake by the mammary gland and deamination in the liver (Lapierre and Lobley, Reference Lapierre and Lobley2001). However, the main factor known to modulate N excretion is the level of dietary protein and ruminal degradable protein (e.g. Agle et al., Reference Agle, Hristov, Zaman, Schneider, Ndegwa and Vaddella2010). In this trial, the predicted level of degradable N in the rumen was similar among diets, and thus ruminal N balance was not expected to be significantly changed by diet, which means that changes in apparent N digestibility are due to changes in intestinal N digestibility. Respective values of 70% and 90% are taken for true intestinal N digestibility for dehydrated lucerne and soya bean meal, in INRA (2007) tables. The similar faecal N output with SP and L diets, despite higher intake for the SP diets, corresponds to a higher intestinal N digestibility by 4.8 percentage units. Nitrogen digestibility is generally higher for concentrates, especially oleaginous meals, than for forages. To the best of our knowledge, there is no direct comparison between soya bean meal and dehydrated lucerne in the literature. However, a lower N faecal output has been observed with lucerne silage than with maize silage. In this trial, the lower faecal N output for M diets than for G diets at similar N intake levels may be because of a higher intestinal N digestibility of maize silage than of grass silage, as calculated, for example, from Hristov and Broderick (Reference Hristov and Broderick1996).
Urinary N varies in line with milk urea but not in line with rumen ammonia. As urea is the main component of urinary N, this confirms the close relationship between urinary N and milk urea (e.g. Spek et al., Reference Spek, Dijkstra, Van Duinkerken and Bannink2013). The weak relationship with rumen ammonia suggests that plasma urea (not measured in this trial) is mainly related to amino-acid catabolism. The lower urinary N for L diets may result from lower digestible N: the ratio between milk and digestible N is 45.1% and 48.0% for SP and L diets, respectively. This shift from urinary to faecal N between SP and L diets (urinary N : faecal N being 48 : 52 to 39 : 61, respectively) may help to reduce nitrous oxide and ammonia emissions, as only a very minor fraction of faecal N is in ammonia form (Hristov et al., Reference Hristov, Hanigan, Cole, Todd, McAllister, Ndegwa and Rotz2011), and as urinary urea is rapidly converted into ammonia by faecal urease (Vaddella et al., Reference Vaddella, Ndegwa, Joo and Ullman2010).
Conclusion
In the conditions of this experiment, dehydrated lucerne in replacement of soya bean meal plus beet pulp did not modify enteric CH4 emissions, but resulted in a shift from urinary to faecal N, regardless of the basal diet. Dehydrated lucerne increased some milk FAs, which may be beneficial for human health, but decreased milk production. These trends now need to be checked in other experimental conditions, such as lower inclusion level of dehydrated lucerne in the diet or higher cow genetic merit.
Acknowledgements
This experiment was funded by ‘Coop de France Deshydratation’, 43 rue Sedaine 75538 Paris Cedex 11, France. The authors thank the INRA staff who participated in the experiment, especially Benoît Robert and Sylvie Rudel for animal management, Pierre Amblard, Lucette Genestoux, Virginie Goudour, Dominique Graviou and Emilie Tixier for lab management, and Pierre Nozière for valuable advice. Special thanks go to Yves Farizon (Ecole Nationale Vétérinaire, 23 chemin des Capelles, 31000 Toulouse France) for technical assistance.