Simultaneously improving the power and energy density of electrostatic capacitors, and decreasing the size of the power subsystem, is critical for advancing medical, transportation, and aerospace technologies.[Reference Dang, Yuan, Yao and Liao1] Furthermore, the rapid emergence of flexible hybrid electronics and printing technologies promises to integrate passives into the device package and eliminate surface-mounted components. To maximize theoretical energy storage density (=1/2ε oε r|E BD|2), the relative permittivity ε r and breakdown strength E BD must be concurrently increased by approaches that optimize new materials with new processing techniques. Although amorphous polymers have relatively low ε r, their high breakdown strength, ease of processability, and affordability offer practical advantages over pure ceramics, and thus are the current choice for many emerging applications and manufacturing technologies. The addition of inorganic nanoparticles with substantially higher ε r conceptually affords a means to increase permittivity while maintaining the polymeric characteristics that are key to scalability.[Reference Wang and Zhu2] In concert with these material innovations, processing is just as critical to maximize energy storage. In addition to purification, protocols must avoid trapped solvent and voids. Such defects serve as initiation sites for premature breakdown, and lower the effective dielectric strength.[Reference Dissadio and Fothergill3] The relation between this “free-volume” and dielectric breakdown strength has been established; for example by experiments on amorphous copolymers[Reference Sabuni and Nelson4] and through percolation theory simulations.[Reference Wu, Okamoto and Suzuoki5] Initiation of breakdown within a polymer is associated with the largest voids,[Reference Artbauer6] and has been used to explain numerous observations, such as the relationship between polymer density, composition and breakdown, and the decrease in breakdown strength as service temperature approaches T g.[Reference Sabuni and Nelson4, Reference Artbauer6] However, processing procedures reported in literature and practiced in industry vary widely, with minimal relationship to the physics underlying the generation of this “free-volume”, such as gelation, vitrification, and structural relaxation. Rather these procedures have been developed empirically for a specific material through extensive testing. For example, residual solvent is nominally driven from the film at an empirically chosen temperature and vacuum; followed by a treatment above the glass-transition temperature, T g.[Reference Paniagua, Kim, Henry, Kumar, Perry and Marder7, Reference Li, Claude, Norena-Franco, Seok and Wang8] Likewise for semi-crystalline polymers such as biaxial oriented polypropylene, anneals above T g are used to optimize the crystallite morphology. In both cases though, the subsequent cooling procedure to room temperature is rarely discussed. The cooling rate however is what determines the excess thermodynamic properties (i.e., volume, enthalpy, and entropy) of the amorphous polymer, and its relationship to an equilibrium glass.[Reference Hutchinson9, Reference Cangialosi, Boucher, Alegria and Colmenero10] Thus, can pre-service processing procedures be prescribed based on the physics underlying the generation and evolution of the excess thermodynamic properties within a quenched polymer? For example, to what extent can capacitive performance be improved by purposeful structural relaxation within the glass?
Structural relaxation (physical aging) impacts mechanical and optical properties of amorphous polymers[Reference Priestley11]; however, understanding its impact on dielectric performance and failure has seen little investigation.While investigating in-service failures, Vouyovitch et al. reported breakdown strength improvements up to 25%–40% after annealing inorganic-filled epoxies at T g−18 °C.[Reference Vouyovitch, Alberola, Flandin, Beroual and Bessede12] In these composites, improvements were first observed after 2 weeks of such treatment, and required as much as 2 months before breakdown strength was maximized. Champion and Dodd studied the electrical tree growth of unfilled epoxy resins and found breakdown pathways became more fractal in nature as the material was stored at room temperature, reflecting a more tortuous pathway for the discharge cascade.[Reference Champion and Dodd13] These improvements were attributed to a densification of the resin matrix, but correlating the relative contribution from reduction in excess volume or reduction of unsaturated network bonds could not be ascertained due to the lack of direct measurement of excess thermodynamic properties.
In this study, we investigate the impact of structural relaxation on capacitive energy storage in amorphous polystyrene (PS), polymethyl methacrylate (PMMA), and their corresponding blended and single-component nanocomposites with silica. PS is non-polar with relatively poor breakdown strength (400 V/μm) and low dielectric loss (ε″ ~ 10−3 at 1 kHz), whereas PMMA is polar with excellent breakdown strength and high dielectric loss (800 V/μm and ε″ ≈ 10−1 at 1 kHz, respectively). The dielectric breakdown strength, permittivity, loss tangent, and energy storage are compared for films annealed below T g after quenching from the melt. For example, annealing at T g−10 °C for 3–12 h enhances the effective breakdown strength of PS and PMMA films by up to 35% and nanocomposites by up to 45%. Most importantly, the anneal temperature and rate of improvement are comparable with prior reports of structural recovery (enthalpy and volume) of PS, which reaches equilibrium after ~1 day at T g−9 °C.[Reference Koh and Simon14, Reference Simon, Sobieski and Plazek15]
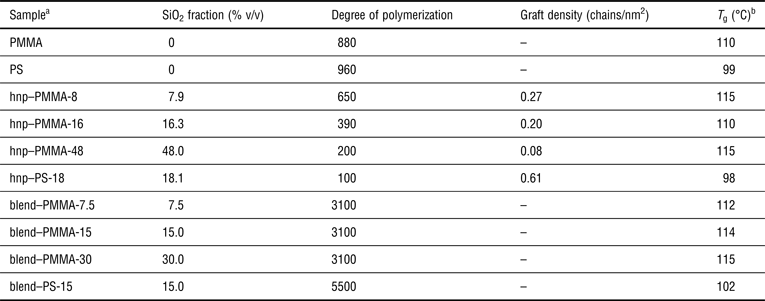
Figure 1 summarizes structural relaxation in amorphous polymers, as well as providing representative examples of the polymer nanocomposites examined. The extent that the molecular structure of a glass deviates from its ideal equilibrium depends on the cooling rate from the melt (i.e., faster cooling rate equates to greater deviation, Fig. 1a). Structural relaxation refers to the molecular level processes that evolve the excess thermodynamic properties (e.g., volume and enthalpy) of the cooled non-equilibrium glass toward the melt-extrapolated equilibrium state. The sub-T g anneals and resultant changes in physical properties are referred to as physical aging.[Reference Priestley11] Note that here the glass-transition temperature, T g, reflects rapid cooling from the melt to ensure consistency with thermal history and physical aging discussions. Table I summarizes the relevant characteristics of the materials discussed.[Reference Li, Claude, Norena-Franco, Seok and Wang8] In addition to unfilled PS and PMMA (Polymer Source; M w = 100 and 88 kg/mol, respectively), traditional blended polymer nanocomposites, Fig. 1b, and assemblies of matrix-free hairy silica nanoparticles (aHNPs),[Reference Champion and Dodd13]Fig. 1c, are also examined. The blended nanocomposites and aHNPs were synthesized and prepared following Refs Reference Meth, Zane, Chi, Londono, Wood, Cotts, Keating, Guise and Weigand16 and Reference Pietrasik, Hui, Chaladaj, Dong, Choi, Jurczak, Bockstaller and Matyjaszewski17, respectively. The silica is well dispersed at all volume fractions, as discussed in prior morphology-processing studies.[Reference Grabowski, Koerner, Meth, Dang, Hui, Matyjaszewski, Bockstaller, Durstock and Vaia18] A more ordered morphology is observed in the aHNP films due to the covalent grafting of the polymer chains to the silica surface, which establishes a finite minimum particle–particle separation.[Reference Meth, Zane, Chi, Londono, Wood, Cotts, Keating, Guise and Weigand16, Reference Grabowski, Koerner, Meth, Dang, Hui, Matyjaszewski, Bockstaller, Durstock and Vaia18] All materials were purified to electronic-grade standard by dissolution in methyl ethyl ketone, passing through a silica gel column, precipitation in methanol, and drying in a rotary evaporator (see Supporting Information).
(a) Diagram illustrating the change in volume and enthalpy for amorphous polymers during structural relaxation below the glass transition. Here, T g refers to the glass-transition temperature recorded upon cooling. (b, c) Illustrations of nanocomposites: a traditional polymer–nanoparticle blend and a matrix-free aHNPs, respectively. Representative transmission electron microscopy (TEM) images of PMMA silica nanocomposite films: (d) blend 1% v/v loading, (e) aHNP 0.7% v/v, (f) blend 15% v/v, and (g) aHNP 16% v/v. Blend films are 90 nm thick microtome slices, whereas aHNP are a monolayer thick formed from toluene solution drop cast onto a carbon-coated copper grid.

Composition and thermal properties for polymer, traditional blended, and matrix-free hairy (polymer grafted) nanoparticle nanocomposites.
a PMMA, polymethyl methacrylate; PS, polystyrene; hnp-x-y, matrix-free hairy nanoparticle nanocomposite with x-polymer graft and y v/v% silica. blend-x-y: traditional blended nanocomposite with x-polymer matrix and y v/v% silica.
b T g values are obtained from the average of 2–3 DSC cooling cycles. Uncertainty in T g measurements is ±3%.
Figure 2 compares the characteristic breakdown strength of neat PS and PMMA films (3 μm thick) aged for increasing times, t a, at T g-10 °C after a 30 °C/s quench from an initial 24 h vacuum anneal at T g + 25 °C. Dielectric failure data (Fig. 2a for PS and Supporting Information Fig. S1 for PMMA) were fit to a two-parameter Weibull cumulative probability function, P(E)=1−exp[−(E/E BD)β], where P(E) is the cumulative probability for failure, E is the experimental breakdown strength, E BD represents the electric field for which there is 63.2% probability for failure (Fig. 2b), and β is the shape parameter associated with the least-squares fit of the distribution (Fig. 2c). Error bars represent one standard deviation within the breakdown data. For PS and PMMA, E BD initially increases from 420 and 805 V/μm at t a = 0, to a plateau of approximately 570 and 970 V/μm for t a > 3 h. In concert, β increases, reflecting a commensurate narrowing of the distribution of the breakdown values. This narrowing however preferentially occurs at the low value side of the distribution (Fig. 2a and Fig. S1). Dielectric failure of glassy polymers occur due to extrinsic factors (such as chemical impurities and trapped solvent), and the inherent microstructural variations and density fluctuations within the polymer matrix.[Reference Sun, Boggs and Ramprasad19] Using electronic-grade polymers and thoroughly annealing solvent-cast polymer films at T > T g, we limit the influence of the extrinsic impurities. As a polymer glass evolves toward equilibrium, structural relaxation processes reduce the magnitude and spatial frequency of local density fluctuations, thus minimizing structural variability.[Reference Hutchinson9] The increased dielectric strength associated with physical aging therefore appears to reflect a reduction of the number density of largest flaws that are associated with the initiation and propagation of breakdown.
(a) Probability of failure for PS (100 kg/mol M w) films aged at t a = 0, 3, 12, and 24 h. Lines correspond to two-parameter Weibull fittings. Corresponding PMMA (88 kg/mol M w) Weibull plots are available in Supporting Information. (b, c) Characteristic breakdown strength and Weibull parameter β for PS (red circles) and PMMA (blue squares) measured after aging for a duration of t a at T g−10 °C, respectively. Samples were quenched at 30 °C/s. Lines provide a guide to data trends.
The rate at which this improvement in dielectric strength occurs is consistent with reported enthalpy loss measurements. The recovery of excess volume and enthalpy in a polymer glass follows the Vogel–Fulcher–Tammann (VFT) relationship and recent studies indicate that enthalpy and volume recover at comparable rates.[Reference Badrinarayanan and Simon20] Thus enthalpy recovery experiments provide insight into volume recovery in a polymer glasses. For neat PS, complete enthalpic recovery occurs in ~80 and 500 h at T g−9 °C (91 °C) and T g−10 °C (90 °C), respectively.[Reference Koh and Simon14] Furthermore, due to its power-law dependence, over 85% of the recovery occurs in 12 h at 91 °C. This is qualitatively consistent with maximum breakdown occurring for t a ~ 11 h at 90 °C, especially considering the larger temperature variation in laboratory ovens (±2–3 °C, Fisher Scientific 282A vacuum oven), compared with controlled differential scanning calorimetry (DSC) experiments.
Figure 3 summarizes the extent to which physical aging may also improve the dielectric breakdown of polymer nanocomposites (see Table I for sample identification and T g information). Note that the reported impact of silica loading and nanocomposite architecture on T g is consistent with prior reports for PS– and PMMA–silica blends as well as hnp–PMMA and hnp–PS.[Reference Tchoul, Fillery, Koerner, Drummy, Oyerokun, Mirau, Durstock and Vaia21, Reference Rittigstein and Torkelson22] Recent studies by Boucher et al. showed accelerated structural relaxation for blended PMMA–silica nanocomposites, whereas no change in the enthalpy recovery rate was observed for blended PS–silica nanocomposites.[Reference Boucher, Cangialosi, Alegria and Colmenero23] aHNPs exhibit similar rate behavior to their blended analogs.[Reference Koerner, Bockstaller, Dang, Mahoney, Matyjaszewski, Hui and Vaia24] Therefore, to consider the maximum effect of physical aging, we compare dielectric breakdown, E BD, for t a = 0 and 24 h at T g–10 °C. Overall, E BD at t a = 0 decreases with silica loading in PMMA and is relatively insensitive to silica loading in PS. These data are consistent with prior reports where the impact of uniformly disperse silica on breakdown reflected the relative polarity of the silica surface to the surrounding matrix.[Reference Grabowski, Fillery, Westing, Chi, Meth, Durstock and Vaia25] The more polar silica likely behaves as a trap or scattering site in the less polar PS, whereas it behaves as a defect in the even more polar PMMA. Upon aging for t a = 24 h, E BD increases irrespective of the type of nanocomposite for low-to-intermediate silica loadings (<20% v/v). For example, the E BD of hnp–PMMA-8 (80 kg/mol M w, 0.27 chains/nm2 graft density) increases from 543 to 691 V/μm. A traditional blend sample with comparable silica loading, blend–PMMA-7.5, shows an increase from 521 to 589 V/μm. The Weibull parameter β values fall within a narrow range, between 7 and 11, irrespective of aging. This indicates that the improvement in nanocomposite E BD with aging is more likely associated with overall densification than any preferential elimination of large density fluctuations.
(top) Characteristic breakdown strength, E BD, for representative PS and PMMA nanocomposite films measured after t a = 0 and 24 h at T g−10 °C (blue and red, respectively). (bottom) Corresponding Weibull parameter β. T g and sample identification are listed in Table I.
The consistency of E BD enhancement over such a broad range of silica volume fraction, polymer–nanoparticle interface, and matrix chemistry confirms the underlying mechanism for these enhancements is related to the general characteristics of the polymer glass. It is also important to note that the only sample in our investigation that did not show improved breakdown strength after physical aging was hnp–PMMA-48 (25 kg/mol M w, 0.08 chains/nm2 graft density). Extreme silica loading, and associated geometrical confinement of the chains, cannot be the sole factor responsible for this deviation since a traditionally blended PMMA nanocomposite with comparable silica loading (45% v/v) did show ~20% enhanced E BD. Rather, it seems that the combination of polymer tethering with geometrical confinement limits this structural relaxation of the nanocomposite. This is consistent with recent enthalpy relaxation experiments of blended and aHNP nanocomposites, which show significantly reduced enthalpy relaxation in high silica content aHNPs comprised of low-graft density, high molecular weight, hairy nanoparticles.[Reference Koerner, Bockstaller, Dang, Mahoney, Matyjaszewski, Hui and Vaia24]
To assess the complete impact of physical aging on energy storage, permittivity, loss tangent, and D–E polarization loops were measured for select samples (see Supporting Information). Overall, the permittivity of the quenched PS and PMMA are consistent with prior studies, and that of the nanocomposites follow effective medium models, such as the Bruggeman model, with increasing silica (ε ≈ 3.9) content.[Reference Grabowski, Koerner, Meth, Dang, Hui, Matyjaszewski, Bockstaller, Durstock and Vaia18] Physical aging in general did not substantially impact the permittivity or loss tangent. Both blended and aHNP nanocomposites although did exhibit slight increases in permittivity (5%–10%) (Figs S2 and S3), which may reflect an initially more open glass structure upon cooling due to the silica, and thus a measurable increase in dipole density due to polymer densification during the annealing. Concurrently, the loss tangent also slightly decreased at low frequencies. This is also consistent with densification inhibiting mobility and transport.
Charge/discharge efficiency for representative polymer and nanocomposties are summarized in Fig. 4 and Fig. S6. Detailed D–E polarization loops may be found in the Supporting Information Figs S4 and S5. Since the dielectric characteristics are effectively unchanged by physical aging, the increased capacitive performance arises from the improved dielectric breakdown characteristics. The increased E BD and narrower distribution leads to the ability to drive a capacitor to higher fields and thus realize a higher practical energy storage. PMMA delivers 3.5 J/cm3 at 500 V/μm, and PS delivers 1.4 J/cm3 at 325 V/μm after aging for 24 h. Samples not subjected to aging failed at these elevated electric fields. Aging of blend nanocomposites (blend–PS-15 and blend–PMMA-15) resulted in a substantial improvement of efficiency at high (>200 V/μm) fields, from <50–60% to >75% (Fig S6). This may be related to the reduced transport arising from densification upon structural relaxation of the polymer glass. A table summarizing the overall capacitive performance may be found in the Supporting Information, Table S1.
Recovered energy density and charge/discharge efficiency while increasing applied electric field for PMMA (top) and PS (bottom) after aging at T g–T = 10 °C for t a = 0 (open) and 24 h (closed).
In conclusion, this study has shown that structural relaxation within a polymer glass increases the mean dielectric breakdown strength as well as preferentially reducing the probability of failure below the mean value. This results in an increase in the maximum electric field applied in-service. The effect is general, occurring for different polymer chemistries (PS and PMMA) and for many different nanocomposite variations (i.e., silica loading, blended, and aHNPs). Most importantly, the rate of enhancement across all these systems is consistent with available enthalpy recovery studies—motivating future investigation of the structural recovery rate of potential dielectric polymers and nanocomposites. Correlations between fundamental thermodynamic characteristics of the polymer and processing protocols will enhance the speed at which new materials and manufacturing technologies can be optimized for capacitive energy storage.
Supplementary materials
For supplementary material for this article, please visit http://dx.doi.org/10.1557/mrc.2015.29
Acknowledgments
The authors thank the Air Force Office of Scientific Research and Air Force Research Laboratory Materials & Manufacturing Directorate for their financial support along with V. McNeir and J. DeCerbo for their assistance with energy storage characterization, and C. Chi (Dupont de Nemours & Co.) for colloidal silica samples. The authors also thank the Bockstaller and Matyjaszewski groups (Carnegie Mellon University) and J. S. Meth (DuPont) for supplying nanocomposite samples and images.