Introduction
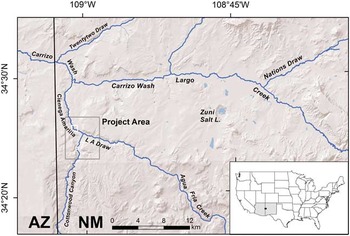
Cienega Amarilla is a spring-fed wetland with a large, late Holocene carbonate spring mound located on the southern Colorado Plateau in west-central New Mexico near the Arizona state line (Fig. 1). Spring mound features of Holocene age are relatively rare in the southwestern United States. Past shifts in spring discharge often reflect paleohydrologic and paleoclimatic variability (Kreamer and Springer, Reference Kreamer and Springer2008; Pigati et al., Reference Pigati, Rech, Quade and Bright2014), and the Cienega Amarilla stratigraphic record—which includes alluvium and groundwater discharge (GWD) deposits—is therefore an important archive of local and regional paleoenvironmental and hydroclimatic change. GWD deposits can provide information about the timing and magnitude of past episodes of heightened water tables related to moister and/or cooler conditions (Pigati et al., Reference Pigati, Rech, Quade and Bright2014). A distinct period of rapid spring mound growth and wetland expansion at Cienega Amarilla signifies a late Holocene interval of elevated water tables and increased spring discharge.
(color online) Location map of study area. Cienega Amarilla and Cottonwood Canyon subareas illustrated in Figure 2 are outlined in white. Inset map shows location of project area within the conterminous United States as small black rectangle, with Arizona and New Mexico shaded gray.

The Cienega Amarilla record is significant because of its potential to help clarify hydroclimatic relationships on the southern Colorado Plateau, including the underlying causes of past pluvials and droughts, as well as possible effects of future climate change on the region’s limited water resources. Objectives of this study included identifying and characterizing stratigraphic units and depositional facies in the Cienega Amarilla vicinity, establishing a high-resolution (centennial-scale) chronostratigraphic framework using extensive radiocarbon dating, and reconstructing local paleoenvironmental conditions by utilizing pollen, plant macrofossil, mollusk, ostracode, and soil analyses. Because winter rainfall and snow are more effective than summer rains in recharging water tables in the southwestern United States (Eastoe et al., Reference Eastoe, Gu and Long2004; Haynes, Reference Haynes2008; Wagner et al., Reference Wagner, Cole, Beck, Patchett, Henderson and Barnett2010), another objective of this study was to evaluate the hypothesis that the Holocene hydroclimatic history of Cienega Amarilla spring discharge was driven largely by changes in winter precipitation.
Geologic and hydrologic context
Cienega Amarilla is located between the Springerville and Red Hill–Quemado volcanic fields and coincides with the Jemez lineament, a northeast-trending zone of crustal weakness and normal faulting (Mayo, Reference Mayo1958; Magnani et al., Reference Magnani, Miller, Levander and Karlstrom2004). Bedrock in the Cienega Amarilla vicinity consists primarily of Triassic Chinle Formation capped by Upper Cretaceous Dakota Sandstone. These sedimentary rock units dip slightly (1°) to the north, forming the northern limb of a gentle anticline (O’Brien, Reference O’Brien1956). The hydrostratigraphic and geologic conditions that give rise to the Cienega Amarilla springs have not been studied. However, the springs may be fed by one or more aquifers—including the Shinarump Conglomerate, Kaibab Limestone, and Coconino Sandstone—that underlie the floodplain and are confined between a Chinle Formation shale member and Supai Formation red beds (O’Brien, Reference O’Brien1956; Akers, Reference Akers1964).
Although geologic maps (O’Brien, Reference O’Brien1956; New Mexico Bureau of Geology and Mineral Resources, 2003) and satellite imagery show no definitive evidence of faulting at Cienega Amarilla, northeast-trending normal faults have been documented 13 km to the southeast (Chamberlain et al., Reference Chamberlain, Cather, Anderson and Jones1994), and it is possible that the Cienega Amarilla springs are related to undocumented, buried faults. Cienega Amarilla is ~20–40 km east of extensive, middle to late Pleistocene (36–354 ka) travertine deposits related to a large natural CO2 gas field trapped under a broad anticline (Embid, Reference Embid2009). Cienega Amarilla lies ~6 km outside the mapped extent of the CO2 field (Moore et al., Reference Moore, Adams, Allis, Lutz and Rauzi2005), and it is unclear what, if any, relationship exists between the recent Cienega Amarilla carbonate deposits and these older travertine deposits.
Cienega Amarilla (~1930 m above mean sea level) is situated immediately below the confluence of Cottonwood Canyon and LA Draw (Fig. 1). This study focused on a 1.4 km reach of Cienega Amarilla and a 600-m reach of Cottonwood Canyon that is ~3 km south and ~40 m higher in the watershed. The ~1500 km2 Cienega Amarilla watershed extends to elevations of 2860 m and constitutes roughly one-quarter of the catchment of Carrizo Wash, a headwater tributary of the Little Colorado River. The groundwater catchment feeding the Cienega Amarilla springs is undefined and does not necessarily coincide with the surface drainage basin extent. In general, however, groundwater in the Coconino Sandstone and Kaibab Limestone aquifers is recharged by rain and snowmelt in the White Mountains and Mogollon Rim areas to the south (including areas outside Cienega Amarilla’s surface drainage catchment) and moves northward, largely controlled by regional dip (Akers, Reference Akers1964).
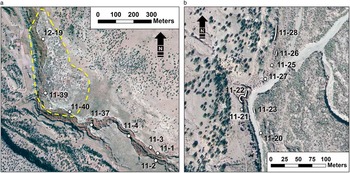
The ~3-m-high carbonate spring mound at Cienega Amarilla presently covers 9 hectares (0.09 km2) and is inactive (Fig. 2a). Historical-period arroyo cutting during the late nineteenth or early twentieth century removed the mound’s western margin, and today the Cienega Amarilla floodplain is entrenched by an arroyo as much as 11 m deep and 80 m wide. In contrast, arroyos in Cottonwood Canyon are substantially narrower and shallower (Fig. 2b). According to local rancher Clifford A. Thorn (personal communication, 2011), arroyo cutting began in the 1890s when heavy rains triggered gullying of wagon trail ruts created by early homesteaders running sheep in the area. This is consistent with widespread arroyo formation in the southwest United States at this time (Waters and Haynes, Reference Waters and Haynes2001), including entrenchment of the Zuni River (~50 km to the north) between 1879 and 1899 (Hall et al., Reference Hall, Penner and Ellis2009). Historical incision of the Cienega Amarilla floodplain probably caused spring flow at mound orifice(s) to cease. A series of springs, however, presently issue from the arroyo bottom into confined pools and marshes, resulting in perennial flow along a 2- to 3-km-long reach of the drainage.
(color online) Satellite imagery showing Cienega Amarilla (a) and Cottonwood Canyon (b) profile locations. Dashed line outlines estimated original extent of spring mound.

Lower elevation streams in the Carrizo Wash watershed are alluvial systems characterized by ephemeral flow (Basabilvazo, Reference Basabilvazo1997), and perennial flow along the Cienega Amarilla reach is a unique exception. Cienega Amarilla presently supports a narrow corridor of riparian and aquatic plants within its entrenched channel, including willow (Salix sp.), cottonwood (Populus fremontii), tamarisk (invasive Tamarix sp.), bulrush (Scirpus sp.), cattail (Typha sp.), sedges (Cyperaceae), and a variety of herbaceous plants and grasses. These wetland phreatophytes differ dramatically from the surrounding xeric vegetation dominated by four-wing saltbush (Atriplex canescens), juniper (Juniperus monosperma), and a variety of grasses. The carbonate spring mound supports an unusual vegetation community that includes New Mexico privet (Forestiera neomexicana), skunkbush (Rhus trilobata), and wolfberry (Lycium sp.).
Climate
Modern climate in the Cienega Amarilla area is semiarid and mesic, with moderately seasonal precipitation and strongly seasonal temperatures. Mean annual precipitation is weakly bimodal, with more than half resulting from warm-season (July–September) storms, including intense, localized North American monsoon (NAM) thunderstorms and less frequent, more widespread tropical cyclones (Smith, Reference Smith1986; Dean, Reference Dean1988; Adams and Comrie, Reference Adams and Comrie1997; Western Regional Climate Center, 2016). Because Cienega Amarilla lies south of most winter westerly storm tracks, winters are generally relatively dry. Large cyclonic storms or a southerly shifted jet stream, however, can result in widespread winter precipitation over the southwestern United States (for a detailed discussion, see Sheppard et al., Reference Sheppard, Comrie, Packin, Angersbach and Hughes2002). Winter precipitation in the Southwest is largely linked to the El Niño–Southern Oscillation (ENSO), which is driven by sea-surface temperature (SST) and surface air pressure fluctuations between the eastern and western tropical Pacific Ocean (Andrade and Sellers, Reference Andrade and Sellers1988; Wang et al., Reference Wang, Deser, Yu, DiNezio and Clement2016). During El Niño events, the Pacific storm track shifts southward, and the southwestern United States generally experiences wetter, cooler winters than average, whereas La Niña winters tend to be drier and warmer (Kiladis and Diaz, Reference Kiladis and Diaz1989; Trenberth et al., Reference Trenberth, Branstator, Karoly, Kumar, Lau and Ropelewski1998). Southwest winters are also influenced by northern Pacific SST temporal variation known as the Pacific Decadal Oscillation (PDO). The PDO alternates between positive (warmer) and negative (colder) phases every 20–30 yr, in contrast with the 2–10 yr ENSO cycle. Colder PDO phases are linked to winter drought in the Southwest, but warm PDO phases often enhance El Niño winter precipitation in this region (Sheppard et al., Reference Sheppard, Comrie, Packin, Angersbach and Hughes2002).
Methods
Fieldwork involved documenting 16 stratigraphic profiles. Arroyos provided extensive natural exposures, and profile locations were selected based on accessibility and the presence of fresh, vertical exposures and datable material. Three profiles are along the western margin of the Cienega Amarilla spring mound where modern arroyo cutting and widening has removed part of the mound (Fig. 2a). Five other profiles are upstream and southeast of the spring mound. Eight study profiles are on the western margin of the Cottonwood Canyon floodplain and are ~3 km south of the Cienega Amarilla spring mound (Figs. 1 and 2b). Supplementary Table 1 contains geographic coordinates of Cienega Amarilla and Cottonwood Canyon profiles. Profile descriptions included sediment texture, color, pedogenic alteration, and stratigraphic boundaries. Stratigraphic units were differentiated based on lithology and/or bounding discontinuities often demarcated by buried soils. These units were correlated spatially via physical tracing, lithostratigraphic characteristics, radiocarbon ages, and temporally diagnostic archaeological artifacts. Samples collected for laboratory analysis and dating included sediment, plant macrofossils, mollusks, and archaeological artifacts.
Forty-four accelerator mass spectrometry (AMS) 14C ages, augmented by temporally diagnostic prehistoric ceramics, provide age control for the alluvial sequences. Prior to destructive 14C dating at the National Science Foundation Arizona Accelerator Mass Spectrometry Laboratory, the macrobotanical samples were identified to genus or species level. Short-lived plant parts (e.g., seeds, stems, and twigs) were preferentially selected, including material from archaeological features (e.g., hearths and roasting pits) and detrital macrofossils from nonarchaeological contexts. 14C pretreatment of both charred and uncharred plant macrofossils followed the standard acid–base–acid protocol. Pretreatment of gastropod shells involved sonication in first milli-Q water and then 3% H2O2, followed by multiple milli-Q water rinses. Radiocarbon ages presented in the text were calibrated using the OxCal v. 4.2 program (Ramsey, Reference Ramsey2009) utilizing IntCal2013 (Reimer et al., Reference Reimer, Bard, Bayliss, Beck, Blackwell, Ramsey and Buck2013), with uncertainties given at the 2-sigma confidence level.
Ten pollen samples from Cienega Amarilla, including two modern surface samples and eight subsurface samples collected from arroyo wall exposures, were processed and analyzed using methods detailed in Smith (Reference Smith1998). Past floodplain vegetation in the spring mound vicinity was inferred by comparing fossil pollen assemblages to modern surface samples from (1) a wetland area within the entrenched modern arroyo channel and (2) the more xeric valley floor terrace. Two Cienega Amarilla sediment samples were processed for mollusks, ostracodes, and algae using procedures detailed in Forester (Reference Forester1988) and Palacios-Fest (Reference Palacios-Fest1994).
Select sediment and soil samples were analyzed for organic carbon content using the dichromate (Walkley-Black) method (Janitzky, Reference Janitzky1986), calcium carbonate content using gas manometry with a Chittick apparatus (Machette, Reference Machette1986), and gypsum content using the gypsum–bassanite phase change method (Lebron et al., Reference Lebron, Herrero and Robinson2009). Initial organic carbon results were multiplied by 1.33 to correct for the systematic incomplete digestion (~76%) of the organic matter (Walkley and Black, Reference Walkley and Black1934; Schumacher, Reference Schumacher2002).
The isotopic (δD and δ18O) composition of water collected from a Cienega Amarilla spring pool was analyzed on a gas-source isotope ratio mass spectrometer (Finnigan Delta S) at the University of Arizona Environmental Isotope Laboratory. Standardization is based on Vienna Standard Mean Ocean Water (VSMOW) and Standard Light Antarctic Precipitation (SLAP) international reference materials.
ALLUVIAL STRATIGRAPHY AND GEOCHRONOLOGY
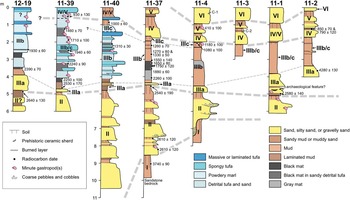
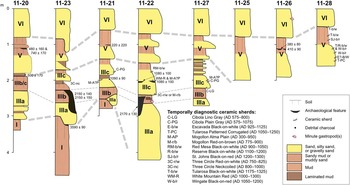
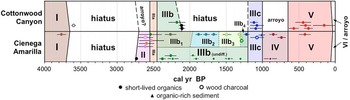
Six stratigraphic units identified at the study exposures were designated Roman numerals I–VI from oldest to youngest. Stratigraphic profiles at Cienega Amarilla and Cottonwood Canyon are illustrated in Figures 3 and 4, respectively. Supplementary Table 2 contains detailed field descriptions. AMS 14C dates (Table 1) are discussed as calibrated, 2-sigma ranges in cal yr BP expressed as the median age±2σ, rounded to the nearest decade. Figure 5 depicts the inferred chronological framework. Soil chemistry results are presented in Figure 6 and Supplementary Table 3. Figure 7 contains pollen analysis results, Supplementary Table 4 contains pollen data, and Supplementary Table 5 summarizes plant macrofossil data. Table 2 contains mollusk and ostracode results.
(color online) Cienega Amarilla stratigraphic sections. C-1 is an undifferentiated Cibola White Ware sherd (AD 650–1325), and C-2 is an early Cibola White Ware sherd with sand temper (AD 800–1000). Radiocarbon dates are 2-sigma ranges in cal yr BP expressed as the median age±2σ, rounded to the nearest decade. Age in italics was rejected as anomalously old for context, and sample is probably redeposited. See web version of article for color version of this figure that differentiates groundwater carbonate facies.

(color online) Cottonwood Canyon stratigraphic sections. Radiocarbon dates are 2-sigma ranges in cal yr BP expressed as the median age±2σ, rounded to the nearest decade. Age in italics was rejected as anomalously old for context, and sample is probably old wood.

(color online) Geochronology of Cienega Amarilla and Cottonwood Canyon areas. Radiocarbon dates are calibrated ages plotted with 1-sigma standard deviation bars. Two rejected dates (see Table 1) are excluded. See web version of article for color version of this figure that depicts stratigraphic context of individual dates and shows dates associated with groundwater carbonate facies outlined in white.

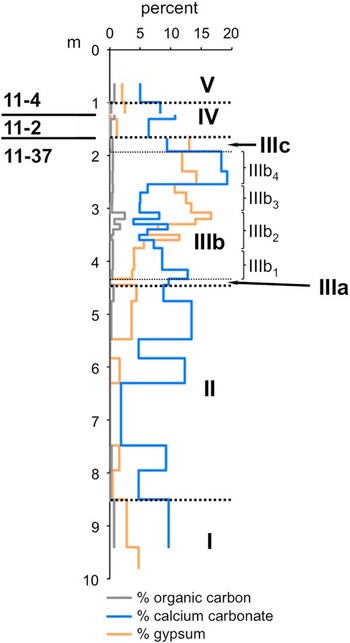
(color online) Cienega Amarilla soil geochemistry at profiles 11-4, 11-2, and 11-37.

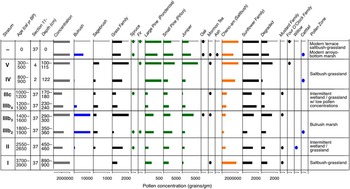
(color online) Cienega Amarilla pollen analysis results showing pollen concentrations in grains per gram. Oval symbols indicate presence. Supplementary Table 4 contains raw data and additional details.

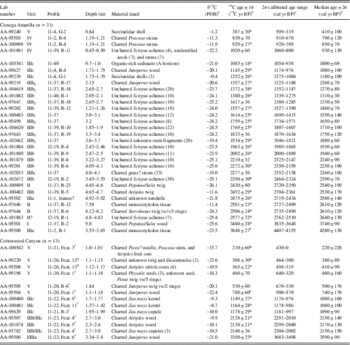
Accelerator mass spectrometry radiocarbon dates and δ13C values from Cienega Amarilla and Cottonwood Canyon.

Note: Asterisk (*) indicates high-precision analysis (multiple spectrometer targets).
a Pee Dee Belemnite reference standard.
b Radiocarbon ages are corrected for carbon-isotope fractionation, and standard deviations are given at 1-sigma.
c Radiocarbon ages were calibrated using the OxCal v. 4.2 program (Ramsey, Reference Ramsey2009) utilizing IntCal2013 (Reimer et al., Reference Reimer, Bard, Bayliss, Beck, Blackwell, Ramsey and Buck2013).
d Simple median of the 2σ calendar range with error being one-half the calendar range, both rounded to nearest decade.
e Rejected age that is anomalously old for context (old wood or redeposited).
f Site LA170848.
g Site LA170847.
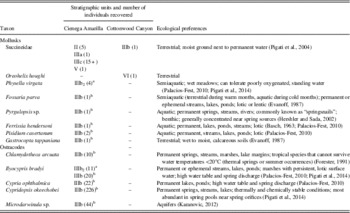
Fossil mollusks and ostracodes at Cienega Amarilla and Cottonwood Canyon.
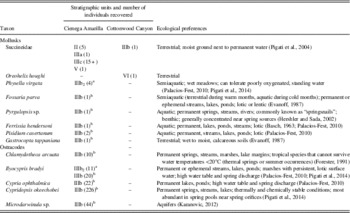
a Extracted from 100 g of ~1900–1800 cal yr BP sediment from profile 11-37, 3.4–3.6 m below surface.
b Extracted from 100 g of ~2300–2200 cal yr BP sediment from profile 11-39, 3.22–3.47 m below surface.
Stratum I
Exposed at only two Cienega Amarilla profiles, stratum I is ~1.5 m thick and consists of gray silty clay alluvium that caps sandstone bedrock (Fig. 8). Stratum I soil formation is weak, consisting of an ABb horizon with strong angular blocky ped structure and slightly elevated organic carbon content. Plant macrofossils consist mostly of juniper and cottonwood/willow charred wood, including a fragment that provided a 14C age of 3740±90 cal yr BP (AA-95501). Lacking bulrush or cattail pollen grains, stratum I pollen resembles the modern terrace assemblage, and the dominant Cheno-am (Chenopodium and Amaranthus) signal is attributed primarily to four-wing saltbush.
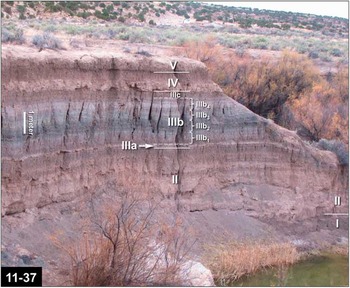
(color online) Arroyo exposure at Cienega Amarilla profile 11-37 showing unit IIIb subdivisions.

Stratum I at Cottonwood Canyon consists of >2 m of sandy mud overprinted with a weakly developed soil (Btjkb horizon) with subangular blocky ped structure, carbonate filaments, and minor illuvial clay. Coarser and less organic-rich than correlative stratum I deposits at Cienega Amarilla, Cottonwood Canyon stratum I represents a better drained and slightly higher energy fluvial environment. 14C-dated juniper charcoal from an archaeological thermal feature at its upper contact suggests that stratum I deposition at Cottonwood Canyon ended before 3590±90 cal yr BP (AA-95506).
Stratum II
Stratum II consists of a 2- to 4.5-m-thick package of sandy stream alluvium with interbedded mud layers. It is present at Cienega Amarilla in exposures deeper than ~4 m but absent at Cottonwood Canyon. Where not erosionally truncated, the upper meter of stratum II contains a weak soil profile with ABkjb-Bwb horizonation. Some of the deeper, clay-rich beds are laminated, and others show evidence of incipient pedogenesis implying episodic deposition. Detrital plant remains are dominated by charred wood from juniper, piñon pine (Pinus edulis), cottonwood/willow, and greasewood (Sarcobatus sp.). Bulrush achenes (fruits) and possible common reed (Phragmites sp.) stems are locally present. Three radiocarbon ages associated with stratum II range from 2610±120 cal yr BP (AA-97644) near its base to 2540±190 cal yr BP (AA-100899) at its top and suggest rapid deposition. Compared with stratum I, stratum II pollen concentrations exhibit decreased Cheno-ams, increased grasses, and the appearance of sagebrush (Artemisia sp.) and bulrush. Succineidae (small, semiaquatic gastropods) shells are scattered throughout stratum II.
Stratum III
Stratum III is typically ~3 m thick at Cienega Amarilla, where tufa and marl facies dominate the spring mound area and clay-rich paludal (marsh) facies dominate the surrounding floodplain. Correlative Cottonwood Canyon deposits are generally thinner and consist entirely of fluvial deposits. Stratum III was divided into three subunits—IIIa, IIIb, and IIIc—to simplify its description and interpretation.
IIIa
At Cienega Amarilla, stratum IIIa is a ~0.1- to 1.0-m-thick fluvial deposit of sand or muddy sand. It is a distinct marker horizon identifiable at most Cienega Amarilla profiles (Fig. 8). At Cottonwood Canyon, stratum IIIa is 0.3–1.7+ m thick, consists of sand with pebble lenses, and is separated from stratum I by an erosional contact. Taxa represented by plant macrofossils are similar to stratum II except that cottonwood/willow is absent. 14C dates on charred twigs from immediately below and above IIIa at Cienega Amarilla bracket the age of stratum IIIa between 2540±190 (AA-100899) and 2530±170 cal yr BP (AA-100482), and a charred nutshell within IIIa has a 14C age of 2580±140 cal yr BP (AA-95502). Stratum IIIa might represent a single storm, although a possible archaeological thermal feature within this unit at Cienega Amarilla suggests it represents multiple precipitation events over at least several decades or, at most, a few centuries.
IIIb
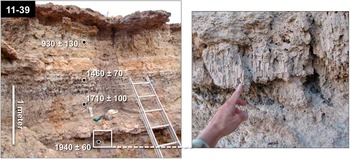
At the Cienega Amarilla spring mound, stratum IIIb is dominated by groundwater carbonate facies (Fig. 9). Tufa layers that formed in situ are typically <30 cm thick and consist primarily of spongy tufa with vertically oriented voids that formed around reedy vegetation. Some of the tufa strata, however, are dense and laminar flowstones or powdery wetland marls. Tufa deposition at the spring mound began shortly after 2250±100 cal yr BP (AA-99201) and accumulated at a rapid rate until 1460±70 cal yr BP (AA-99202). Uncharred bulrush achenes and stems tentatively identified as bulrush are abundant. Gastropods and ostracodes from IIIb spring mound deposits dating 2240±90 cal yr BP (AA-101879) include a variety of types, including aquatic, semiaquatic, and terrestrial species (Table 2). The groundwater carbonate layers are interbedded with very thinly bedded alluvium composed of sand and tufa rip-up clasts. Many of the alluvial beds are black mats darkened by organic-rich sediment containing plant macrofossils, including some partially decomposed stems (bulrush?) still oriented in upright growth positions suggestive of burial by rapid, episodic deposition.
(color online) Groundwater carbonate and black mat deposits at profile 11-39 at Cienega Amarilla spring mound showing upper ~3 m of exposure (left) and a close-up of spongy tufa with vertically oriented voids that formed around reedy emergent aquatic vegetation immediately above the 1940±60 cal yr BP date (right). Radiocarbon ages are 2-sigma ranges in cal yr BP expressed as the median age±2σ, rounded to the nearest decade.
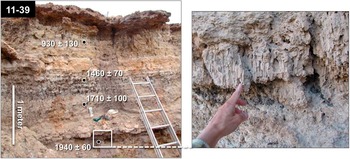
Stratum IIIb floodplain deposits surrounding the Cienega Amarilla spring mound are dominated by clay-rich, marsh facies. Stratum IIIb was examined in detail only at profile 11-37 where a fresh exposure could be safely accessed. Here, IIIb was further subdivided into IIIb1–IIIb4 to facilitate discussion (Fig. 8).
Substratum IIIb1 comprises the basal ~50 cm of stratum IIIb and consists of gray, clay-rich deposits. Charred stems from 20 cm above the slightly oxidized base of IIIb1 at profile 11-37 yielded an age of 2260±100 cal yr BP (AA-102033), but a 2530±170 cal yr BP (AA-100482) age on a charred saltbush twig from the base of clay-rich IIIb deposits beneath the carbonate spring mound suggests IIIb deposition at Cienega Amarilla began earlier. Above IIIb1 is a ~60-cm-thick, thinly bedded, organic-rich “black mat” (IIIb2). Radiocarbon dates on plant macrofossils indicate that the IIIb2 black mat formed between 1880±60 cal yr BP (AA-102662) and 1650±80 cal yr BP (AA-95499), with the most organic-rich portion dating prior to 1750±120 cal yr BP (AA-97643). Identifiable plant remains in IIIb2 consist mostly of abundant bulrush achenes and pollen indicative of emergent aquatic vegetation. Ubiquitous stem fragments are degraded and too poorly preserved to be identified on the basis of anatomy. Their abundance and direct association with bulrush achenes (fruit), however, circumstantially suggest that these stems might also represent bulrush plants. Faunal remains include snail and ostracode species indicative of marshy conditions (Table 2). From the base of IIIb1 to the sharp upper boundary of the IIIb2 black mat, trends of decreasing calcium carbonate (~13%–4%), increasing gypsum (~4%–17%), and increasing organic carbon (0.4%–2.4%) content are evident. Gypsum occurs as tiny clumps of intergrown lathe crystals, whereas carbonate occurs as small soft masses.
The IIIb2 black mat is capped by a ~50-cm-thick, light-olive-gray layer (IIIb3) of very thinly bedded clay with high gypsum content (~11%–13%) but substantially less organics (0.3%–0.5%) than IIIb2. The gypsum deposits precipitated from shallow (1–2 m deep), brackish groundwater wicked to the surface by evaporation (Quade et al., Reference Quade, Rech, Betancourt, Latorre, Quade, Rylander and Fisher2008). Although this horizon’s color and texture resemble wetland marl deposits (cf. Pigati et al., Reference Pigati, Rech, Quade and Bright2014), its carbonate content is relatively low (~5%–6%). In contrast to the underlying black mat, plant macrofossils are less plentiful in IIIb3. Uncharred bulrush achenes from IIIb3’s base produced a 14C date of 1550±140 cal yr BP (AA-100483) and from its top yielded ages of 1330±50 and 1270±80 cal yr BP (AA-97647 and -104619). Pollen continues to be dominated by bulrush, but more grains are degraded, and more nonaquatic plant types are represented, including a significant increase in grass, juniper, and sunflower family.
Substratum IIIb4 forms the upper part of IIIb floodplain deposits and consists of pinkish-gray clay with peak carbonate (~19%) and continued high gypsum (~12%–14%) content. Very thin, wispy bands darkened by fine charcoal probably represent charcoal washed onto the floodplain after wildfires burned the adjacent hillslopes. Charred juniper wood from one of the dark bands provided an age of 1260±70 cal yr BP (AA-99219). Stratum IIIb4 is characterized by substantially decreased amounts of grass, bulrush, and juniper pollen. Lower overall pollen concentrations in this horizon may reflect lower density vegetation or rapid deposition.
At Cottonwood Canyon, stratum IIIb consists of a 20- to 40-cm-thick layer of muddy sand alluvium with a weakly developed soil expressed as a Bwb horizon. The presence of a Succineidae shell might suggest moist surface conditions, although it is possible this isolated shell was reworked from older deposits. Stratum IIIb contains cultural deposits associated with a buried site (LA170848). Charred saltbush wood and maize cupules (cob pockets that held two kernels) from archaeological features at or near the IIIb upper contact provided ages of 2150±140, 2150±150, and 2170±130 cal yr BP (AA-95507, -93782, and -101878), indicating that IIIb deposition at Cottonwood Canyon ended by ~2100 cal yr BP.
IIIc
At Cienega Amarilla, stratum IIIc typically consists of a thin cumulic soil formed in grayish-brown clay (Fig. 8). Most commonly, this soil is expressed as an ABsskyb horizon with slickensides and gypsum and carbonate precipitates. Three 14C dates from IIIc contexts range from 1180±100 (AA-99239; Succineidae shells) to 1000±60 cal yr BP (AA-105541; organic-rich sediment). The IIIc pollen record is nearly identical to that of IIIb4, except that bulrush pollen drops out completely. Plant macrofossils are limited to juniper and oak (Quercus sp.) wood. Succineidae shells are locally common in Cienega Amarilla IIIc deposits.
At Cottonwood Canyon, IIIc consists of alternating layers of sand and mud. A Bwb soil horizon formed in the uppermost mud layer. Temporally diagnostic prehistoric ceramics sherds at the IIIb–IIIc contact at archaeological site LA170848 suggest that IIIc deposition at Cottonwood Canyon began after AD 800, after a millennium-long hiatus (Fig. 4). Charred maize kernels and cupules from archaeological deposits in IIIc yielded clustered 14C ages of 1090±90 (AA-95629) and 1080±100 cal yr BP (AA-100480 and -100481).
Stratum IV
At Cienega Amarilla, stratum IV is ~50–70 cm thick and consists of fluvial sand overlain by mud. A weakly developed soil with ABb-Bwkb horizonation formed at the top of stratum IV in the mud layer. A distinct, 1- to 2-cm-thick layer of burned C4 (inferred from δ13C values) grass stems within the mud layer provided 14C ages of 850±70 and 790±120 cal yr BP (AA-100898 and -95503). An early Cibola White Ware ceramic sherd at the bottom of the burned layer implies the lower (sandy) portion of IV predates AD 1000. Short-lived plant macrofossils including a few bulrush achenes in stratum IV tufa deposits yielded an age of 930±130 cal yr BP (AA-101881). Palynological evidence suggests saltbush-grassland vegetation, but traces of bulrush and cattail pollen indicate nearby marshy areas.
Stratum IV is absent at Cottonwood Canyon, suggesting that stratum IV aggradation at Cienega Amarilla resulted from channel entrenchment in upvalley areas. Paleochannels noted in arroyo wall exposures south of the Cottonwood Canyon study profiles were conceivably formed during this erosional episode.
Stratum V
Stratum V is present at both Cienega Amarilla and Cottonwood Canyon. It is 0.5–1 m thick and consists primarily of sand overlain by grayish-brown mud in which an ABwb soil horizon formed. A Succineidae shell found within the Cienega Amarilla stratum V soil yielded an age of 410±100 cal yr BP (AA-99240) and suggests moist surface conditions. At spring mound exposures, strata IV and V are indifferentiable, but 14C dates suggest localized tufa deposition continued after ~1000 cal yr BP (Fig. 9). Cienega Amarilla stratum V pollen is similar to stratum IV pollen except that bulrush and cattail pollen is absent and plant macrofossils are limited to juniper wood.
Stratum V alluvium at Cottonwood Canyon probably includes sand and gravel paleochannel fills exposed in the modern arroyo walls south of the study profiles. Its age is secured by five 14C dates ranging from 500±170 cal yr BP to 220±220 cal yr BP (AA-95505 and -100542) on short-lived plant macrofossils from archaeological features. At profile 11-28, stratum V contains ceramic sherds and other artifacts redeposited from a Pueblo II–III (AD 900–1300) period archaeological site (LA 170847) situated immediately upslope.
Stratum VI
At both Cienega Amarilla and Cottonwood Canyon, stratum VI is a 0.2- to 1.3-m-thick surface layer of bedded, fluvial sand. 14C ages associated with underlying deposits suggest stratum VI is younger than ~200 cal yr BP. Stratum VI probably represents arroyo fan deposits associated with historical period stream entrenchment.
ISOTOPIC COMPOSITION OF SPRINGWATER
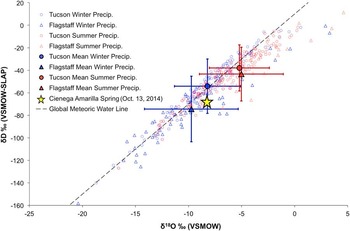
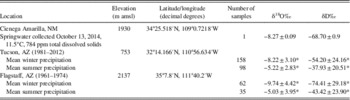
The δD and δ18O values of a Cienega Amarilla springwater sample collected in October 2014 were compared to winter (October–April) and summer (May–September) precipitation isotope data from Global Network of Isotopes in Precipitation (GNIP) stations at Flagstaff (2137 m) and Tucson (753 m) (International Atomic Energy Agency and World Meteorological Organization, 2015). The elevation of Cienega Amarilla (1930 m) is intermediate between the Flagstaff and Tucson GNIP stations. Cienega Amarilla water isotope values fall between the average Flagstaff and Tucson winter values, suggesting that GWD at Cienega Amarilla is driven primarily by winter precipitation (Table 3, Fig. 10).
(color online) Isotopic composition of Cienega Amarilla springwater plotted relative to winter (October–April) and summer (May–September) precipitation isotope data from GNIP (Global Network of Isotopes in Precipitation) stations at Flagstaff and Tucson. Mean values are plotted with 1-sigma standard deviation bars. VSMOW, Vienna Standard Mean Ocean Water; SLAP, Standard Light Antarctic Precipitation.

Isotopic composition of Cienega Amarilla springwater (sample W63110) compared to winter (October–April) and summer (May–September) precipitation isotope data from GNIP (Global Network of Isotopes in Precipitation) stations at Flagstaff and Tucson, Arizona.

Notes: Asterisk (*) indicates calculated using data from International Atomic Energy Agency and World Meteorological Organization (2015). amsl, above mean sea level.
DISCUSSION
Geomorphic history
During the late Holocene, the Cienega Amarilla and Cottonwood Canyon floodplains underwent dramatic and rapid geomorphic changes, experiencing periods of rapid high-energy deposition, slow low-energy deposition, stability and soil formation, deep channel entrenchment and subsequent infilling, and carbonate spring mound and wetland formation. Many of these shifts appear to represent geomorphic and hydrologic responses to climate change and variability.
4000–2700 cal yr BP
The absence of middle and early Holocene deposits in study area exposures suggests erosion of older valley fills prior to ~4000 cal yr BP. This is consistent with arroyo formation 4900–4600 cal yr BP elsewhere in the Carrizo Wash watershed (Onken, Reference Onken2015) and may correlate with widespread arroyo cutting ~4500 cal yr BP in southeastern Arizona (Waters and Haynes, Reference Waters and Haynes2001). Floodplain aggradation of fine-grained alluvium (stratum I) deposited by low-energy surface-runoff processes ~4000–3700 cal yr BP was followed by a depositional hiatus and floodplain stability until ~2700 cal yr BP (Figs. 4 and 11). Drought-tolerant saltbush-grassland floodplain vegetation during this period suggests low water tables; four-wing saltbush—the most likely dominant species—is intolerant of high groundwater and late winter inundation (Ogle et al., Reference Ogle, St. John and Tilley2012). The paleobotanical record indicates a minor component of emergent aquatic plants (bulrush) and phreatophyte trees (cottonwood/willow), suggesting localized marsh and riparian areas.
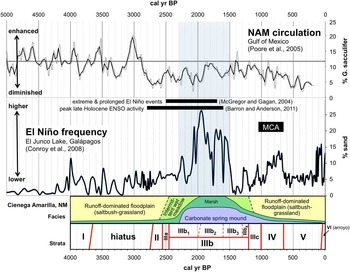
(color online) Cienega Amarilla chronology and reconstructed depositional facies with winter (El Niño) precipitation record from El Junco Lake (Conroy et al., Reference Conroy, Overpeck, Cole, Shanahan and Steinitz-Kannan2008) and summer (North American monsoon) precipitation record from the Gulf of Mexico (Poore et al., Reference Poore, Pavich and Grissino-Mayer2005). The ~2300–1500 cal yr BP interval of maximum late Holocene groundwater discharge at Cienega Amarilla is shaded. ENSO, El Niño–Southern Oscillation; MCA, Medieval Climate Anomaly; NAM, North American monsoon.

2700–2450 cal yr BP
Evidence of a major, ~2700–2550 cal yr BP pulse of alluvial deposition (stratum II) on the Cienega Amarilla floodplain is absent at Cottonwood Canyon (Figs. 3, 4 and 5). This implies either incision in one or both of the upvalley headwater reaches or upland erosion limited to the LA Draw/Agua Fria Creek catchment (Fig. 1). The latter explanation is more plausible because (1) no direct evidence of arroyo cutting during the 2700–2550 cal yr BP period was found at Cottonwood Canyon or elsewhere in the Carrizo Wash watershed, and (2) a locally major pulse of piedmont aggradation occurred ~20 km to the east during this interval (Onken, Reference Onken2015), suggesting significant erosion of some upland mesa areas at this time.
Floodplain aggradation of braided distributary channel deposits (stratum II) at Cienega Amarilla ended by ~2550 cal yr BP. After a brief soil-forming period, aggradation resumed during the 2550–2450 cal yr BP interval, beginning with a pulse of sandy alluvium (stratum IIIa) deposited at both Cienega Amarilla and Cottonwood Canyon. Both the stratum II and IIIa alluvial pulses rapidly buried much of the preexisting Cienega Amarilla floodplain vegetation, likely resulting in a wide, intermittently barren, braided channel covering much of the floodplain. Terrestrial gastropods (Succineidae) in stratum II indicate moist surface soils and nearby permanent water (Pigati et al., Reference Pigati, Quade, Shahanan and Haynes2004) (Table 2). Decreased saltbush and increased sagebrush pollen and greasewood macrofossils dating to the 2700–2450 cal yr BP interval (Fig. 7) suggest decreased summer and increased winter precipitation and a higher local water table. These changes, coupled with increased grass pollen concentrations and groundwater carbonate, imply a transition to moister, intermittent wet meadow floodplain conditions beginning ~2600 cal yr BP (Fig. 11).
2450–1600 cal yr BP
Cienega Amarilla floodplain aggradation from 2450 to 1600 cal yr BP slowed and was dominated by clay-rich GWD deposits (strata IIIb1–IIIb2) indicative of low-energy environments. Significant but localized wetland tufa deposition began ~2300 cal yr BP, resulting in the initial growth of the spring mound. Although mound growth probably continued until historical-period arroyo cutting, it appears most rapid from ~2300 to 1500 cal yr BP. Tufa and marl facies at the spring mound indicate spring orifice, spring pool, and marsh microenvironments associated with significant spring discharge. This implies a shift to groundwater-dominated floodplain processes and a substantial increase in effective moisture.
Snails in Cienega Amarilla tufa deposits dating ~2200 cal yr BP are mostly aquatic types (Pisidium casertanum, Ferrissia hendersoni, and Pyrgulopsis sp.) preferring ambient, lotic (flowing) waters and suggesting high spring discharge from a nearby spring orifice. Associated ostracodes are dominated by Cypridopsis okeechobei, a species that prefers thermally and chemically stable spring pool or orifice habitats (Forester and Smith, Reference Forester and Smith1994; Pigati et al., Reference Pigati, Rech and Nekola2010, Reference Pigati, Rech, Quade and Bright2014). The intermittent wet meadow (IIIb1) surrounding the mound transitioned to marsh (IIIb2) dominated by bulrush ~1900 cal yr BP, indicating increased surface water and spring discharge. The organic-rich marsh deposits contain semiaquatic Physella virgata snails and Ilyocypris bradyi ostracodes characteristic of persistent, lotic surface water in marsh habitats (Palacios-Fest, Reference Palacios-Fest2010; Pigati et al., Reference Pigati, Rech, Quade and Bright2014). Bulrush dominated the vegetation at both the spring mound and the surrounding marsh.
Although alluvial deposits at Cottonwood Canyon indicate lower energy environments during this period, floodplain processes there continued to be dominated by surface runoff. Deposition largely ended by ~2100 cal yr BP and was followed by an extended period of stable floodplain conditions and soil formation. These conditions are consistent with increased effective moisture, increased vegetation stabilizing hillslopes, and decreased runoff/sediment load.
1600–1200 cal yr BP
Cienega Amarilla spring mound growth slowed markedly ~1500 cal yr BP. Increased gypsum and carbonate precipitates in wetland deposits (upper IIIb2, IIIb3, and IIIb4) surrounding the spring mound imply drying of marshy areas caused by decreased GWD and a drop in the water table beginning between ~1600 and 1400 cal yr BP that drove capillary fringe zone soil water salts to saturation. Sulfur for gypsum formation was probably derived from sulfate-rich groundwater, which is common in the local region (Akers, Reference Akers1964; Basabilvazo, Reference Basabilvazo1997). The Supai Formation contains highly mineralized water containing salts including gypsum and carbonate, which enter the overlying aquifers by upward leakage (Akers, Reference Akers1964). Although the pollen record suggests that emergent aquatic plants continued to dominate floodplain vegetation during the early part of the 1600–1200 cal yr BP period, by ~1300 cal yr BP bulrush was substantially reduced, and marshy areas were largely replaced by intermittent wet meadows dominated by grasses and composites. Thin, charcoal-rich zones deposited ~1350–1250 cal yr BP suggest burning of nearby slopes that coincides with a dry period ~1350 cal yr BP indicated by the nearby El Malpais tree-ring record (Grissino-Mayer et al., Reference Grissino-Mayer, Swetnam and Adams1997; Van West and Grissino-Mayer, Reference Van West and Grissino-Mayer2005).
1200–1000 cal yr BP
Between ~1200 and 1000 cal yr BP, a muddy cumulic soil (stratum IIIc) formed at Cienega Amarilla in areas surrounding the spring mound. The absence of riparian or aquatic indicators in the pollen and macrobotanical records suggests continued drying. Although GWD was reduced compared to the 2300–1500 cal yr BP interval, continued tufa deposition at the spring mound suggests that discharge was nonetheless higher than before 2300 cal yr BP. The resumption of floodplain aggradation during the 1200–1000 cal yr BP period at Cottonwood Canyon implies increased runoff and sediment yield from hillslopes perhaps related to reduced vegetation cover caused by drought or fire.
1000 cal yr BP to present
Alluvium younger than ~1000 cal yr BP at Cienega Amarilla is dominated by sandy floodplain facies (strata IV–VI) that indicate a shift from a GWD-dominated floodplain system to one dominated by surface runoff. A distinct, 14C-dated burned layer with C4 grass macrofossils implies summer and winter drought ~900–800 cal yr BP. Arroyo cutting between ~1000 and 650 cal yr BP at Cottonwood Canyon likely resulted in downstream deposition of alluvium (stratum IV) in the Cienega Amarilla area. A brief soil-forming period lasting less than a century was followed by another period of valley aggradation (stratum V) from ~650 to 100 cal yr BP. Historical-period arroyo cutting resulted in some areas being mantled by recent distributary fan alluvium (stratum VI).
Climatic drivers of Cienega Amarilla GWD
The isotopic composition of Cienega Amarilla springwater more closely resembles that of cool-season precipitation (Table 3, Fig. 10), suggesting that GWD is derived mostly from October–April precipitation. Although modern cool-season precipitation totals in the Cienega Amarilla area are generally smaller than warm-season totals, winter and early spring moisture is hydrologically more important than summer rains. Winter and early spring storms are generally more widespread, lower intensity, longer duration, and coincide with cooler temperatures and dormant vegetation; these conditions result in decreased surface runoff and less evaporative and evapotranspirative loss (Bryson and Hare, Reference Bryson and Hare1974; Trewartha, Reference Trewartha1981; Barry and Chorley, Reference Barry and Chorley1998). Thus, groundwater recharge (and discharge) in the southwestern United States is derived primarily from cool-season precipitation because more winter moisture infiltrates into the ground (Eastoe et al., Reference Eastoe, Gu and Long2004), and this generalization appears valid at Cienega Amarilla.
Comparison to other southwestern US records
Other well-dated, climatically sensitive, late Holocene paleoenvironmental records in the larger southwestern US region corroborate both the distinct period of increased effective moisture ~2300–1500 cal yr BP and the subsequent drying trend documented at Cienega Amarilla (Supplementary Figure 1). The southwestern US regional shift to drought conditions ~1600 cal yr BP appears to be an expression of global-scale changes including a major climate and vegetation shift that later culminated during the ~1050–650 cal yr BP Medieval Climate Anomaly (MCA) (Viau et al., Reference Viau, Gajewski, Fines, Atkinson and Sawada2002; Mayewski et al., Reference Mayewski, Rohling, Stager, Karlén, Maasch, Meeker and Meyerson2004), including especially severe drought ~800 cal yr BP (Cook et al., Reference Cook, Woodhouse, Eakin, Meko and Stahle2004, Reference Cook, Smerdon, Seager and Cook2014; Woodhouse et al., Reference Woodhouse, Meko, MacDonald, Stahle and Cook2010).
Moisture-sensitive tree-ring records in the Southwest largely reflect cool-season moisture because most of the annual ring forms as early wood during the spring and early summer (Fritts, Reference Fritts2001). The smoothed tree-ring record at El Malpais, located ~100 km northeast of Cienega Amarilla, suggests generally moister-than-average conditions during the ~2100–1700 cal yr BP interval (Grissino-Mayer, Reference Grissino-Mayer1996). This record’s most severe long-term drought is a 263-yr-long period from ~1700 to 1450 cal yr BP, with especially arid conditions after ~1600 cal yr BP (Grissino-Mayer, Reference Grissino-Mayer1996; Grissino-Mayer et al., Reference Grissino-Mayer, Swetnam and Adams1997). The San Francisco Peaks tree-ring record in north-central Arizona indicates above average temperatures from 1600 to 1250 cal yr BP (Salzer, Reference Salzer2000; Van West and Grissino-Mayer, Reference Van West and Grissino-Mayer2005) that culminated in a pronounced, ~1300–1100 cal yr BP warming trend evident in tree-ring records throughout western North America (Trouet et al., Reference Trouet, Diaz, Wahl, Viau, Graham, Graham and Cook2013).
Oxygen isotope data suggest that southwestern cave records are proxies generally more biased toward reflecting winter rather than summer precipitation amounts, especially during the past several thousand years (Truebe et al., Reference Truebe, Ault and Cole2010). Although speleothem annual band thickness and δ18O records in the Guadalupe Mountains of southeastern New Mexico suggest greatest late Holocene effective moisture there between ~2800 and 2600 cal yr BP, a secondary peak was evident ~2000 cal yr BP, and thinner bands or aragonite layers from ~1700 to 1300 cal yr BP imply drier conditions (Polyak and Asmeron, Reference Polyak and Asmerom2001; Asmerom et al., Reference Asmerom, Polyak, Burns and Rassmussen2007).
The δ13C composition of 14C-dated sediment at Abo Arroyo in central New Mexico suggests a late Holocene interval of cooler temperatures and wetter winters that was most pronounced from ~2400 to 1400 cal yr BP and then ended abruptly (Hall and Penner, Reference Hall and Penner2013). Aquatic plant macrofossils in the ~10,000 yr record at Stoneman Lake in central Arizona were most abundant from ~2000 to 1600 cal yr BP, suggesting high lake levels and increased effective moisture during this period (Hasbargen, Reference Hasbargen1994). Similarly, mollusks at the La Playa archaeological site in northern Sonora, Mexico, imply peak GWD from ~2300 to 1600 cal yr BP (Copeland et al., Reference Copeland, Quade, Watson, McLaurin and Villalpando2012). In southern Nevada, the resumption of black mat formation beginning ~2300 cal yr BP after a ~4500 yr hiatus implies enhanced GWD associated with increased winter precipitation (Quade et al., Reference Quade, Forester, Pratt and Carter1998; Winograd et al., Reference Winograd, Riggs and Coplen1998). A high-resolution pollen record from Lower Pahranagat Lake in southern Nevada suggests a ~2100–2000 cal yr BP climate event characterized by dramatic increases in pine, juniper, and sagebrush pollen interpreted to indicate unusually wet winters (Wigand and Rhode, Reference Wigand and Rhode2002).
In summary, a variety of paleoenvironmental proxies from across the Southwest region suggest a period of unusually wet winters from ~2300 to 1500 cal yr BP followed by a distinct drying trend leading up to the MCA. Therefore, the distinct, latest Holocene period of enhanced cool-season precipitation evident at Cienega Amarilla appears to be part of a broader pattern driven by large-scale meteorological processes.
Historical cool-season precipitation variability
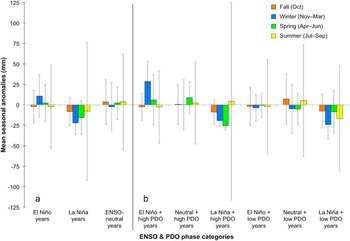
Climate divisions are areas of general modern climate homogeneity. Statistical analysis of historical climate division data from 1905 to 2005 indicates significantly (P < 0.05) increased (decreased) winter precipitation during El Niño (La Niña) years across the southern United States, with very high correlation (P < 0.0001) for the climate division containing Cienega Amarilla (Kurtzman and Scanlon, Reference Kurtzman and Scanlon2007). Between 1895 and 1996 the climate division containing Cienega Amarilla received 67% more December–March precipitation during El Niño years than during non–El Niño years (Lenart, Reference Lenart2006). At the nearest weather station with a relatively complete precipitation record (Springerville, AZ), El Niño winters (December–March) from 1950–2004 were on average 18% wetter than normal, and La Niña winters were 22% drier (Western Regional Climate Center, 2016) (Fig. 12a).
(color online) Seasonal precipitation anomalies of (a) ENSO phases and (b) ENSO and PDO phase combinations based on Springerville, Arizona, historical climate data from 1950 to 2004. Monthly data were pooled by season, and two PDO phases are represented (low from 1950 to 1977 and high from 1978 to 2004) per Kurtzman and Scanlon (Reference Kurtzman and Scanlon2007). ENSO and PDO phase of each year as identified by Guan et al. (Reference Guan, Vivoni and Wilson2005). Standard deviation (1σ) bars show temporal variability. ENSO, El Niño–Southern Oscillation; PDO, Pacific Decadal Oscillation.

Kurtzman and Scanlon (Reference Kurtzman and Scanlon2007) found that PDO phase has a significant (P < 0.1) effect on winter precipitation amount only in the south-central United States, including the climate division containing Cienega Amarilla, where the effect is relatively pronounced (with a P value in the 0.0011–0.01 range). The strengthening of El Niño (La Niña) positive (negative) anomalies during a PDO warm (cold) phase and reducing this effect during a PDO cold (warm) phase is known as the El Niño (La Niña) Decadal Modulation (Kurtzman and Scanlon, Reference Kurtzman and Scanlon2007). The Southwest, including Cienega Amarilla, is subject more to the effects of the El Niño Decadal Modulation than to the La Niña Decadal Modulation (Brown and Comrie, Reference Brown and Comrie2004; Kurtzman and Scanlon, Reference Kurtzman and Scanlon2007). We evaluated the effect of PDO on winter precipitation at Cienega Amarilla by pooling Springerville 1950–2004 monthly precipitation data by season, splitting the data into six ENSO and PDO phase categories, and calculating precipitation deviations by subtracting the long-term mean from the category-mean (Fig. 12b). Mean seasonal anomalies at Cienega Amarilla show (1) a strong El Niño Decadal Modulation effect (28% above normal winter precipitation during positive PDO and 4% below normal during negative PDO); (2) a weak La Niña Decadal Modulation effect (24% below normal during negative PDO and 19% below normal during positive PDO); and (3) near-normal cool-season precipitation for ENSO neutral years during both cold and warm PDO phases.
Possible century-scale paleoclimatic teleconnections
Cienega Amarilla likely experienced prehistoric periods with significantly greater cool-season precipitation than represented in the historical climate record. The study area lies immediately east of areas that presently receive more winter precipitation and have a more pronounced bimodal precipitation pattern (Sheppard et al., Reference Sheppard, Comrie, Packin, Angersbach and Hughes2002: fig. 3). The boundary between the two precipitation patterns is determined by the relative strengths of the air masses that bring winter and summer moisture, and its location has shifted over time (Dean, Reference Dean1988). McGregor and Gagan (Reference McGregor and Gagan2004) argue that equatorial western and central Pacific coral δ18O records indicate that more severe and longer El Niño events occurred in the past than are evident in the modern instrumental record. Based on terrestrial and marine proxies from sites along the northeastern Pacific margins, Barron and Anderson (Reference Barron and Anderson2011) concluded that many western North America spatial climate patterns and shifts during the Holocene are related to changes in ENSO and PDO phases. They concluded that the establishment of modern climate conditions between 4200 and 3000 cal yr BP at the beginning of the late Holocene involved a shift to more variable, El Niño–like, and warm PDO-like conditions in the Pacific Ocean that resulted in an intensified or eastwardly shifted wintertime Aleutian Low and a weaker or more southwardly displaced North Pacific High.
Climatic teleconnections between the subtropical and North Pacific and spatial precipitation patterns in western North America during the Holocene are better understood at annual to decadal scales than at century to millennial scales (Barron and Anderson, Reference Barron and Anderson2011). At Cienega Amarilla, an abrupt shift to a GWD-dominated system ~2300 cal yr BP and transition back to a runoff-dominated system ~1000 cal yr BP imply significant changes in winter precipitation. Assuming that annual- and decadal-scale atmospheric processes can be extrapolated to longer time scales because of the coherency of atmospheric dynamics, these changes suggest an interval of unusually strong and frequent El Niños and persistently warm PDO conditions in the Pacific from ~2300 to 1500 cal yr BP that resulted in unusually wet winters in the southwestern United States.
El Niño proxies
Modeling studies and proxy evidence from the eastern equatorial Pacific indicate peak late Holocene ENSO activity between ~2800 and 1600 cal yr BP (Fig. 11) that implies a more positive/warm PDO phase in the North Pacific (Barron and Anderson, Reference Barron and Anderson2011). A proxy record of the strength of NAM circulation provided by the relative abundance of Globigerinoides sacculifer from Gulf of Mexico seafloor sediment cores suggests that this period of stronger and more frequent El Niño events was preceded by substantial weakening of monsoonal circulation from ~3000 to 2800 cal yr BP (Fig. 11) (Poore et al., Reference Poore, Pavich and Grissino-Mayer2005).
Using El Junco Crater Lake sediment core grain-size data from the Galápagos Islands in the core ENSO area, Conroy et al. (Reference Conroy, Overpeck, Cole, Shanahan and Steinitz-Kannan2008) identified an interval of peak Holocene El Niño frequency between 2000±100 and 1500±70 cal yr BP that is roughly coincident with the Cienega Amarilla pluvial (Fig. 11). Annually resolved, equatorial coral δ18O records from the northern and central equatorial Pacific similarly suggest anomalously extreme and prolonged El Niño events between 2500 and 1700 cal yr BP, including a 4 yr event with almost twice the amplitude of the 1997–1998 event and a 7 yr event that is longer than any known Holocene or modern event (McGregor and Gagan, Reference McGregor and Gagan2004) (Fig. 11). The Cienega Amarilla ~1500–1000 cal yr BP drying trend is similarly consistent with Conroy et al.’s (Reference Conroy, Overpeck, Cole, Shanahan and Steinitz-Kannan2008) Galápagos record, which indicates El Niño frequency decreased precipitously after ~1600 cal yr BP and remained especially low until ~1300 cal yr BP, implying diminished winter precipitation during this period in the southwestern United States.
Archaeological implications
Springs are sacred places of power to Southwest indigenous people (Rea, Reference Rea2008), and Cienega Amarilla was undoubtedly a focus of prehistoric human activity during the late Holocene. The springs not only provided a reliable freshwater source, but also attracted game and waterfowl and offered unique riparian and paludal plant resources including cattail. Cattail pollen has a high caloric return (Simms, Reference Simms1987) and remains important in contemporary Puebloan religious practices (Parsons, Reference Parsons1939). On a regional scale, Pueblo I (1200–1050 cal yr BP) villages were often established near marshes, and later Puebloans inhabiting places lacking natural wetlands often created artificial marshes by constructing reservoirs (Anderson and Potter, Reference Anderson and Potter2015).
Several large Pueblo II (1050–800 cal yr BP) and Pueblo III (800–650 cal yr BP) period archaeological surface sites are recorded within several kilometers of the Cienega Amarilla spring mound. Buried Basketmaker II (2450–1450 cal yr BP), Pueblo I (1200–1050 cal yr BP), and Protohistoric (500–350 cal yr BP) period sites discovered during this study at Cottonwood Canyon are intriguing because sites dating to these cultural periods are poorly represented in the surrounding area (Huber, Reference Huber2005). Directly dated maize macrofossils from thermal features at these sites suggest maize agriculture was practiced ~2150 and 1100 cal yr BP in the Cienega Amarilla area (Table 1).
The 2300–1500 cal yr BP interval of substantially increased effective moisture indicated by the Cienega Amarilla stratigraphic record and corroborated by numerous other paleoenvironmental proxies probably resulted in improved conditions for maize agriculture over much of the Southwest region. Increased areas with shallow groundwater would have encouraged water-table farming, a strategy that Mabry (Reference Mabry2005) argued was a highly optimal agricultural niche in terms of risk, labor, yield, and efficiency. Although areas suitable for groundwater farming were probably not extensive, increased cool-season precipitation likely resulted in widespread, consistently favorable conditions for dryland and floodwater farming. Residual winter and early spring soil moisture can extend the maize growing season by making seed germination possible well before the onset of the summer monsoon, thereby increasing the odds of a successful crop, especially at low and middle elevations.
The ~2300–1500 cal yr BP period of inferred peak cool-season precipitation at Cienega Amarilla during the late Holocene coincides with significant cultural change in the American Southwest. During this interval, prehistoric human populations grew and became more sedentary and dependent on agriculture; these changes are evident at Basketmaker II sites on the southern Colorado Plateau and Cienega phase sites in central and southeastern Arizona (Cordell and McBrinn, Reference Cordell and McBrinn2012). This pattern extended south into northern Sonora, Mexico, and is typified by the La Playa site, where peak human occupation from 2300 to 1500 cal yr BP was followed by a sharp decline (Copeland et al., Reference Copeland, Quade, Watson, McLaurin and Villalpando2012). It seems reasonable to speculate that enhanced cool-season precipitation in the Southwest region resulting from more frequent and/or stronger El Niño events and persistently high PDO conditions at this time were a catalyst for these cultural changes.
CONCLUSIONS
Cool-season precipitation at Cienega Amarilla exceeded a local hydrologic threshold ~2300 cal yr BP, causing a shift from runoff-dominated to groundwater discharge–dominated floodplain processes. Markedly increased GWD indicated by rapid growth of a tufa spring mound and development of a surrounding marsh during the ~2300–1500 cal yr BP interval was followed by a sudden and pronounced decline during the 1500–1000 cal yr BP interval. The ~2300–1500 cal yr BP period of enhanced GWD at Cienega Amarilla may be linked to more frequent or stronger El Niños and persistently warm (positive) PDO conditions that surpass those evident in the modern instrumental record. Recognition of this interval contributes to our understanding of teleconnections between Pacific climate patterns and spatial precipitation patterns in western North America at centennial time scales. Modern El Niño events coinciding with warm PDOs usually result in wetter than normal winters in the south-central United States (New Mexico through Louisiana) (Kurtzman and Scanlon, Reference Kurtzman and Scanlon2007), and it is plausible that this spatial precipitation pattern extends back several millennia. The ~2300–1500 cal yr BP interval of increased cool-season moisture coincides with significant cultural changes during the Basketmaker II period on the southern Colorado Plateau and the Cienega phase in central and southeastern Arizona and northern Sonora. These changes—which include increased sedentism, dependence on maize agriculture, and population growth—may have been fostered by increased cool-season precipitation.
Acknowledgments
This research was funded by the National Science Foundation (NSF) (Doctoral Dissertation Improvement Grant #1041950 and IGERT Fellowship in Archaeological Science); the Geological Society of America (Graduate Student Research Grant and Claude C. Albritton Jr. Scholarship Award); the Philanthropic Educational Organization (Scholar Award); the Colorado Scientific Society (William G. Pierce Research Grant); the Charles Redd Center for Western Studies (Graduate Student Summer Fieldwork Award); the NSF-Arizona Accelerated Mass Spectrometry Laboratory; the Argonaut Archaeological Research Fund; and the University of Arizona Department of Geosciences (Dr. H. Wesley Peirce, Bert Butler, and Keith L. Katzer scholarships). Brenda Wilkinson and David Simons (Bureau of Land Management) and David Eck (New Mexico State Land Office) provided permits (BLM permit 273-8152-11; NMSLO ROE-1712 and CPRC Project-Specific permit #SE-300). We thank Susanne and the late Clifford Thorn and Mark Hubbell (landowners); David Dettman (isotope analysis); John Douglass and Shane Miller (fieldwork help); Barbara Mills, Dean Wilson, Matt Peeples, and Patricia Gilman (ceramic identification); and Zackry Guido and Jan Null (climate information). This research benefitted from discussions with Vance Haynes, Stephen Hall, and Jordon Bright. An early version of the manuscript benefitted from input by Jay Quade, Vance Holliday, and Barbara Mills. Lastly, we appreciate the thorough and constructive peer reviews provided by Jeff Pigati and two anonymous reviewers.
Supplementary material
To view supplementary material for this article, please visit https://doi.org/10.1017/qua.2016.14