I. INTRODUCTION
Recently, porous carbon materials doped with heteroatoms, such as oxygen, nitrogen, and phosphorus, have attracted considerable attention to some electrochemical energy devices (supercapacitors, fuel cells, researchable batteries, and metal-air batteries) due to several unique properties of heteroatom-incorporating surface active sites.Reference Hulicova-Jurcakova, Seredych, Lu, Kodiweera, Stallworth, Greenbaum and Bandosz1,Reference Wang, Sun, Zhou, Wan, Zhang and Qiu2 Nitrogen- and oxygen-containing surface groups are common functionalities of the carbon electrode materials, which can be generated through various activations.Reference Kim, Abe, Yanagiura, Park, Shimizu, Iwazaki, Nakagawa, Endo and Dresselhaus3–Reference Li, Liu, Li, Yang, Shen, Huang, Xiang and Li5 Apart from the porous structure, the activated carbons exhibit a complex surface chemistry that alters the electrochemical energy storage of the carbon.Reference Deng, Xie, Zou and Ji6,Reference Kodama, Yamashita, Soneda, Hatori and Kamegawa7 Besides oxygen, nitrogen is the most common heteroatom studied from the point of view of its effects on the catalyticReference Klinik, Samojeden, Grzybek, Suprun, Papp and Gläser8 and electrochemical performanceReference Fiset, Rufford, Seredych, Bandosz and Hulicova-Jurcakova9–Reference Xu, Hou, Cao, Wu and Yang11 of the activated carbons. When nitrogen-rich carbons are synthesized or modified at high temperatures, the majority of their nitrogen is present as pyrrolic (N-5), pyridinic (N-6), quaternary (N-Q), or pyridinic-N-oxides (N-X).Reference Zhang, Wen, Ci, Mao, Chen and He12 Besides negatively charged nitrogen in the pyridinic and pyrrolic arrangements, which are assumed to take part in the pseudocapacitive Faradaic reactions,Reference Jurewicz, Babeł, Ziółkowski and Wachowska13,Reference Lota, Grzyb, Machnikowska, Machnikowski and Frackowiak14 the quaternary and pyridinic-N-oxides, when distributed in the pores accessible to ions, were found as important in enhancing the capacitance.Reference Wang, Wang, Song, Li, Ji, Wang, Li and Wang15 Recently published research suggested that N-5 and N-6 groups were located at the edges of graphene layers while N-Q and N-X nitrogen were intrinsic atoms.
Generally, two basic strategies may be applied aiming at insertion of nitrogen atoms in a carbon matrix. They are (i) thermal degradation of N-containing (synthetic or natural) precursors in the absence of oxygenReference Nowicki, Pietrzak and Ryczkowki16 and (ii) thermal treatment of carbon materials being in contact with low molecular compounds containing nitrogen (ammonia, urea, amines, etc.).Reference Hulicova-Jurcakova, Seredych, Lu, Kodiweera, Stallworth, Greenbaum and Bandosz1,Reference Hulicova-Jurcakova, Seredych, Lu and Bandosz17,Reference Peng, Ma, Sun, Zhang, Yang and Lei18 The results of these strategies are different. The first approach (i) yields in bulk nitrogenated carbon matrices, while in the case of the second strategy (ii), one may expect carbon matrices modified in a superficial manner only. Several carbon materials may be treated according to the scenario (ii): activated carbon,Reference Wang and Yang19,Reference Watson, Nieto Delgado and Logan20 carbon fibers,Reference Ghasemi, Shahgaldi, Ismail, Kim, Yaakob and Wan Daud21,Reference Yang, Zou, Su, Zhu, Jiang, Shen and Li22 carbon nanotubes,Reference Czerw, Terrones, Charlier, Blase, Foley, Kamalakaran, Grobert, Terrones, Tekleab, Ajayan, Blau, Rühle and Carroll23–Reference Wang , Iyyamperumal , Roy, Xue, Yu and Dai26 graphene oxide,Reference Shui, Wang, Du and Dai27–Reference Feng, Chen and Chen29 and reduced graphene oxide.Reference Wang, Zhang, Xia, Roy, Chang, Baek and Dai30 Manner (i) may also include hydrothermal carbonizationReference Hu, Liu, Ke and Wang31–Reference Duan , Fan and Shen33 and/or high temperature annealing.Reference Li, Chen, Li, Shi, Wan, Wang, Jiang and Zhao34–Reference Pollak, Salitra, Soffer and Aurbach36 Employing the nitrogen plasma method causes the preparation of N-doped graphene.Reference Jeong, Lee, Shin, Choi, Shin, Kang and Choi37,Reference Wang, Shao, Matson, Li and Lin38 Another method is the arc-discharge process leading to the receipt of specific boron carbon nitride nanotubes.Reference Ben Belgacem, Hinkov, Yahia, Brinza and Farhat39 Several N-rich organic materials may be treated in the first approach: melamine,Reference Li, Chen, Li, Shi, Wan, Wang, Jiang and Zhao34 polyacrylonitryle,Reference Kruk, Kohlhaas, Dufour, Celer, Jaroniec, Matyjaszewski, Ruoff and Kowalewski40–Reference Machnikowski, Grzyb, Machnikowska and Weber42 dicyandiamide,Reference Hu, Liu, Ke and Wang31,Reference Raymundo-Piñero, Cazorla-Amorós and Linares-Solano43 polyaniline,Reference Cong, Radtke, Stumpf, Schröter, McMillan, Rettenmayr and Ignaszak44–Reference Yang, Wu, Chen and Fu46 and polypyrrole.Reference Fuertes and Centeno47,Reference Yang, Weidenthaler, Spliethoff, Mayanna and Schüth48 This method is often criticized because of the high cost of the precursor and a lack of respect toward green chemistry rules. Both shortcomings may be eliminated by means of low-cost, natural renewable precursors like gelatineReference Nam, Park, Kim, Shin, Park, Kim, Lee and Cho49,Reference Schnepp, Zhang, Hollamby, Pauw, Tanaka, Matsushita and Sakka50 and some organic waste, such as fish bones.Reference Wang, Wang, Song, Li, Ji, Wang, Li and Wang15 Although much progress has been made in the area of N-rich carbon for oxygen reduction reaction (ORR) catalysts, challenges still exist: (i) New and greener methods are required for large-scale production; (ii) the control of N doping at specific positions in carbon is still lacking; (iii) a careful control of nitrogen sites, types, and concentration is still highly desired; (iv) the deep understanding of oxygen adsorption and reduction of these carbon catalysts is still lacking, and therefore, new and systematic research is also needed, which may boost the developments of N-doping carbon materials for the ORR in future.
The aim of the current research is to investigate the combination of both synthesis approaches, i.e., (i) and (ii). In terms of the nitrogen content and the structural parameter of such manufactured N-rich activated carbon, natural and/or renewable precursors were selected, i.e., chitin and chitosan. Chitin is a natural material, which is a by-product of fishery. Chitin is also a substrate for a further chemical conversion (deacetylation) to another widely applied biopolymer, i.e., chitosan. Both materials are in fact obtained from renewable resources and are easily accessible on the market. Chitin and chitosan are rich in nitrogen and their structure resembles cellulose. Therefore, they are often called “animal cellulose”. Despite the several already published papers on the manufacturing of N-rich ACs from chitin and chitosan, none of the reports describe a simultaneous use of urea as an additional nitrogenation agent. The current study is consistent with some previous announcements dealing with a urea-supported transformation of chitin and chitosan into porous N-doped carbon matrices applicable as an electrode material or a catalyst.Reference Lee, Jin, Oh, Lee and Park51,Reference Wang, Li, Wu, Liu and Chen52 Despite these announcements, the problem of such manufactured carbons applied as catalysts for the ORR has not been investigated yet. Thus, our study for the first time reports on metal-free ORR carbon catalysts derived from chitin and chitosan (supplemented with urea) and containing nitrogen atoms. The catalytic voltammetry and rotating ring disk electrode methods were used to investigate the electrochemical behavior for the ORR. Nitrogen sorption isotherm, scanning electron microscopy (SEM), and X-ray photoelectron spectroscopy (XPS) were used to study the microstructure and composition.
II. EXPERIMENTAL
A. Na2CO3 activation of chitin
A total of 20 cm3 of distilled water was added to 5 g of chitin powder from shrimp shells (Sigma-Aldrich, Steinheim, Germany), followed by 23 cm3 of a solution of hydrochloric acid (HCl) (Chempur, Piekary Śląskie, Poland) at a concentration of 7.49 × 10⁻⁶ M. In the second step, sodium carbonate (POCH) was dissolved in distilled water and then impregnated into the chitin paste at a volume of 20 cm3, at a concentration equal to 4.04 × 10⁻⁶ M. The resulting mass was allowed since the evaporation of excess water. Chemically impregnated chitin was heated up to the carbonization temperature under N2 flow at the rate of 10 °C/min and was held for 1 h at the carbonization temperature of 700 °C. After carbonization, the samples were cooled down under N2 flow, and carbonized samples were etched with concentrated HCl (for 1 g of carbon, 12 cm3 acid was used); the mixture was stirred with a magnetic stirrer for 20 min and then washed with distilled water until the pH of the solution reached 6–7; it was then dried in an oven at 100 °C for 24 h.
B. ZnCl2 activation of chitin
Commercial chitin powder from shrimp shells (Sigma-Aldrich) served as the precursor. To produce the carbonized chitin, 10 g of chitin was mixed with 20 cm3 of distilled water and 3 cm3 of the 2 M HCl solution. Due to the action of HCl in the presence of water, the chitin paste was partly depolymerized and protonated and therefore was able to soak up water and form a smeary paste. Then, an adequate amount of ZnCl2 in water was mixed with the chitin paste. The mass ratio of dry chitin to dry ZnCl2 was 0.25. The chitin-based and ZnCl2-containing pastes were subjected to oxygen-free carbonization. A portion of the paste was placed in a tubular stove and heat-treated at 700 °C. The rate of temperature increase was 10 °C/min. Carbonization and activation were carried out at 700 °C under N2 inert gas flow for 1 h. The prepared samples were cooled to approximately 60 °C in the time remaining under continuous nitrogen flow. During this method, ZnCl2 crystallites remain in the carbon matrix and can be removed by rinsing with warm distilled water. Therefore, after carbonization, the carbon samples originating from chitin were repeatedly placed in hot distilled water, sonicated (until chloride ions were not detectable), then filtered on a Büchner funnel, and dried.
C. CaCO3 activation of chitosan
Chitosan powder (75–85% deacetylation, medium molecular weight, CAS number: 9012-76-4) was purchased from Sigma-Aldrich. Calcium carbonate was purchased from two different companies: (D1) CaCO3 nanoparticles with a particle diameter in the range of 15–40 nm were purchased form SkySpring Nanomaterials, Inc.; and (D2) synthetic calcium carbonate was purchased from Ciech (Warsaw, Poland). HCl was purchased from Chempur. The manufacturing procedure included the mixing of dry chitosan powder (as carbon matrix precursors) and a dry powder of CaCO3 (as a hard template) was used in a mass ratio of 1:1. The slurry was homogenized by means of an electric blender and dried to evaporate excess water. The dried powder was heated under the flow of nitrogen to the temperature of 800 °C and kept under such conditions for 1 h (tube furnace, Thermolyne F21100, Barnstead Thermolyne Corp., Dubuque, Texas). After cooling, the resulting materials were treated with concentrated HCl for 20 min and subsequently rinsed with distilled water on a Büchner funnel until a pH value of 6–7 was achieved. This step was inevitable to remove carbonate nanocrystals serving as a hard template. The action of HCl opened pores in the carbon matrix by etching of the template. The received carbon materials were dried in an electric oven at 100 °C within 24 h.
Additionally, in the activation procedure, to increase the nitrogen content, in some cases, the addition of an aqueous solution of urea (POCH) in the amount of 20 cm3 at a concentration of 2.08 M or 4.16 M is necessary. The action included the addition of a low molecular reagent, which was supposed to “transport” nitrogen to the carbon matrix. Urea was selected due to the high elemental content of nitrogen in a molecule and high water solubility, enabling the preparation of concentrated solutions. The water solubility of urea allowed for the addition of such a solution to water-based chitin or chitosan paste before carbonization.
Each sample was denoted by a unique symbol consisting of letters: CA_T/A(V), CA_T/A(V)/U(C), CA_T/B(M), CA_T/B(M)/U(C), CH_T/D1 or D2, CH_T/D1, or D2/U(C), where
(i) CA—chitin
(ii) CH—chitosan
(iii) T—temperature of carbonization (°C)
(iv) A(V)—Na2CO3 activator used in volume (cm3), marked V
(v) B(M)—ZnCl2 activator used in mass ratio chitin to ZnCl2, marked M
(vi) D1—CaCO3 activator purchased form SkySpring Nanomaterials (Houston, Texas)
(vii) D2—CaCO3 activator purchased form Ciech (Warsaw, Poland)
(viii) U(C)—impregnation of urea about molar concentration (M), marked C.
D. Porous texture and chemistry characterization
The porous texture, elemental composition, and chemical state of nitrogen bonding on the carbon surface of new nitrogen-rich activated carbons were examined using a number of instrumental methods. The structural parameters of the activated carbons were characterized by a widely approved low-temperature adsorption of nitrogen. The relevant isotherms of all the samples were measured at −196 °C using an ASAP 2010 volumetric adsorption analyzer (Micromeritics, Norcross, Georgia). Before each adsorption measurement, the sample was outgassed under vacuum at 200 °C for about 8 h, generally to a pressure lower than 0.1333 Pa. The specific surface area was calculated from the Brunauer–Emmett–Teller (BET) equation in the partial pressure range of 0.05–0.25 P/P 0 (N2). The micropore volume (V mi) was marked using the equation of Horvath–Kawazoe. The total pore volume (V t) was determined from one point on the adsorption isotherm. The mesopore volume (V me) was determined from the difference of the total pore volume (V t) and the micropore volume (V mi). The distribution of pore width was determined using density functional theory (DFT).
SEM and high-resolution transition electron microscopy (HRTEM) were used to characterize the morphology of carbon materials. Two electron microscope units were applied, respectively: FEI Quanta 3D FEG 200 V to 30 kV and FEI Tecnai F20 X-Twin 200 kV (FEI, Hillsboro, Oregon).
The volumetric elemental composition (carbon, nitrogen, hydrogen, and total residue elements) of the materials was analyzed by means of a combustion elemental analyzer (Vario MACRO CHN, Elementar Analysensysteme GmbH, Langenselbold, Germany).
XPS measurements were performed using a VG Scientific photoelectron spectrometer ESCALAB-210 (Fisher Scientific, Loughborough, United Kingdom) using Al Kα radiation (1486.6 eV) from an X-ray source operating at 14.5 kV and 25 mA. Survey spectra were recorded for all the samples in the energy range from 0 to 1350 eV with a 0.4 eV step. High-resolution spectra were recorded with 0.1 eV step, 100 ms dwell time, and 25 eV pass energy. A ninety-degree take-off angle was used in all measurements. The curve fitting was performed using the AVANTAGE software provided by Thermo Electron (Waltham, Massachusetts), which describes each component of the complex envelope as a Gaussian–Lorentzian sum function; a constant 0.3(±0.05) G/L ratio was used. The background was fitted using the nonlinear Shirley model. Scofield sensitivity factors and measured transmission function were used for quantification.
E. Rotating ring disc electrode measurements
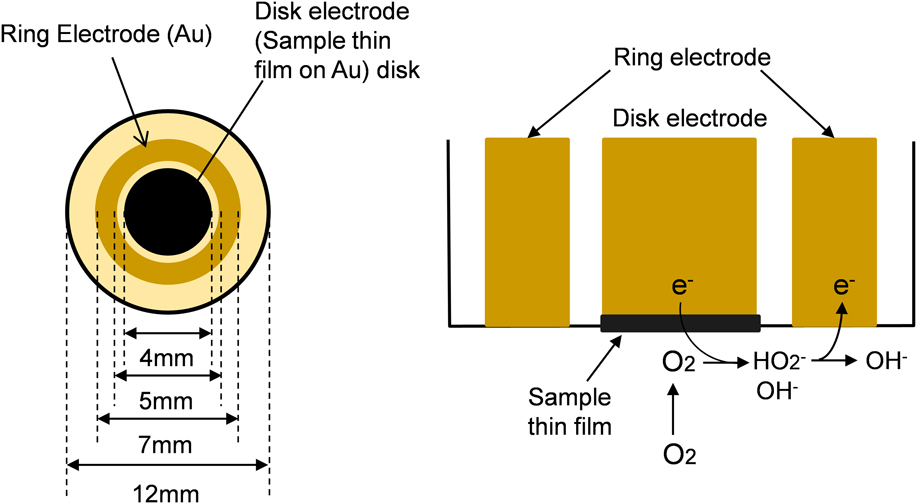
A total of 2 mg of the sample and 10 µL of 5 wt% Nafion dispersion was added to a 1 mL mixture of water and ethanol (1:1 in volume ratio) to obtain the paste of samples for rotating ring disc electrode (RRDE) measurements. The paste obtained was deposited onto the Au RRDE. The diameter of the disk electrode was 4 mm. The external and internal diameter of the ring electrode was 7 and 5 mm, respectively (Fig. 1). As a comparison, the Ketjen Black EC600JD (AkzoNobel, Tarrytown, New York), which is used as a catalyst support for our air electrodes, was deposited onto the disk electrode.
Schematic drawing of RRDE measurement.

The hydrodynamic voltammetry measurement of the samples was thus carried out using a potentiostat (bi-potentiostat Model2325, BAS Inc., Tokyo, Japan) and a rotating ring disk electrode rotator (RRDE-3, BAS Inc., Tokyo, Japan). The electrolyte was a 1 M KOH solution. The counter electrode was a Pt coil (23 cm). The reference electrode was the Hg/HgO electrode. The rotating rate of the disk electrode was in the range of 400 rpm (41.2 rad/s) to 3600 rpm (377.0 rad/s). The scanning rate of the disk electrode potential was −0.010 V/s. The electrode potential of the ring electrode was 0.3 V versus Hg/HgO.
When the linear sweep voltammetry (I–V) curves are measured using the rotating ring disk electrode, the diffusion-limited current (i L) is observed in the linear sweep voltammogram of the disk electrode. The i L can be described as follows:
 $${i_{\rm{L}}}^{ - 1} = {i_{\rm{k}}}^{ - 1} + {\left( {0.620nFAC{D^{2{\rm{/}}3}}{\nu ^{ - 1{\rm{/}}6}}{\omega ^{1{\rm{/}}2}}} \right)^{ - 1}}\quad ,$$
where n, F, A, C, D, and ν mean the number of electrons transferred for oxygen reduction, Faraday constant (96.500 C/mol), area of disc electrode (0.1256 cm2), concentration of O2 (1.103 × 10⁻⁶ M for 1 M KOH solution), diffusion coefficient of O2 (1.76 × 10⁻⁵ cm2/s for 1 M KOH solution), and kinetic viscosity of the electrolyte (0.01 cm2/s), respectively. Therefore, when i L−1 at each rotating rate (ω) is plotted versus ω−1/2 (Koutecky–Levich plot), the number of electrons transferred (n) and the kinetic current (i k) can be obtained by the slope and intercept of the Koutecky–Levich plot, respectively.
The RRDE measurement can be used to understand the kinetics of the ORR. Figure 1 shows the schematic of the RRDE measurement. A sample is pasted on the disk electrode. The disk electrode with the sample is rotated in an alkaline solution saturated with O2 at the rotating rate defined in rad. Thus, O2 diffuses to the disk electrode and reduced to OH− or HO2− by the 4-electron transfer or 2-electron transfer as follows:
 $${{\rm{O}}_2} + {{\rm{H}}_2}{\rm{O}} + 2{{\rm{e}}^ - } \to {\rm{O}}{{\rm{H}}^ - } + {\rm{H}}{{\rm{O}}_2}^ - \quad {E^{\rm{0}}} = - 0.065\;{\rm{V}}\;{\rm{versus}}\;{\rm{NHE}}\quad {\rm{,}}$$
 $${{\rm{O}}_2} + 2{{\rm{H}}_2}{\rm{O}} + 4{{\rm{e}}^ - } \to 4{\rm{O}}{{\rm{H}}^ - }\quad {E^{\rm{0}}} = 0.401\;{\rm{V}}\;{\rm{versus}}\;{\rm{NHE}}\quad {\rm{.}}$$
F. Polarization measurements
Gas diffusion electrodes (GDEs) are composed of a reaction layer and a gas diffusion layer. The powders for reaction layers were obtained by mixing carbon samples and 15 wt% of PTFE. The powders for gas diffusion layers were obtained by mixing acetylene black (AB-7, Denki Kagaku Kogyo Co. Ltd., specific surface area of 47 m2/g) and 30 wt% of PTFE. Powders for the catalytic layer and the gas diffusion layer were stacked on a Ni mesh (100 mesh) and pressed into sheets under the pressure of 2.0 MPa. The stacked sheets were then bound together by hot-pressing under the pressure of 5.2 MPa at 365 °C to produce GDEs of 20 mm in diameter. The obtained GDEs were mounted on a PTFE-made cell, inside which an 8 M KOH solution was placed together with a Pt-plate counter electrode. Cathodic polarization curves were measured at 60 °C under O2 or airflow (200 mL/min) by using a potentiostat (HABF-501A, Hokuto Denko, Co., Ltd.) and a Hg/HgO reference electrode.
III. RESULTS AND DISCUSSION
A. Surface chemistry and porous texture characterization
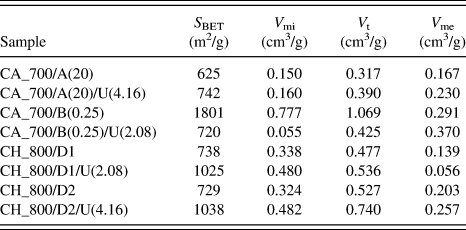
The performed urea treatment of both precursors led to a definite improvement of structural parameters like the specific surface area, the total pore volume as well as the volume of micro- and mesopores (Table I). The increase is particularly spectacular in the case of chitosan-originated carbons and CaCO3 (both types) applied as an activator (hard template). The surface area increased by 41–42% from 729 to 1038 m2/g. The increase of the micropore volume was also spectacular: from 0.324 to 0.482 cm3/g (42–49%). The surface area and the micropore volume for both types of CaCO3 activator and chitosan as a precursor were almost identical. However, the type of CaCO3 influenced much more the volume of mesopores and the total pore volume. The application of the D2 activator improved the V t and V me values (sample CH_800/D2) better than the D1 activator (sample CH_800/D1). Therefore, the D2 activator was advised as a more effective one for further synthesis of chitosan-based N-doped ACs. The D2 activator is a commercial product, i.e., precipitated chalk applied as a pigment in the paint industry.
Surface properties of activated carbons derived from chitin and chitosan by different activation methods.

The positive influence of the urea pretreatment of chitosan on the structural parameters of N-doped ACs was additionally confirmed by means of a less concentrated solution of urea (2.08 M) in the case of sample CH_800/D1/U(2.08), which served as an additional reference. Despite the application of the less effective D1 activator and a less concentrated urea solution, the surface area increased from 738 to 1025 m2/g. In parallel, the pore structure improved, too. The influence of the urea pretreatment in series A on the structural parameters of chitin-originated N-doped ACs was less visible. The surface area increased by 19% only, from 625 to 742 m2/g. The pore structure was upgraded in a similar scale. For the samples obtained in series B, the urea addition significantly reduced porosity, as confirmed by the results of the surface area. For sample CA_700/B(0.25), where S BET is 1801 m2/g after the addition of 2.08 M urea solution for sample CA_700/B(0.25)/U(2.08), a decrease of the specific area down to 720 m2/g can be observed. The total pore volume for the samples obtained from chitin in A and B series is in the range of 0.317–1.069 cm3/g.
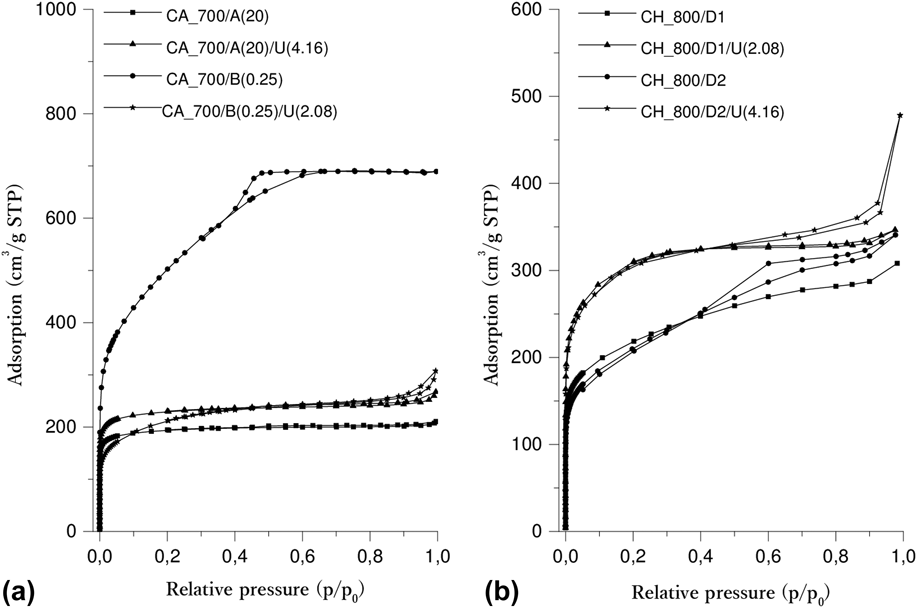
Nitrogen adsorption isotherms recorded at −196 °C were a source of additional information on the pore structure of all the samples under investigation [Figs. 2(a) and 2(b)]. It is seen that the curves show a different shape of isotherms. Generally, type-I and type-IV isotherms according to the IUPAC classifications are observed, which indicates the micro- and mesoporous nature of the synthesized carbons.Reference Thommes, Kaneko, Neimark, Olivier, Rodriguez-Reinoso, Rouquerol and Sing53 These shapes are dependent on the synthesis procedure, especially on the type of activator. Using Na2CO3 or ZnCl2 [Fig. 2(a)] contributes to the production of mainly microporous carbon materials. In turn, the use of CaCO3 [Fig. 2(b)] causes the resulting materials to consist mainly of mesopores with a small amount of micropores.
Low-temperature nitrogen adsorption isotherms for samples carbonized under different activation conditions obtained from (a) chitin and (b) chitosan.

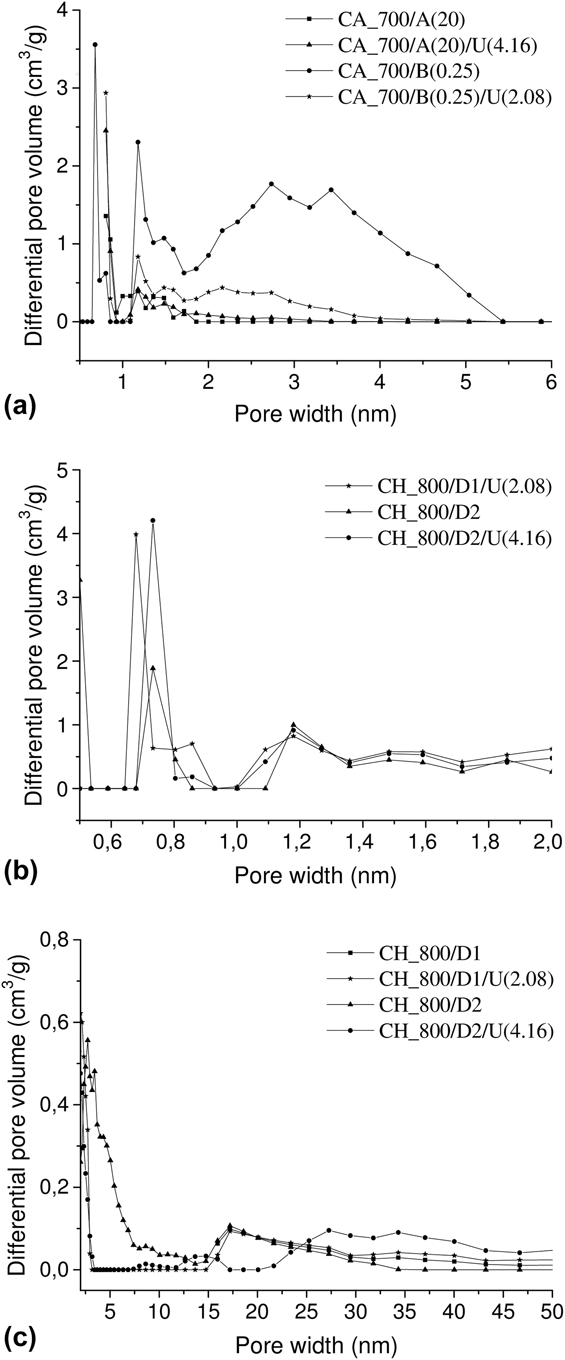
From the pore size distribution (PSD) plots (insets in Fig. 3), it can be seen that nitrogen-doped carbons possess a pore distribution in the range of 0.5–6 nm for the samples obtained from chitin [Fig. 3(a)]. For the samples obtained from chitosan [Fig. 3(b)], micropores are observed with two main peaks of about 0.7 and 1.2 nm. Also, wide peaks are observed in the range from 2 to 50 nm [Fig. 3(c)], which suggest the occurrence of mesopores.
DFT pore volume distribution of materials obtained from (a) chitin, (b) and (c) chitosan.

B. Chemical composition
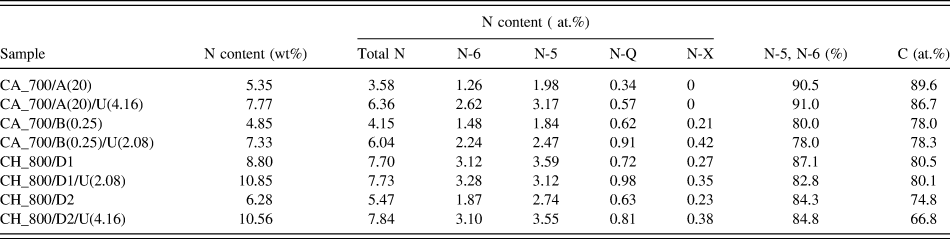
The insertion of nitrogen into the carbon matrix was the primary aim of the research. Thus, the concentration in the investigated N-doped ACs was carefully studied. Two methods were applied, i.e., elemental combustion analysis (N weight content in the bulk and on the surface) and XPS (N atomic content on the surface). XPS analysis allowed us to determine the content of four basic forms of nitrogen surface functionalities: N-6, N-5, N-Q, and N-X (Table II). Also, for representative samples in Fig. S1, C1s, N1s, and O1s XPS spectra are shown. The surface concentration of nitrogen (XPS measurements) was lower than the bulk concentration of nitrogen. It was caused by the surface reactivity of the carbons, particularly a constant oxidation in contact with air.
Analysis of the nitrogen and carbon contents for activated carbons obtained from chitin and chitosan by different activation methods.

The urea pretreatment of chitin and chitosan led to a substantial increase of the nitrogen content. In the case of chitin application as a precursor for series A, the bulk nitrogen content increased by 45% from 5.35 to 7.77 wt%, and for series B, it increased by 51% from 4.85 to 7.33 wt%. In the case of chitosan for series D1, it increased by 23% from 8.80 to 10.85 wt%, and for series D2, it increased by 68% from 6.28 to 10.56 wt%. The sample CH_800/D1/U(2.08) contained 10.85 wt% of nitrogen of which value was very high in comparison to the most known N-doped ACs.
In spite of extensive studies, the explanation of the exact catalytic mechanisms (ORR) on the surface of N-doped carbons is still controversial. Generally, the chemical environment of nitrogen atoms on the surface has a crucial importance for their activity in the ORR process. The analysis of literature announcements led us to define two basic points of view which explain the increased activity of N-doped materials. First explanation assumes that pyridinic-N and pyrrolic-N have a primary importance for the ORR.Reference Zhang, Wen, Ci, Mao, Chen and He12,Reference Sheng, Shao, Chen, Bao, Wang and Xia54,Reference Lai, Potts, Zhan, Wang, Poh, Tang, Gong, Shen, Lin and Ruoff55 The second point of view assumes that quaternary-N groups are more accountable for catalytic activity.Reference Tachibana, Ikeda, Yukawa and Kawaguchi56,Reference Wang, Li, Zhang, Yoon, Weber, Wang, Guo and Dai57 Therefore, the determination of the content of all these nitrogen groups present on the surface of the obtained carbon materials was the main target of the research. For this purpose, XPS method was applied as a well-accepted research tool. Thus, N1s high-resolution spectra were determined to investigate nitrogen surface functional groups in the samples. The XPS studies revealed the presence of four nitrogen-based surface species corresponding to pyridinic N (N-5, 398.3 ± 0.2 eV), pyrrolic N (N-6, 400.0 ± 0.3 eV), quaternary N (N-Q, 402.5 ± 0.2 eV), and oxidized N (N-X, 403–405 eV). The total nitrogen content was high in comparison to the results presented by other researchers and was placed in the range 3.58–7.84 at.%. Quantitative analysis reveals that N-5 nitrogen content was generally higher than the content of N-6, N-Q, and N-X nitrogen atoms. Generally, the following relationship was noticed: N-5 > N-6 > N-Q > N-X. According to some literature announcements, the nitrogen surface functionalities of N-6 and N-5 types are crucial for the process of oxygen reduction in an alkaline solution. All investigated samples were characteristic because of a very high contribution of N-6 and N-5 nitrogen to the total nitrogen. Generally, the summarized contribution of N-6 and N-5 nitrogen exceeded 80% for investigated carbons (Table II). The share increased further upon the urea pretreatment to the level of 82.8–84.8 wt%. Thus, the urea treatment is beneficial regarding the high share of N-6 and N-5 nitrogen. Additionally, the summarized contribution of the key nitrogen functional groups (N-5 and N-6 and N-Q) increased upon increasing of carbonization temperature from 700 to 800 °C.
Oxygen spectra of O1s bonding energy analysis generally result in less precise results. Based on the deconvolution of the O1s spectra in Fig. S1 when analyzing the oxygen connections, it is to be noted that oxygen is bound in the form of carbonyl groups C=O to the binding energy of O1s 531.7 eV (±0.2). Peaks indicating the presence of molecular oxygen (530.2 eV ± 0.3) and in the form of H2O (534–536 eV) are also visible. The presence of O=C–O and C–OH or C–O bonds, which correspond to O1s 533.9 eV (±0.3) and 532.7 eV (±0.2), are also present.
The carbon content in the samples was definitely dependent on the precursor type and the urea pretreatment. Chitosan-originated N-doped ACs contained dramatically less carbon (66.8–80.5 at.%) than the ones obtained from chitin (78–89.6 at.%). The urea pretreatment resulted in a recognizable decrease of carbon content in the case of both precursors. However, an exception was samples CA_700/B(0.25) and CA_700/B(0.25)/U(2.08) where an opposite trend was observed—the value increased from 78 to 78.3%, respectively. XPS studies proved that the increase of the summarized oxygen/nitrogen content was responsible for the decrease of the carbon content.
C. Morphology of the surface
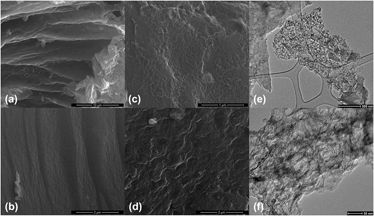
The morphology of the samples under investigation may influence the diffusion resistance of reactants or electrolytes and expose catalytically active sites on the surface. In Figs. 4(a)–4(d), are present images for samples obtained with the same amount of Na2CO3 (20 cm3) and ZnCl2 (mas ratio 0.25) without the addition of urea [Fig. 4(a) and Fig. 4(b)] and with urea [Fig. 4(c) and Fig. 4(d)]. For sample CA_700/A(20), the structure is composed of overlapping sheets. In addition, corrugations at the edges of interconnected layers are visible. The CA_700/A(20)/U(4.16) sample, obtained with urea, has a distinctly different morphology without visible layers and edges. A sample obtained without the addition of urea (A) has a lesser compact structure than that obtained with the addition of urea (B). The SEM images in Figs. 4(b) and 4(d) refer to the samples obtained from chitin using ZnCl2 as an activator. For sample CA_700/B(0.25), the carbon surface is monolithic and there are no edges and recesses. In addition, the morphology of the nitrogen-doped carbon sample obtained with urea [Fig. 4(d)] is significantly different than for the urea-free sample [Fig. 4(b)]. Based on the images, it can be concluded that the addition of urea results in very uneven, foamed surfaces. The results indicate that the addition of urea at a certain concentration plays an important role in changing the morphology of carbon materials obtained from chitin.
Morphology studied by SEM for (a) CA_700/A(20), (b) CA_700/B(0.25), (c) CA_700/A(20)/U(4.16), (d) CA_700/B(0.25)/U(2.08) samples and HRTEM (e) and (f) for the CH_800/D1 sample.

The used calcium carbonate (D1 and D2) affects the structure of the obtained carbons, which have a foam structure with irregularly arranged thin carbon walls [Figs. 4(e) and 4(f)]. These walls reflect the shape formed after etching CaCO3 from the carbon structure.
D. Results of polarization measurements
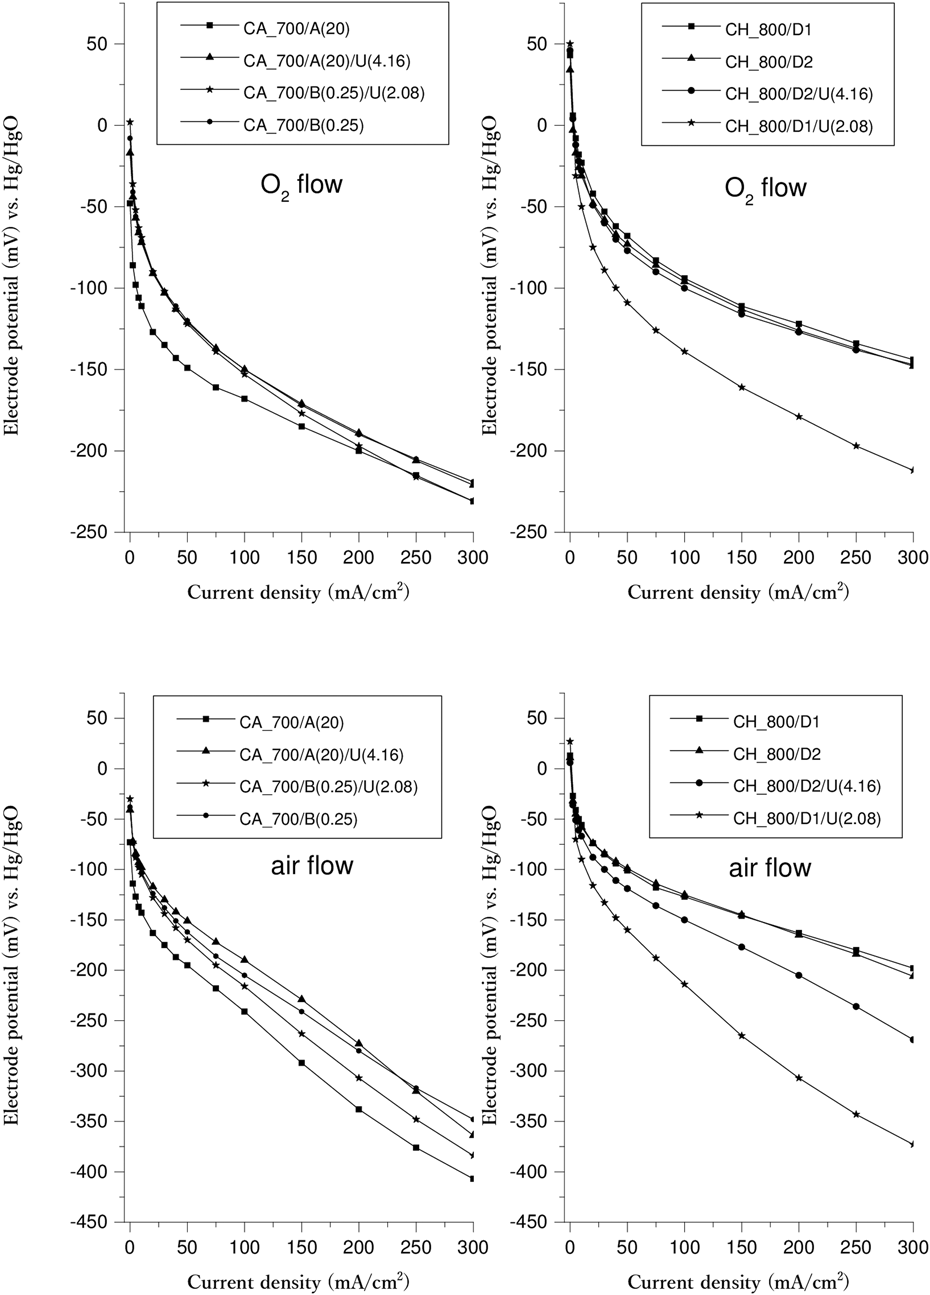
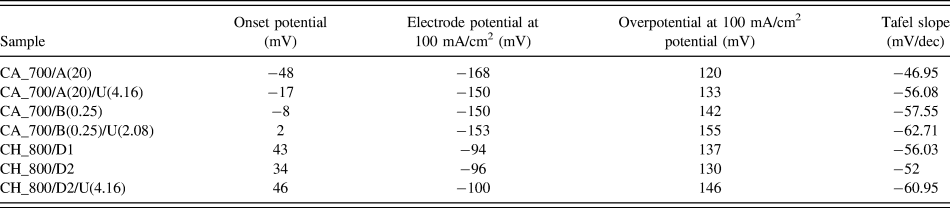
Figure 5 shows oxygen reduction polarization curves of CHs: CH_800/D1, CH_800/D2, CH_800/D2/U(4.16), and CAs: CA_700/A(20), CA_700/A(20)/U(4.16), CA_700/B(0.25), CA_700/B(0.25)/U(2.08) samples. Table III shows the onset potential (current = 0), electrode potential at 100 mA/cm2, over potential at 100 mA/cm2 [(onset potential) minus (electrode potential)] for each of the electrodes, and Tafel slope for each of the electrodes, respectively.
Polarization curves of chitin and chitosan samples under pure O2 and air flow.

Onset potential (current density = 0 mA/cm2), electrode potential at 100 mA/cm2, overpotential at 100 mA/cm2, and Tafel slope.

From Table III, all the samples can be classified into groups as follows:
(i) High onset potential—Low overvoltage: CH_800/D2.
(ii) High onset potential—High overvoltage: CH_800/D1, CH_800/D2/U(4.16).
(iii) Low onset potential—Low overvoltage: CA_700/A(20), CA_700/A(20)/U(4.16).
(iv) Low onset potential—High overvoltage: CA_700/B(0.25), CA_700/B(0.25)/U(2.08).
The samples of Groups 1 and 2 (high onset potential) tend to exhibit a high electrode potential as shown in Table III. This means a high onset potential is important for the electrode potential under cathodic polarization. The onset potential may depend on the number of electrons transferred for the ORR because the 4-electron ORR (ii) has more positive electrode potential than the 2-electron ORR (i). Next, the rotating disk electrode measurement was conducted for CA_700/A(20) (Group 3).
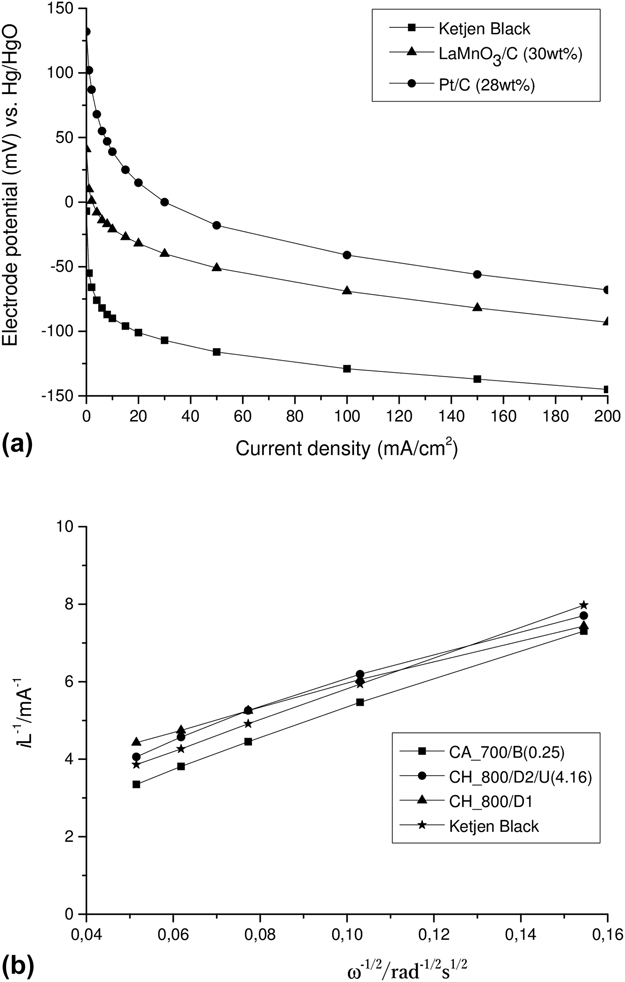
Moreover, for comparison, as shown in Fig. 6(a), an oxygen reduction catalyst using perovskite-type oxides was developed. If the oxygen reduction activity of the carbon-support is improved, the oxygen reduction activity of carbon-supported LaMnO3 will be improved. Therefore, the highly active carbon materials obtained from chitin and chitosan were used in further research.
(a) Polarization curves of the carbon-supported LaMnO3 (by a reverse micelle method, LaMnO3:30 wt%), the carbon-supported Pt [by a reduction of Pt(NH3)2(NO2)2, Pt:28 wt%] and Ketjen Black EC600JD; (b) Koutecky–Levich plots corresponding to the hydrodynamic voltammograms of samples CA_700/B(0.25), CH_800/D2/U(4.16), and CH_800/D1 and Ketjen Black at −0.4 V versus Hg/HgO.

E. Results of RRDE measurements
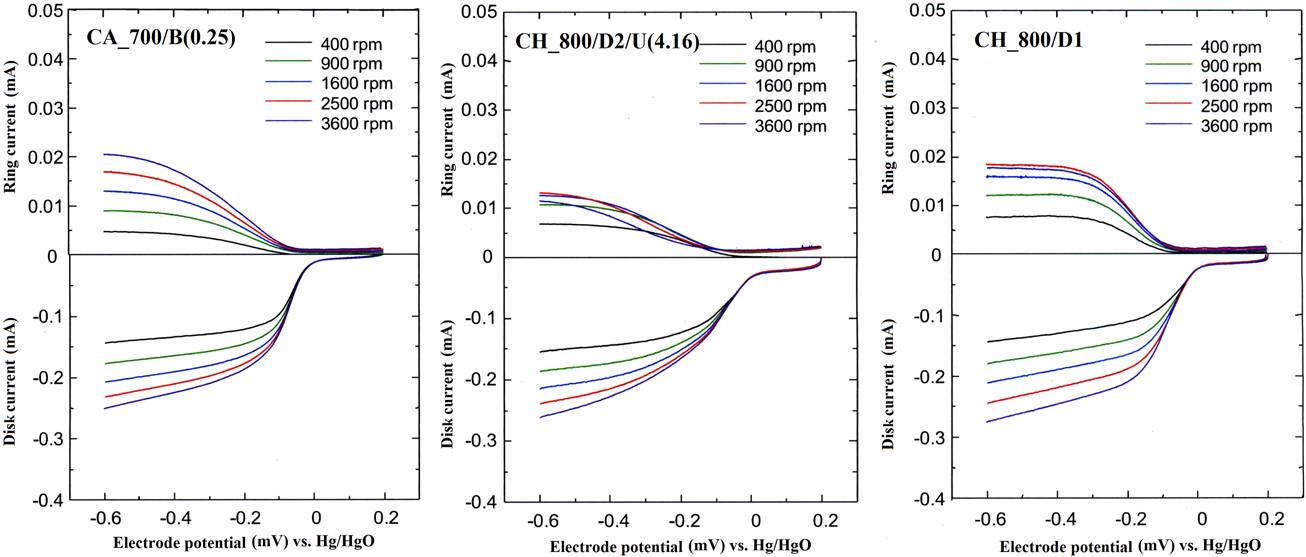
Figure 7 shows hydrodynamic voltammograms for CA_700/B(0.25), CH_800/D2/U(4.16), and CH_800/D1. The disk current for all the samples increased with an increase in the rotation speed of the disk electrode, indicating that all the samples have the oxygen reduction activity. In all samples, the ring current was increased with an increase in the rotation speed of the disk electrode, indicating that HO2- was produced on carbons according to Eq. (2). The order of the onset potential was in the order of CH_800/D2/U(4.16) > CH_800/D1 > CA_700/B(0.25). This tendency is in good agreement with the onset potential of the air electrode.
RRDE result of CA_700/B(0.25), CH_800/D2/U(4.16), and CH_800/D1 samples.

Figure 6(b) shows the Koutecky–Levich plots of each of the samples obtained from the hydrodynamic voltammograms at −0.4 V versus Hg/HgO. Furthermore, the number of electrons transferred in the ORR was tested for N-doped carbons and reference materials. The results for commercial materials such as Ketjen Black EC600JD, LaMnO3/C, and Pt/C are 2.12, 3.47, and 3.71, respectively. For the new carbon samples under investigation CA_700/B(0.25), CH_800/D1, CH_800/D1/U(2.08), and CH_800/D2/U(4.16), the number of transferred electrons amounts to 2.17, 2.82, 3.76, and 2.37, respectively. The value of n for CA_700/B(0.25) and CH_800/D2/U(4.16) is almost 2, indicating that the 2-electron ORR is dominant for CA_700/B(0.25) and CH_800/D2/U(4.16). The value of i k changed in the order of 0.648 > 0.411 > 0.338 for CA_700/B(0.25) > CH_800/D2/U(4.16) > CH_800/D1. Figure S2 presents LSV curves recorded using rotating disk electrode for CA_700/B(0.25), CH_800/D1, CH_800/D2/U(4.16), and Ketjen Black samples. The Tafel slopes for these samples were calculated to be −57.47 mV/dec, −82.43 mV/dec, −116.7 mV/dec, and −88.13 mV/dec, respectively, as can be seen in Fig. S3. Since the lower Tafel slope means that the electrode potential increases slowly with the increasing current density, the sample with lower Tafel slope exhibits the higher oxygen reduction activity. Therefore, carbon samples obtained from chitin tends to have a higher oxygen reduction activity than those obtained from chitosan. Comparing all the samples [indicating CH_800/D1/U(2.08)], CH_800/D1/U(2.08) has the highest number of electrons transferred (n), and CA_700/B(0.25) has the highest i k.
The disk current of each of the samples increased with an increase in the rotational speed of the disk electrode, indicating that each sample has an oxygen reduction activity. The onset potential of CH_800/D1/U(2.08) was nobler than that of the other sample, indicating that the number of electrons transferred for CH_800/D1/U(2.08) seems to be different from the other sample. The number of electrons transferred for Ketjen Black was 2.12 (for i k equal 0.623 mA). This means that the 2-electron ORR is dominant for Ketjen Black. In contrary, in the case of CH_800/D1/U(2.08), the number of electrons transferred was 3.76 (for i k equal 0.208 mA), indicating that the 4-electron ORR is dominant for CH_800/D1/U(2.08). As shown in reaction formulae (1) and (2), the electrode potential of the 4-electron ORR is much higher than that of the 2-electron ORR. Therefore, the air electrode using the CH_800/D1/U(2.08) sample exhibited high electrode potentials as shown in the polarization curves (Fig. 5).
When the Tafel slopes are compared between CH_800/D1/U(2.08) and Ketjen Black, the Tafel slope for CH_800/D1/U(2.08) is larger than that for Ketjen Black. This tendency means that the charge-transfer rate and the catalytic activity of CH_800/D1/U(2.08) is less active than that of Ketjen Black. If the catalytic activity of CH_800/D1/U(2.08) samples is improved, an excellent air electrode will be obtained because CH_800/D1/U(2.08) has the property of a 4-electron ORR with high electrode potential.
IV. CONCLUSIONS
In summary, for the first time, doped carbon materials prepared by the hard template method from chitin and chitosan (with or without urea) were investigated as the ORR catalyst. The results revealed that both the type of activator (Na2CO3 and CaCO3 as hard templates) and the optional treatment of urea yielded a significant effect on the specific surface area, nitrogen doping and, thus, the electrocatalytic activity, as well. First, it was found that such a change could be correlated with the electrocatalytic activity to the ORR, revealing the importance of the specific surface area and the chemical nature of the nitrogen surface functionalities. Second, the urea treatment can further increase the specific surface area and enhance the nitrogen doping, which thereby improved the electrocatalytic activity and selectivity to the ORR. Most of the obtained N-doped carbon materials (series A, B, D1, and D2) exhibit a higher catalytic performance compared to their platinum-based counterparts, indicating a great beneficial effect of N-doping on the ORR performance. This research on new nitrogen–carbon electrodes compared to a commercial platinum electrode opens up avenues for the development of novel, efficient, metal-free catalysts for the ORR.
Supplementary Material
To view supplementary material for this article, please visit https://doi.org/10.1557/jmr.2018.116.
ACKNOWLEDGMENT
This work was carried out as a result of the research Project No. 2014/15/N/ST8/03399 financed by the National Science Center (Poland).