INTRODUCTION
Drivers and sizes of soil organic carbon (SOC) stocks in agricultural soils have received increased attention over the past decade because of their contribution to the overall global carbon (C) budget (Jones et al. Reference Jones, Hiederer, Rusco and Montanarella2005). Grassland soils, in particular, have the capacity to sequester or to release substantial amounts of C (Freibauer et al. Reference Freibauer, Rounsevell, Smith and Verhagen2004; Soussana et al. Reference Soussana, Loiseau, Vuichard, Ceschia, Balesdent, Chevallier and Arrouays2004; Kätterer et al. Reference Kätterer, Andersson, Andren and Persson2008). In order to calculate actual volumetric SOC stocks from gravimetrically determined SOC contents, it is critical to know the bulk density of the soil (Batjes Reference Batjes1996; Lettens et al. Reference Lettens, Van Orshoven, Van Wesemael, De Vos and Muys2005; Frogbrook et al. Reference Frogbrook, Bell, Bradley, Evans, Lark, Reynolds, Smith and Towers2009). Because gravimetric SOC contents are often negatively correlated with soil bulk density (De Vos et al. Reference De Vos, Van Meirvenne, Quataert, Deckers and Muys2005), changes in SOC contents cannot be directly translated into changes in SOC stocks in grassland soils.
SOC contents in grassland topsoils are related to land use history (Hoogerkamp Reference Hoogerkamp1984; Sonneveld et al. Reference Sonneveld, Bouma and Veldkamp2002; Schulp & Veldkamp Reference Schulp and Veldkamp2008), soil and landscape properties (Landi et al. Reference Landi, Mermut and Anderson2004) and grassland management. Higher SOC levels are, for example, found in grazed pastures compared with pastures receiving only mowing regimes (Hassink & Neeteson Reference Hassink and Neeteson1991; Hassink Reference Hassink1994; Mestdagh et al. Reference Mestdagh, Lootens, Van Cleemput and Carlier2006). Additionally, soil bulk density in grassland topsoils can also be directly related to grassland management such as stocking rates and use of machinery (Wopereis Reference Wopereis1994; Hansen Reference Hansen1996; Hamza & Anderson Reference Hamza and Anderson2005). Thus, the quantification of changes in SOC stocks in grasslands needs to take into account both SOC content as well as bulk density.
Routine soil analyses from farmers' fields provide an opportunity to monitor SOC development in agricultural topsoils (Reijneveld et al. Reference Reijneveld, Van Wensum and Oenema2009), but soil bulk density is mostly not determined in these analyses (Batjes Reference Batjes1996). In order to calculate SOC stocks from SOC contents, use has been made of representative data (Frogbrook et al. Reference Frogbrook, Bell, Bradley, Evans, Lark, Reynolds, Smith and Towers2009) or of continuous pedotransfer functions (Rawls Reference Rawls1983; Batjes Reference Batjes1996; Springob et al. Reference Springob, Brinkmann, Engel, Kirchman and Bottcher2001). Existing functions, however, need to be validated for specific studies, since pedotransfer functions for estimating soil bulk density may result in serious underestimations (De Vos et al. Reference De Vos, Van Meirvenne, Quataert, Deckers and Muys2005). For the Netherlands, the continuous pedotransfer functions developed are restricted to mineral soils and need additional data such as the median sand particle size, which are also not determined in routine analyses (Wösten Reference Wösten, Gregorich and Carter1997). More flexible pedotransfer functions are therefore not only needed to quantify SOC but also nitrogen (N) stocks in grassland soils based on data from routine soil analyses at farmers' fields.
The aim of the present paper was to quantify SOC and N stocks in grassland soils for a Northern Dutch region dominated by dairy farming. As the current international standard depth for SOC analyses for grasslands is 0·1 m, which is also adopted by Dutch standard laboratories (Hanegraaf et al. Reference Hanegraaf, Hoffland, Kuikman and Brussaard2009), the analysis is limited to the upper 0·1–0·2 m of the soil. The second aim was to analyse the relationships between soil organic matter (SOM) and bulk density at the field level for this area. The combined measurements on soil bulk density and SOM are also evaluated with respect to soil compaction as this affects the quantification of SOC and N stocks in soils.
MATERIALS AND METHODS
Study area
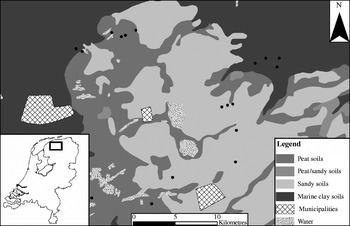
The study area is located in the north of the Netherlands in the province of Friesland and covers a total area of 60 000 ha (Sonneveld et al. Reference Sonneveld, De Vos, De Vries, Knotters, Kros, Roelsma, Bleeker, Hensen and Frumau2009). The dominant land use is grassland for dairy farming (41 500 ha). Field sizes are generally small, averaging c. 1–2 ha. Sandy soils developed in late-glacial cover sands (FAO: Gleyic Podzols) are dominant and most have an anthropogenic topsoil of 0·3–0·5 m as a result of peat reclamations and historic plaggen applications (plaggen soils have been created by cutting turves of peat from an outfield area, using them as bedding for cattle and then spreading the slurry-soaked bedding on the arable fields as fertilizer) (Sonneveld et al. Reference Sonneveld, Bouma and Veldkamp2002). Soils developed in peat deposits (FAO: Terric Histosols) and marine clay sediments (FAO: Calcaric Fluvisols) are also found, but mainly in the western and northern parts of the study area (Fig. 1). Data on soils and groundwater tables were available in GIS format (1:50 000 scale; Stiboka 1981). No significant spatial trends in climate are expected for this region of the Netherlands.
Study area in the North of the Netherlands, distribution of major soil types and location of the dairy farms in this study (indicated with dots).

Selected farms
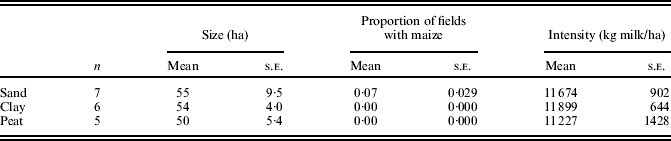
In 2007, about 60 dairy farms were monitored with respect to their nutrient management. These participated in a large research project where relationships between farm management and environmental quality were investigated. Using the 1:50 000 scale soil map (Stiboka 1981), 18 dairy farms were randomly selected from this larger group, of which six were located on sandy soils, six on clay soils and six on peat soils (Fig. 1). For all soil types, half of the group of farms applied animal slurry through above-ground spreading, whereas the other farms used conventional techniques to apply slurry to the grassland, such as shallow injection. It was later found that for one farm mapped as a farm on peat soil, samples had actually been taken from a sandy soil. This is most likely caused by the fact that this farm is located on the transition from sandy soils to peat soils and peat may have disappeared through mineralization after the 1:50 000 soil map was constructed in 1981 (Kempen et al. Reference Kempen, Brus, Heuvelink and Stoorvogel2009). Therefore, this farm was reclassified as a farm on sandy soil and was treated as such in the statistical analyses. Besides differences in manure application techniques, farms also varied in size, milk production and animal density. Characteristics for the farms are given in Table 1.
Mean values and standard errors (s.e.m.) for farm characteristics stratified by the soil type
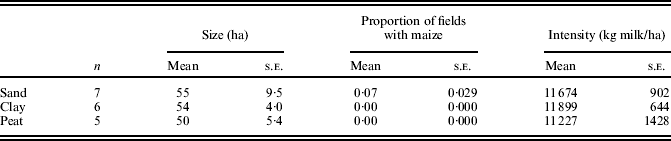
On average, dairy farms on sandy soils are largest in size and animal density, but considerable variation was found. Cultivation of silage maize was only found for farms on sandy soils and was not found for farms on clay soils or peat soils. Mean sizes for all farm groups were higher compared with the average size (44 ha) of a dairy farm in the Netherlands in 2007 (LEI 2008). For the whole country, the proportion of maize on dairy farms is higher (0·15) than that observed in the study area (0·07).
Soil sampling
For each farm, topographical maps were available in GIS which indicated the location of the individual fields. The fields were numbered and three grassland fields were randomly selected at each farm for field sampling. Sampling was carried out in spring 2007 and followed a systematic w-shaped diagonal transect. For each field, bulk samples were taken for SOM and total N from 25 selected points along this transect. Bulk samples were taken from the 0–0·1 m and 0·1–0·2 m layers. The SOM contents and total N were determined using near infrared spectrometry; SOC contents were calculated from this assuming a C content in soil organic matter of 0·58 (Hanegraaf et al. Reference Hanegraaf, Hoffland, Kuikman and Brussaard2009). The clay content (fraction <2 μm) was determined using the pipette method. Clay contents are generally very low for the sandy soils (c. 4% by volume) and were only determined for marine clay soils. Through standardized queries, grassland management on the fields in the preceding year was recorded, distinguishing between only mowing, only grazing or a combination of the two. Fields were also classified as ‘grazing’ if only the latest cut was mown. Within each field, core samples (0·1 litre) were taken from two depths (0·05–0·10 m and 0·15–0·20 m) at three locations on the sampling transect. In total, 18 core samples were collected for each farm, resulting in a total of 324 samples. Samples were weighed and dried at 105°C. For each field and depth, the average bulk density was calculated from the individual samples.
Analyses
The relationships between SOM and bulk density were analysed in two ways: first by using non-linear regression and secondly by analysing the relationship with soil density (S d) and packing density (P d). Soil density is defined following Rawls (Reference Rawls1983) and Van den Akker (Reference Van Den Akker, Horn, Fleige, Peth and Peng2006):

where S d,j is the soil density (kg/m3) for layer j when saturated, and SOMj is the gravimetric SOM content for layer j. The constants d s and d m refer to the material density of SOM (1470 kg/m3) and the density of the mineral fraction (2660 kg/m3), respectively (Van den Akker Reference Van Den Akker, Horn, Fleige, Peth and Peng2006).
Using eqn (1), the total pore (TP) volume can also be calculated as

where TPj=total pore volume for layer j and B d,j=bulk density for layer j (kg/m3). For sandy and loamy soils (clay content <17·5%), Van den Akker (Reference Van Den Akker, Horn, Fleige, Peth and Peng2006) indicates that limitations for root growth occur if TP drops below a critical threshold value of 0·40. From rewriting eqn (2), it follows that the ratio of B d and S d should be smaller than 0·60 if compaction is absent. For clay soils in the Netherlands (clay content >17·5% by volume), a critical TP value of 0·40 cannot be used as a criterion for rooting (Van den Akker Reference Van Den Akker, Horn, Fleige, Peth and Peng2006). To also allow an evaluation of compaction within clay soils, packing densities were calculated. Following (Jones et al. Reference Jones, Spoor and Thomasson2003), P d can be calculated as

where P d,j is the packing density for layer j (kg/m3) and C j is the clay content for layer j. As a threshold, a critical limit of PD of 1750 kg/m3 is adopted here (Van den Akker Reference Van Den Akker, Horn, Fleige, Peth and Peng2006).
Estimated stocks of SOC in the top 0·2 m at field and the farm level were calculated according to eqns (4) and (5), respectively:
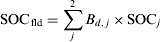
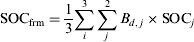
where SOCfld is the estimated total SOC content in the upper 0·2 m of grassland soils at the field level and SOCfrm is the estimated total SOC content in the upper 0·2 m of grassland soils at the farm level based on individual samples per field i. Similar to eqns (4) and (5), total N stocks at field and farm levels were also calculated. All statistical analyses were performed in SPSS. Significant differences between groups were tested using a T-test.
RESULTS
SOM and bulk density
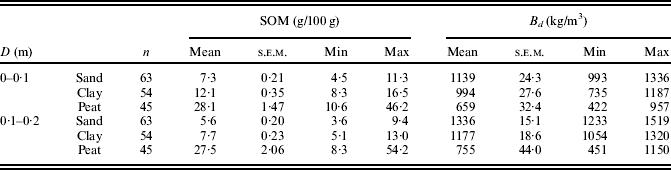
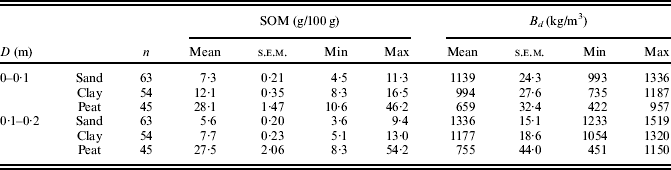
Results for gravimetrically determined SOM contents and dry bulk density for both the 0–0·1 m layer and the 0–0·2 m are given in Table 2. As expected, average SOM values of peat soils were highest and SOM values of sandy soils were lowest for both the 0–0·1 m layer as well as the 0–0·2 m layer. The range in SOM contents was considerable for all soils but especially for the peat soils. Using the SOM data, the proportion of SOM content at 0·1–0·2 m depth with respect to the 0–0·1 m depth was also calculated. These relative proportions were 0·94, 0·78 and 0·66 for peat, sandy and clay soils, respectively. This indicates that the relative distribution of soil organic matter within the soil profile is different for the different soil types. The largest difference found between 0–0·1 m and 0·1–0·2 m for the clay soils may be due to less biological homogenization as a result of shallow groundwater tables and swelling and shrinking of the soil. In general, average bulk densities from sandy soils are highest and average bulk densities from peat soils are lowest. It can also be observed that bulk densities for the 0·1–0·2 m layer were always higher compared with the 0–0·1 m layer. For the sandy soils and clay soils, standard errors (s.e.m.) were, on an average, also lower for the 0·1–0·2 m layer compared to s.e.m. values from the top 0–0·1 m. As with the SOM contents, the range in B d values for the peat soils were largest.
Gravimetric SOM contents and bulk density among the different soil types for the 0–0·1 m layer and the 0·1–0·2 m layer at the field level
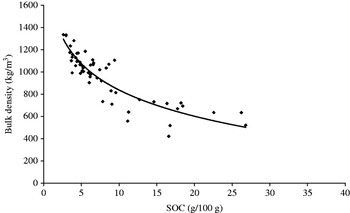
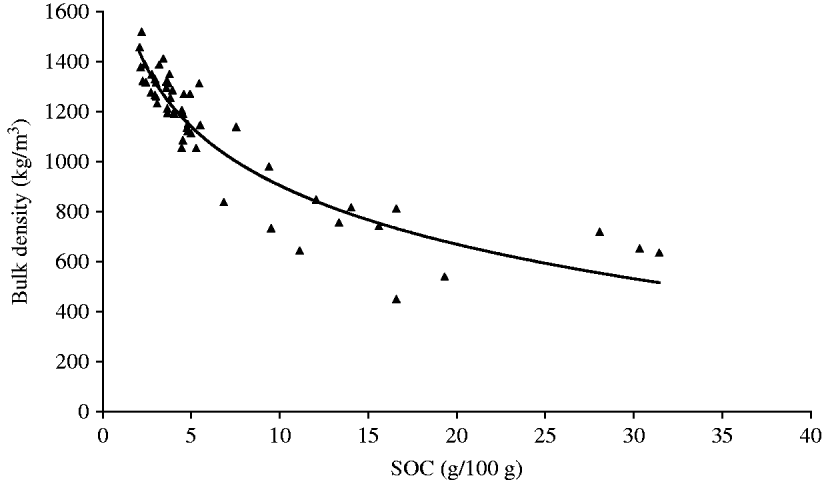
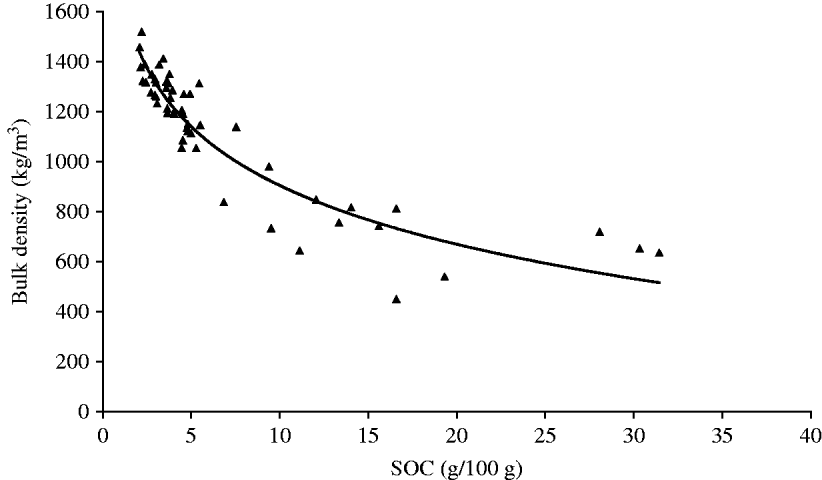
For the marine clay soils, the fine earth fraction (<2 um) proved to be uncorrelated with SOM for both the 0–0·1 m layer as well as the 0·1–0·2 m layer. As indicated, SOC contents are calculated from SOM contents assuming a C content of 0·58. In Figs 2 and 3, the data on bulk density, averaged per field, are plotted against SOC observations at field level for sand, clay and peat soils. From regression analysis, significant non-linear relationships were found between bulk density and SOC for both the 0–0·1 m layer (R 2=0·80, P <0·001) and the 0·1–0·2 m layer (R 2=0·86, P<0·001). This relationship could be described by

where a=1622 with a 95% confidence interval [1524; 1719] and b=340 with a 95% confidence interval [292; 388] for the top 0–0·1 m layer, and a=1687 with a 95% confidence interval [1617; 1757] and b=339 with a 95% confidence interval [301; 378] for the 0·1–0·2 m layer.
Bulk density in relation to SOCfld content for 0–0·1 m depth for sand, peat and clay soils.

Bulk density in relation to SOCfld content for 0·1–0·2 m depth for sandy, peat and clay soils.
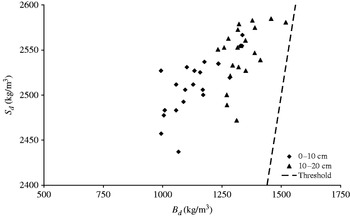
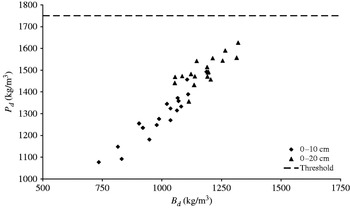
The relationship between bulk density (B d) and soil density (S d) for sandy soils at depths of 0–0·1 m and 0·1–0·2 m is given in Fig. 4. As can be seen in Fig. 4, none of the fields on sandy soils show B d/S d ratios higher than 0·6. Thus, limitations for root growth as a result of compaction are not expected in these fields. However, some grassland fields on sandy soil do approach this critical threshold for the 0·1–0·2 m layer and are close to being defined as compacted. For fields on sandy soils, the mean pore volume (TP) was 0·55 for the 0–0·1 m layer and 0·47 for the 0·1–0·2 m layer. For both layers, there were no significant differences in B d/S d ratios between farms that applied manure through above-ground spreading and farms that used low-emission techniques. The relationships between B d and P d for clay soils for both layers are given in Fig. 5. Also for the clay soils, there are no signs of compaction as the critical P d threshold of 1750 kg/m3 is not exceeded. Again, some fields approach this threshold value at greater depth, but limitations for rooting are not to be expected. Thus, estimations of SOC stocks and N stocks in the 0–0·1 m layer and 0·1–0·2 m layer of grasslands are not affected by strong levels of soil compaction in the study area.
Relationship between S d and B d for 0–0·1 m depth and 0·1–0·2 m depth for individual grassland fields for sandy soils (clay % by volume <8). The threshold of 0·6 is indicated by the dashed line.

Relationship between P d and B d for 0–0·1 m depth and 0·1–0·2 m depth for individual grassland fields for clay soils (clay % by volume >17·5). The threshold is indicated by the dashed line.

SOC and total N stocks at field and farm level
Most fields on sandy soils (0·81 of all sandy fields) were used for a combination of mowing and grazing. SOCfld stocks were higher (P=0·058) for fields that received only a grazing regime (SOCfld=10·3 kg/m2) compared with fields that received a combination of grazing and mowing (SOCfld=8·7 kg/m2). Also total N stocks were higher (P=0·068) for fields with pure grazing regimes (Nfld=0·39 kg/m2) compared with fields that received a combination of grazing and mowing (Nfld=0·31 kg/m2). For clay and peat soils, no differences between management regimes were observed. For the sandy soils, the effect of hydrological regime proved to be even more significant compared with field management (Table 3). Stocks of SOCfld under fields with very shallow groundwater tables (‘wet soils’, Dutch groundwater class III) were significantly higher (11·4 kg/m2, P=0·003) compared with soils that are better drained (‘dry soils’, Dutch groundwater class VI) which had a mean SOCfld stock in the upper 0·2 m of 8·6 kg/m2. The mean difference between total Nfld stocks were also higher for these wet soils (Nfld=0·71 kg/m2, P=0·081) compared with drier soils (Nfld= 0·57 kg/m2).
SOCfld stocks and total Nfld stocks in the upper 0·2 m of grasslands on sandy soils with different hydrological regimes at the field level. Groundwater classes, following the Dutch classification scheme, are given between brackets. Standard error of differences (s.e.d.) and P values are indicated

As with gravimetric SOM contents, estimated SOCfrm stocks in the top 0·2 m were highest for the peat soils and lowest for the sandy soils (Table 4). The maximum SOCfrm stock for the upper 0·2 m of grasslands for farms on sandy soil was similar to the lowest level found for farms on clay soils. Estimated N stocks in the upper 0·2 m in grassland for farms on peat soils were more than twice as high compared with estimated N stocks in the upper 0·2 m in grassland for farms on sandy soils.
SOC stocks and N stocks at farm level in the top 0·2 m for the different soil types

Comparing the SOC stocks and N stocks between farms in relation to manure application technique did not yield significant differences. Although farms on sandy soils using above-ground spreading of manure had both a higher SOCfrm stock (1·28 kg/m2) as well as a higher Nfrm stock (726 kg N/ha) these were not significantly different from farms which used low-emission techniques to apply manure (P=0·20 and P=0·34 for SOCfrm and Nfrm, respectively).
DISCUSSION
For the area studied, significant non-linear relationships between SOC content and B d were found, which may be used as pedotransfer functions to calculate SOC stocks from SOM data that originate from routine soil analyses. The established relationships closely match the relationship found by Springob et al. (Reference Springob, Brinkmann, Engel, Kirchman and Bottcher2001) for Ap horizons (i.e. soil surfaces disturbed by human activity through, e.g. ploughing) in North Pleistocene sands in Germany. Such pedotransfer functions are appealing because of the low volume of data needed for translating SOC contents into SOC stocks. It has not been validated to what extent these functions also hold for other parts of the country. In the present work, the established pedotransfer functions were developed for the topsoil of grassland, but these may perform differently with respect to the subsoil (De Vos et al. Reference De Vos, Van Meirvenne, Quataert, Deckers and Muys2005).
Grasslands on sandy soils in the northern part of the Netherlands generally have higher SOM contents compared with the southern parts. Relatively high SOM contents were found in the present study for sandy topsoils, in agreement with earlier findings (Sonneveld et al. Reference Sonneveld, Bouma and Veldkamp2002; Sonneveld Reference Sonneveld2008). Hanegraaf et al. (Reference Hanegraaf, Hoffland, Kuikman and Brussaard2009) reported a mean SOM content of 9·4 g/100 g for the top 0·05 m of grassland on sandy soils in a Northern province in 2003 and 5 g/100 g for the top 0·05 m for grassland on sandy soils in the southern province of Brabant.
Increases in SOC stocks can potentially be observed as a sole result of increases in bulk density. As this is the result of using fixed sampling depths (Gifford & Roderick Reference Gifford and Roderick2003), it may be better to express SOC contents on a constant soil dry mass per unit of area. This would additionally require assessments of SOC deeper in the soil profile (Lettens et al. Reference Lettens, Van Orshoven, Van Wesemael, De Vos and Muys2005). However, the present work was associated with routine soil analyses and these generally use a fixed depth for sampling. Calculations of elevated SOC stocks can, for example, be the result of soil compaction. Significant differences in bulk density for the top 0·2 m in grasslands as a result of soil management have been reported in several studies (Wopereis Reference Wopereis1994; Hansen Reference Hansen1996; Mestdagh et al. Reference Mestdagh, Lootens, Van Cleemput and Carlier2006). In grasslands, the application of manure is a likely potential contributor for soil compaction, because this often takes place early in the growing season under relatively wet conditions. High levels of soil compaction in grassland topsoils may even result in a reduction of dry matter yield (Douglas et al. Reference Douglas, Campbell and Crawford1992; Douglas & Crawford Reference Douglas and Crawford1998). In the present study, samples for the topsoil of grassland on sandy soils (0–0·2 m) did not indicate compaction as B d/S d ratios were always below 0·6. Also, samples for the topsoil of grassland on clay soils (0–0·2 m) did not indicate compaction, since P d values were always below 1750 kg/m3. Although grassland management may affect the observed density of the soils, this was not to the extent that critical thresholds were exceeded. In reality, the limitation for rooting is not dependent on a fixed value. On sandy soils, other crops such as maize or bulbous plants have limitations at B d/S d ratios smaller than 0·6 (Van den Akker Reference Van Den Akker, Horn, Fleige, Peth and Peng2006).
For the sandy soils, soil hydrology was significant in explaining part of the variation in SOC stocks observed at field level, similar to what has been observed elsewhere (Schulp & Veldkamp Reference Schulp and Veldkamp2008). Shallow groundwater levels in wet soils contribute to lower decomposition rates compared with drier sandy soils (Springob et al. Reference Springob, Brinkmann, Engel, Kirchman and Bottcher2001). Because groundwater levels have artificially been lowered in most parts of the landscape, high SOM contents in cultivated grasslands on relatively wet soils may also reflect locations which were previously covered with peat.
It was also found that most types of grassland management consisted of a combination of grazing and mowing. Still, the present data suggest that only grazing regimes result in higher SOC stocks for sandy soils compared with a combination of grazing and mowing. This supports earlier findings by Mestdagh et al. (Reference Mestdagh, Lootens, Van Cleemput and Carlier2006) and Hassink & Neeteson (Reference Hassink and Neeteson1991) and it has been suggested that pure grazing regimes give higher inputs of ungrazed grass returns and faeces to the field resulting in higher SOC stocks in fields that are used for grazing.
The conclusion of the current work is that significant non-linear relationships exist between gravimetric SOC contents and bulk density (B d) for the 0–0·1 m layer (R 2=0·80, P<0·001) and the 0·1–0·2 m layer (R 2=0·86, P<0·001). These relationships can be used as pedotransfer functions to calculate SOC and N stocks in the upper 0·2 m of grasslands using data available from routine soil analyses. Estimations of SOC and total N stocks for the top 0–0·2 m were not affected by strong levels of soil compaction although some fields on sandy soils and clay soils were found to approach a critical limit for the 0·1–0·2 m layer. Mean SOC stocks in the top 0·2 m at farm level were highest in the peat soils (21·7 kg/m2) and lowest in the sandy soils (9·0 kg/m2). Similarly, N stocks were highest for farms on peat soil (1·30 kg/m2) and lowest for farms on sandy soil (0·60 kg/m2). For the sandy soils, the mean SOC stock was significantly higher in fields with shallow groundwater tables.
Thanks go to Frans Bakker for his contribution in data collection in the field.