I. INTRODUCTION
Transparent, flexible, low-cost, and large area printed electronics are highly anticipated for enabling the development of various applications, such as flexible electronic displays and low cost sensors. Reference Klauk1–Reference Malliaras and Friend5 Thin film transistors (TFTs) are the basic building blocks of electronics, and in recent years it has been shown that high performance TFTs can be fabricated from small molecule organic semiconductors (OSCs). Reference Chua, Zaumseil, Chang, Ou, Ho, Sirringhaus and Friend6–Reference Izawa, Miyazaki and Takimiya14 Solution-based methods of deposition for small molecule OSC thin films are desired for the high-throughput fabrication of low-cost, large-area devices. Currently, there exist many such high-throughput, solution deposition methods, such as solution shearing, doctor blading, inkjet printing, roll coating, knife blading, zone casting, etc., all of which are used to create uniform, thin films of OSCs. Reference Minemawari, Yamada, Matsui, Tsutsumi, Haas, Chiba, Kumai and Hasegawa13,Reference Park, Lee and Lee15–Reference Giri, Verploegen, Mannsfeld, Atahan-Evrenk, Lee, Becerril, Aspuru-Guzik, Toney and Bao25 The solution shearing method forms large, oriented crystalline OSC domains, which exhibit fewer unfavorable grain boundaries and improved charge transport. This method also allows the possibility of trapping nonequilibrium molecular packing of small molecule OSCs, which in some cases may improve electronic overlap between molecules. In the case of the model OSC 6,13(bis-triisopropylsilylethynyl) pentacene (TIPS-pentacene), a packing motif with greater electronic overlap than that of the equilibrium molecular packing was demonstrated. Reference Giri, Verploegen, Mannsfeld, Atahan-Evrenk, Lee, Becerril, Aspuru-Guzik, Toney and Bao25 Consequently, the charge transport properties of TIPS-pentacene were increased, resulting in TFTs with charge carrier mobilities above 10 cm2 V−1 s−1. Reference Diao, Tee, Giri, Xu, Kim, Becerril, Stoltenberg, Lee, Xue, Mannsfeld and Bao26
In addition to the improvement of charge carrier mobilities in OSC thin films, a further area of focus is the reduction of parasitic leakage currents and crosstalk between neighboring TFTs, via the selective deposition of OSC thin films. Reference Dickey, Subramanian, Anthony, Han, Chen and Loo27–Reference Ling and Bao29 Leakage currents result in higher power requirements for transistor operation, and cross-talk results in nonspecific switching in neighboring device elements. Patterned OSC deposition promises to reduce the incidence of both phenomena, enabling the fabrication of high-performance, large-area organic electronics.
Numerous patterning methods have been developed for the controlled deposition of OSCs. Single crystal OSC patterning from both vapor and solution phase has been shown, using methods such as templated chemical vapor deposition, subtractive patterning, and inkjet printing. Reference Minemawari, Yamada, Matsui, Tsutsumi, Haas, Chiba, Kumai and Hasegawa13,Reference Briseno, Mannsfeld, Ling, Liu, Tseng, Reese, Roberts, Yang, Wudl and Bao30–Reference DeFranco, Schmidt, Lipson and Malliaras34 Confined thin film growth using polydimethylsiloxane (PDMS) stamping and direct capillary writing can also be used to pattern OSC thin films. Reference Nakayama, Hirose, Soeda, Yoshizumi, Uemura, Uno, Li, Kang, Yamagishi, Okada, Miyazaki, Nakazawa, Nakao, Takimiya and Takeya35–Reference Jo, Vailionis, Park and Salleo38 Furthermore, post-deposition solvent annealing can be used to change the electrical properties of OSC thin films in a selective fashion. Loo et al. have demonstrated a method for patterning the organic semiconductor TES-ADT following spin coating deposition from a melt solution. This method indiscriminately deposits a disordered thin film across the entire substrate surface, after which the high-mobility active channel is defined via post-deposition solvent annealing and selective UV irradiation. In nonirradiated regions, the TES-ADT thin film crystallizes into a spherulitic morphology in the presence of solvent vapors, whereas in irradiated regions, the film dewets from the substrate and migrates into neighboring, patterned features. Reference Dickey, Subramanian, Anthony, Han, Chen and Loo27,Reference Dickey, Anthony and Loo39
Other patterning methods have explored the general use of selective solution wetting of the substrate by use of lyophobic and lyophilic surface modification treatment. Reference Diao, Tee, Giri, Xu, Kim, Becerril, Stoltenberg, Lee, Xue, Mannsfeld and Bao26,Reference Goto, Tomiya, Murakami, Shinozaki, Toda, Kasahara and Hobara40–Reference Giri, Park, Vosgueritchian, Shulaker and Bao46 Recent work by Diao et al. has shown that highly aligned, high-performance single crystals of TIPS-pentacene can be patterned on selectively wetting surfaces using nucleation and fluid flow control. However these performance improvements were seen on large patterns that required sacrificial nucleation regions which increased the overall areas required for a given pattern. Reference Diao, Tee, Giri, Xu, Kim, Becerril, Stoltenberg, Lee, Xue, Mannsfeld and Bao26 Reduced feature areas have been achieved using a combination of fine substrate prepatterning and solution shearing, which yields lattice-strained and aligned crystals of TIPS-pentacene. Reference Giri, Park, Vosgueritchian, Shulaker and Bao46 The patterned solvent wetting features were smaller than 20 µm in width, and were created using photolithography. The lateral confinement of TIPS-pentacene thin films proved to aid in nucleation control of the TIPS-pentacene thin films.
In this work, we investigate the impact of confining the growth of crystalline TIPS-pentacene in mesoscale regions (400–100 µm) using solution shearing and templated regions of variable solvent wettability. Unlike our previous work, these patterns were created through contact patterning, and do not require complicated photolithographic methods. Grazing incidence x-ray diffraction (GIXD) was also used to confirm the existence of high performance TIPS-pentacene polymorphs in the patterned thin films, and it was shown that by varying the solution shearing parameters, the crystallinity of deposited thin films could be controlled, yielding morphologies ranging from aligned crystals to isotropic spherulites. These patterned crystals showed mobilities of 0.7 cm2 V−1 s−1 on patterns as small as 100 µm.
II. RESULTS AND DISCUSSION
A. Patterning process
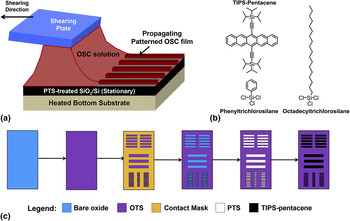
In the solution shearing deposition process, a shearing plate modified with a lyophobic octadecyltrichlorosilane (OTS) monolayer is translated at varying rates to drag a solution of TIPS-pentacene in toluene (8 mg mL−1) across a heated (90 °C) device substrate that has been modified with a lyophilic monolayer of phenyltrichlorosilane (PTS) [Fig. 1(a)]. The chemical structures of OTS, PTS, and TIPS-pentacene are shown in Fig. 1(b). The patterned regions are aligned with the longer edge parallel to the shearing direction, for patterns with aspect ratios greater than 1:1.
(a) Schematic illustration of the solution shearing method. (b) Chemical structures of TIPS-pentacene, PTS, and OTS. (c) Schematic illustration of the patterning method.

The schematic patterning process is depicted in Fig. 1(c). The OTS treatment is performed first to ensure a uniform, solvent dewetting monolayer on the substrate. A contact mask is then applied and the samples are subjected to UV-ozone treatment to selectively remove the OTS monolayer, exposing the underlying silicon oxide. The samples are treated by a liquid-phase PTS deposition process, wherein PTS physisorbs within OTS-modified regions and chemisorbs in pattern-positive regions of exposed silicon oxide. Nontemplated deposition of physisorbed PTS can be reversed by gentle mechanical scrubbing. The PTS monolayer ensures that the desired regions are wetting to the solvent toluene. Three types of patterns were chosen for our study: rectangular patterns with line widths of 400 µm and an aspect ratio of 1:20, 100 µm wide rectangular patterns with an aspect ratio of 1:10, and 250 µm square patterns used to further study the effect of varying aspect ratios on TIPS-pentacene crystallization and the resulting TFT mobility.
B. Cross-polarized optical microscopy of patterned thin films
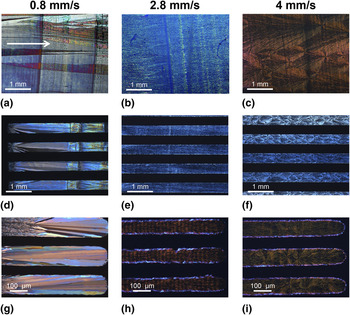
TIPS-pentacene was solution sheared on the patterned substrates at varying shearing speeds. All other parameters were held constant, with a substrate temperature of 90 °C, a shearing plate gap of 100 µm, and an initial solution concentration of 8 mg/mL TIPS-pentacene in toluene. Figure 2 illustrates the cross-polarized optical microscope (CPOM) images of the TIPS-pentacene thin films formed under different shearing speeds and substrate patterns. Figures 2(a)–2(c) show the CPOM images for thin films that were formed on reference PTS modified substrates without any patterns, at shearing speeds of 0.8 mm/s [Fig. 2(a)], 2.8 mm/s [Fig. 2(b)], and 4 mm/s [Fig. 2(c)], respectively. In Fig. 2(a), oriented, millimeter-wide TIPS-pentacene domains can be seen, where the long axis of the crystal is parallel to the shearing direction. At the shearing speed of 2.8 mm/s, these crystallites became smaller and narrower [Fig. 2(b)]. When the shearing speed was increased to 4 mm/s, the TIPS-pentacene thin film formed with a transcrystalline texture, as had been observed previously for unpatterned substrates [Fig. 2(c)]. Reference Giri, Verploegen, Mannsfeld, Atahan-Evrenk, Lee, Becerril, Aspuru-Guzik, Toney and Bao25
(a–c) CPOM images of solution-sheared TIPS-pentacene thin films on an unpatterned substrate, at shearing speeds of (a) 0.8 mm/s, (b) 2.8 mm/s, and (c) 4 mm/s. White arrow indicates shearing direction. (d–f) CPOM images of solution-sheared TIPS-pentacene thin films on a patterned substrate 400 µm in width, at shearing speeds of (d) 0.8 mm/s, (e) 2.8 mm/s, and (f) 4 mm/s. (g–i) CPOM images of solution-sheared TIPS-pentacene thin films on a patterned substrate 100 µm in width, at shearing speeds of (g) 0.8 mm/s, (h) 2.8 mm/s, and (i) 4 mm/s.

The long axis of the rectangular patterns was aligned parallel to the shearing direction to match the fast growth axis (b-axis) of the TIPS-pentacene thin film crystals. Figures 2(d)–2(f) show the CPOM images of thin films that were formed on the solvent wetting, PTS-modified regions 400 µm in width and 8 mm in length, at shearing speeds of 0.8 mm/s [Fig. 2(d)], 2.8 mm/s [Fig. 2(e)], and 4 mm/s [Fig. 2(f)]. The crystal texture changes with increasing shearing speed from long, oriented crystallites to smaller, oriented crystallites, and finally to transcrystallites, like the thin films deposited on the unpatterned substrates. As the pattern size was reduced to 100 µm in width and 1 mm in length [Figs. 2(g)–2(i)], the TIPS-pentacene thin films sheared at 0.8 mm/s [Fig. 2(g)] became narrower, with multiple crystallite domains visible across the 100 µm width. At the faster shearing speed of 2.8 mm/s and 4 mm/s, the change in crystallite texture was accompanied by the formation of misoriented crystallites along the edge of the pattern [Figs. 2(h) and 2(i)]. Additionally, only spherulitic crystals could be seen at a shearing speed of 4 mm/s. As the patterned areas decreased in width, the boundary of the solvent wetting patterns has a larger effect, destabilizing the meniscus and causing the formation of misoriented crystallites. The formation of spherulites indicates that at the line width of 100 µm, TIPS-pentacene nucleation occurs more rapidly, compared to the unpatterned substrates.
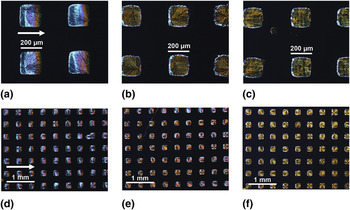
TIPS-pentacene thin films were also solution sheared on 250 µm square patterns [Figs. 3(a)–3(c)]. At the shearing speed of 0.8 mm/s, the formation of isotropic, spherulitic structures were seen instead of large domains of oriented crystallites [Figs. 3(a) and 3(d)]. The spherulitic crystal morphology was observed at the shearing speeds of 2.8 mm/s [Figs. 3(b) and 3(e)] and 4 mm/s [Figs. 3(c) and 3(f)] as well. Unlike the rectangular patterns, the square patterns were not long enough to allow the establishment of steady state crystal growth. The absence of steady crystal growth favors more isotropic nucleation, and therefore, isotropic, misoriented crystallites formed under all shearing conditions explored for the square patterns.
CPOM images of solution-sheared TIPS-pentacene thin films on 250 µm square patterns, at shearing speeds of (a) 0.8 mm/s, (b) 2.8 mm/s, and (c) 4 mm/s. (d–f) Large area images of samples shown in (a–c). White arrow indicates shearing direction.

C. Grazing incidence x-ray diffraction
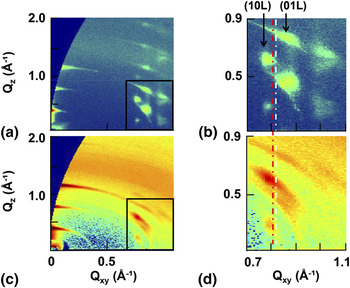
Previous research on TIPS-pentacene has shown that a nonequilibrium, lattice-strained crystal structure has a smaller π–π stacking distance compared to the equilibrium crystal structure. Reference Giri, Verploegen, Mannsfeld, Atahan-Evrenk, Lee, Becerril, Aspuru-Guzik, Toney and Bao25 This decrease in the π–π stacking distance is accompanied by enhanced electronic orbital overlap and a consequent increase in charge carrier mobility along the π–π stacking direction, typically the long axis (the b-axis of the crystallites for TIPS-pentacene). Here, GIXD was used to determine if the patterned thin films exhibited a nonequilibrium packing structure. Figure 4(a) shows the GIXD image of an unpatterned TIPS-pentacene thin film, with the inset of the (10L) and the (01L) diffraction rods shown in Fig. 4(b). The equilibrium peak position of the (10L) Bragg peak is marked by the dashed red line, and the equilibrium peak position of the (01L) Bragg peak is marked by the dashed white line. The shift of the (10L) and the (01L) Bragg peak positions from the equilibrium peak positions indicates that the unpatterned thin films obtained here have nonequilibrium packing structures. Figure 4(c) shows the GIXD image of a TIPS-pentacene thin film sheared at 8 mm/s on a rectangular patterned substrate with a line width of 400 µm. Figure 4(d) shows an inset of the (01L) and (10L) Bragg peaks. The positions of the (01L) and (10L) diffraction rods are the same as the unpatterned thin film in Fig. 4(b), which indicates that the TIPS-pentacene patterned in 400 µm line widths is lattice strained. Thus, we conclude that we are able to form the metastable polymorphs on the patterned substrate. The Bragg rods in Fig. 4(d) are more arced than in Fig. 4(b), indicating that the crystallites formed during solution shearing on patterned substrates are misoriented out of the plane of the substrate compared to the unpatterned thin films. This misorientation may lead to poor charge transport in the resulting TFTs.
(a) GIXD image of unpatterned, TIPS-pentacene thin film sheared at 8 mg/mL, 90 °C and 8 mm/s from toluene. (b) Inset highlighting the (10L) and (01L) diffraction peak positions from the GIXD region shown in (a). The equilibrium (10L) diffraction rod position is indicated by the white dashed line. The equilibrium (01L) diffraction rod position is indicated by the red dashed line. The equilibrium peaks are not seen in these images due to the high solution shearing speed, which traps only the nonequilibrium structures. The shift of the (10L) and (01L) Bragg peaks from the equilibrium positions indicates that the TIPS-pentacene thin films are lattice strained. (c) GIXD image of patterned, 400 µm rectangular TIPS-pentacene thin film sheared at 8 mg/mL, 90 °C and 8 mm/s from toluene. (d) Inset highlighting the (01L) and (10L) diffraction peak positions from the GIXD region shown in (c), which indicate that there is nonequilibrium molecular packing of TIPS-pentacene.

D. Thin film transistor characterization
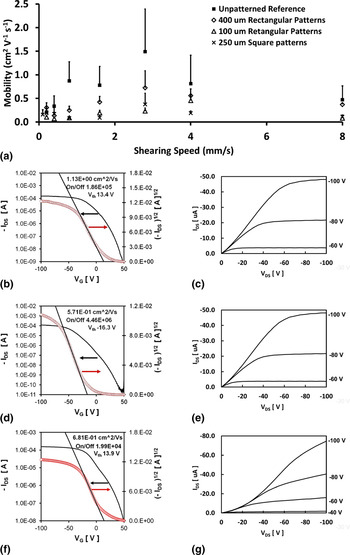
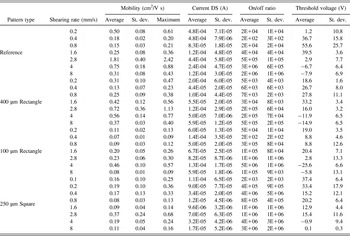
To understand the effect of patterning on the TIPS-pentacene field effect mobility, we measured the in-plane hole mobility in a bottom-gate, top-contact field effect transistor configuration with a 50 µm channel length. The field effect mobility was measured parallel to the shearing direction for all thin films, as this is the direction of fast charge transport for TIPS-pentacene. Reference Giri, Verploegen, Mannsfeld, Atahan-Evrenk, Lee, Becerril, Aspuru-Guzik, Toney and Bao25 The average mobility of the TFTs as a function of shearing speed for different patterns is shown in Fig. 5(a), and the full electrical characterization is presented in Table I.
(a) Average charge carrier mobilities of transistors fabricated from TIPS-pentacene thin films sheared at various speeds on different patterned substrates. The mobilities were measured parallel to the shearing direction. The error bars show the standard deviation. I DS is the source–drain current. ‘On/off’ represents the ratio between the maximum current in the device when it is active, and the minimum current when the device is turned off. V th represents the threshold voltage. (b) Representative transfer curve and (c) output curve of a device prepared at a shearing speed of 2.8 mm/s, on rectangular patterns 400 µm in width. (d) Representative transfer curve and (e) output curve of a device prepared at a shearing speed of 2.8 mm/s, on rectangular patterns 100 µm in width. (f) Representative transfer curve and (g) output curve of a device prepared at a shearing speed of 2.8 mm/s, on square patterns 250 µm in width.

Electrical performance of TFTs fabricated on unpatterned and patterned OSC thin films of varying dimensions. Note that the listed source–drain current is the maximum current observed in the on-state, when the device is operating within the saturation regime. Each experimental condition was tested across n = 5 independent devices.

Previous literature has shown that under the shearing conditions used in this work, the maximum carrier charge transport mobility occurs at a shearing speed of 2.8 mm/s. Reference Giri, Verploegen, Mannsfeld, Atahan-Evrenk, Lee, Becerril, Aspuru-Guzik, Toney and Bao25 Further experiments and analysis revealed that the TIPS-pentacene forms a nonequilibrium molecular packing at this shearing condition, and this nonequilibrium molecular packing leads to faster charge transport. Our reference samples showed maxima in mobility at this shearing speed of 2.8 mm/s as well. Interestingly, the maximum mobility obtained for all pattern types in this study also occurred at a shearing speed of 2.8 or 4 mm/s, although the mobility decreased as the patterns became smaller.
The transfer characteristics of representative TFTs formed from 400 µm rectangular features [Fig. 5(b)], 100 µm rectangular features [Fig. 5(d)], and 250 µm square features [Fig. 5(f)] at a shearing speed of 2.8 mm/s show that the mobility is reduced as the pattern width becomes smaller. The output characteristics of representative TFTs for the 400 µm rectangular patterns, 100 µm rectangular patterns, and 250 µm square patterns are shown in Figs. 5(c), 5(e), and 5(g), respectively. In Fig. 5(g), we see pronounced contact resistance effects that can result in nonoptimal charge transfer, leading to lower mobilities.
Compared to the unpatterned reference samples, all patterned TFTs exhibit a lower mobility at comparable shearing speeds. This is in contrast to our previous study, where the field effect mobility increased with decreasing pattern line width. Reference Li, Tee, Giri, Chung, Lee and Bao44 In the previous work, the pattern sizes explored were smaller (20–0.5 µm), and decreasing line width served to constrain TIPS-pentacene nucleation via lateral confinement, promoting the growth of aligned crystals. In the current study, the pattern width was larger (100-400μm), and thus nucleation was not influenced by lateral confinement.
Our results suggest that the polycrystalline thin films deposited on the patterned substrates contain edge defects, which result in reduced charge transport relative to thin films deposited on unpatterned substrates. Within this mesoscale regime, the effects of these defects become more pronounced as the width of the solvent-wetting region is reduced. At the shearing speed of 2.8 mm/s, the substrates with a pattern width of 400 µm have a maximum mobility of 1.13 cm2/Vs, while the substrates with a pattern width of 100 µm have a maximum mobility of 0.57 cm2/Vs. We attribute these results to the effect of small, misoriented crystallites that nucleate and grow at the edges of the solvent-wetting regions. These misoriented crystallites, between which electronic overlap and charge transport are reduced, constitute a greater proportion of the TFT active channel and contribute more significantly to overall charge transport as the pattern width decreases, leading to regions of low mobility in the resulting devices.
Reduced charge carrier mobility is also observed when the aspect ratio of the patterns is decreased, e.g., in square features. This low mobility is attributed to the isotropic crystal structure seen in the square patterns at all shearing speeds. Our previous work has shown that the inherent rate of charge transport along the a-axis of TIPS-pentacene is lower than that along the b-axis. Reference Giri, Verploegen, Mannsfeld, Atahan-Evrenk, Lee, Becerril, Aspuru-Guzik, Toney and Bao25 In isotropic crystalline films of TIPS-pentacene, charge transport may occur along the a-axis to a greater degree, which results in these lower charge carrier mobilities. We observe that the spherulitic morphology predominates in the low aspect ratio features, in which the length of the major axis is insufficient for the establishment of steady-state crystal growth.
III. CONCLUSION
In conclusion, we have combined solution shearing deposition with templated solvent wetting to produce patterned TFTs from nonequilibrium, high performance TIPS-pentacene thin films. Rectangular patterns of widths 400 and 100 µm were fabricated, as well as square patterns with 250 µm dimensions. The crystallite texture became less oriented with respect to the shearing direction as the pattern sizes were reduced in width. Mobilities as high as 1.13 cm2/Vs were possible, demonstrated on rectangular patterns with 400 µm width. Notably, mobilities as high as 0.57 cm2/Vs were realized for TFTs fabricated from TIPS-pentacene thin films deposited on 100 µm wide rectangular patterns, as well as on 250 µm wide square patterns. The patterning method developed in this work can be used in conjunction with solution shearing to pattern large area, high density TFTs for organic electronic applications.
IV. METHODS
A. Materials
The TIPS-pentacene (99.9% purity, received from Sigma–Aldrich) was used without further purification. Phenyltrichlorosilane (PTS) and octadecyltrichlorosilane (OTS) were purchased from Sigma–Aldrich and Gelest, respectively, and were used as received (95% purity, stored under an argon atmosphere to prevent hydrolysis). Highly doped n-type silicon wafers (resistivity <0.005 Ω cm) with a 300-nm thermally grown silicon oxide gate dielectric layer (capacitance of the gate dielectric per unit area, C ox = 10 nF cm−2) were used as the substrates for TFT fabrication and GIXD.
B. Substrate preparation and characterization
The silicon wafers were cleaned in a Piranha solution (70/30 vol./vol. H2SO4/H2O2; a highly oxidative solution) for 25 min. For the unpatterned substrate, the bottom device substrate (2 × 2 cm2) was treated with PTS to ensure proper wetting for the TIPS-pentacene solution and to reduce surface charge traps. PTS treatment was accomplished by immersing the Piranha-cleaned wafer into a toluene solution of PTS (3 wt%) and heating the solution at 90 °C for 15 h. The substrate was subsequently removed from PTS solution and was sonicated for 2 min in toluene. The wafer surface was then gently wiped with a sponge tip and rinsed sequentially with toluene, acetone, and isopropanol. The water contact angle of the PTS-treated surface ranged from 72° to 74°. The typical roughness (root mean square) of the surface was 0.3–0.5 nm, as measured by atomic force microscopy (AFM).
For the top shearing plate and OTS-treated samples, a silicon wafer with 300-nm thermally grown oxide was treated with a monolayer of OTS according to a method we published previously for forming a highly hydrophobic crystalline OTS monolayer. Reference Ito, Virkar, Mannsfeld, Oh, Toney, Locklin and Bao47 The OTS treatment of the shearing blade is important to ensure deposition of TIPS-pentacene only on the bottom PTS-treated substrate. The water contact angle of the OTS-modified silicon wafer ranged between 102° and 104°, and the roughness of the surface ranged between the root-mean-square values of 0.2 and 0.5 nm, as measured by AFM.
For the patterned substrates, samples (1 × 2 cm2) were cut from the OTS-modified wafer and were then cleaned with a panel of three solvents – toluene, acetone, and isopropanol – using gentle swabbing with a wet sponge tip in between solvents. Shadow masks of desired feature dimensions and densities were affixed to the samples via alligator clips, and the samples were irradiated in a UV/ozone oven (Jelight UVO-cleaner Model 42 – 100V; λ = 253.7 nm, Jelight Company Inc., Irvine, CA) for 4 min to subject regions of the OTS film to ozonolysis. A 3% volumetric solution of PTS in toluene was prepared, and the freshly irradiated samples were transferred directly into this solution. The samples were then heated at 90 °C for 15 h. Following this step, the samples were transferred into a fresh toluene solution and sonicated for 2 min to remove physisorbed PTS. The samples were washed and gently swabbed using toluene, and then dried under a N2 stream.
C. Solution shearing of TIPS-pentacene films
An 8 mg mL−1 solution of TIPS-pentacene in filtered (22 µm pore size) toluene was prepared, and was heated at 60 °C with a stir bar for 45 min. Having assured the full dissolution of the TIPS-pentacene crystals, the temperature of the solution was then raised to 90 °C. The samples were placed on a resistively heated shearing stage (a thermoelectric model from Custom Thermoelectric, Bishopville, MD) at 90 °C. An OTS-modified silicon oxide wafer was used as the shearing blade, and both the shearing blade and the sample were held in place via a vacuum line. The shearing blade was lowered to form a 100 µm gap between its edge and the substrate surface, and the blade was placed at a tilt angle of 8° from the horizontal. Approximately 35 µL cm−2 of TIPS-pentacene solution was applied to the substrate surface using a micropipette, and the shearing blade was then drawn across the surface at a predefined shearing rate using a stepper motor. The solution shearing apparatus was controlled using QuickMotion software. Following film deposition, the sample was left on the heated stage for 1–2 min to allow for the nascent film to anneal and for any residual solvent to fully evaporate.
D. Solution-sheared film characterizations
The solution-sheared films were characterized using a CPOM (Leica DM4000M, Leica Microsystems, Buffalo Grove, IL). Thickness measurements were performed with a Dektak 150 profilometer, purchased from the Veeco Metrology Group. Tapping-mode AFM was performed using a Multimode Nanoscope III (Digital Instruments, Tonawanda, NY/Veeco Metrology Group, Plainview, NY).
Bottom-gate, top-contact TFTs were formed on the sheared features by thermally evaporating 40 nm gold source and drain electrodes through a shadow mask at 0.5 Å s−1 and a pressure of 5.0 × 10⁻⁷ Torr. For control samples, the width of the active channel was defined to be 1000 µm and the length was defined to be 50 µm, for a W/L ratio of 20. For patterned samples where this value might vary, the ratio was confirmed or adjusted via optical microscopy measurements. The TFTs were formed and tested under ambient conditions, and were exposed to air and light. A gate contact was formed on each sample by selectively etching through the oxide layer with a diamond scribe, and the active channels of the devices were physically isolated from this contact to prevent short-circuiting. The electrical properties of the sheared films were analyzed using a Keithley 4200-SCS (Keithley Instruments, Cleveland, OH) semiconductor parameter analyzer. Transfer IV curves (I
DS−I
G) were obtained with a fixed source–drain voltage (V
D) of −100 V and a gate voltage (V
G) sweeping from 50 to −100 V with a 1 V step size. Mobilities were calculated using the 20-point slope of the transfer curve
 ${V_{\rm{G}}} - \sqrt {{I_{{\rm{DS}}}}}$
, with
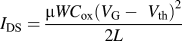 $\,{I_{{\rm{DS}}}} = {{\mu W{C_{{\rm{ox}}}}{{\left( {{V_{\rm{G}}}-{\rm{\ }}{V_{{\rm{th}}}}} \right)}^2}} \over {2L}}$
. Here C
ox is the capacitance of the gate dielectric per unit area (10 nF cm−2) and V
th is the threshold voltage.
GIXD was performed at the Stanford Synchrotron Radiation Lightsource on the 1–5 beamline. A photon energy of 12.73 keV was used, and the scattering intensity was recorded on a two-dimensional image plate (MAR-345) with a pixel size of 150 × 150 µm2 (2300 × 2300 pixels), located at a distance of 400 mm from the sample center. The distance between the sample and the detector was calibrated using a LaB6 polycrystalline standard. The incidence angle was chosen in the range 0.10°–0.14°. The beam size was 50 µm × 150 µm, which resulted in a 150 µm wide beam exposure over the entire length of the 10 mm sample. The data were corrected for theta-dependent image distortion introduced by the planar detector surface, before images were subjected to quantitative analysis. Numerical integration of the diffraction peak areas was performed with the software WxDiff. Reference Mannsfeld, Tang and Bao48 The overall resolution in the GIXD experiments, dominated by the sample size, was about 0.01 Å−1.
ACKNOWLEDGMENTS
This publication was partially supported by the National Science Foundation (DMR-1006989, DMR-1059020, and DMR-1303178), the Air Force Office of Scientific Research (FA9550-12-1-0190), and the Global Climate and Energy Project at Stanford University. Z.B. acknowledges support from the David Filo and Jerry Yang Faculty Fellowship from Stanford University. Portions of this research were carried out at the Stanford Synchrotron Radiation Lightsource, a national user facility operated by Stanford University on behalf of the US Department of Energy, Office of Basic Energy Sciences. Any opinions, findings, and conclusions or recommendations expressed in this publication are those of the authors and do not necessarily reflect the views of Stanford University, the Sponsors of the Global Climate and Energy Project, or others involved with the Global Climate and Energy Project.