We are in the midst of a transformation in the way that biodiversity is observed on the planet. The approach of direct human observation, combining efforts of both professional and citizen scientists, has recently generated unprecedented amounts of data on species distributions and populations. Within just a few years, however, we believe that these data will be swamped by indirect biodiversity observations that are generated by autonomous sensors and machine learning classification models. In this commentary, we discuss three important elements of this shift towards indirect, technology-driven observations. First, we note that the biodiversity data sets available today cover a very small fraction of all places and times that could potentially be observed, which suggests the necessity of developing new approaches that can gather such data at even larger scales, with lower costs. Second, we highlight existing tools and efforts that are already available today to demonstrate the promise of automated methods to radically increase biodiversity data collection. Finally, we discuss one specific outstanding challenge in automated biodiversity survey methods, which is how to extract useful knowledge from observations that are uncertain in nature. Throughout, we focus on one particular type of biodiversity data – point occurrence records – that are frequently produced by citizen science projects, museum records and systematic biodiversity surveys. As indirect observation methods increase the spatiotemporal scope of these point occurrence records, ecologists and conservation biologists will be better able to predict shifting species distributions, track changes to populations over time and understand the drivers of biodiversity occurrence.
The Necessity: We Have Fewer Data than We Think
With few exceptions, global point occurrence records have historically been generated by direct observation, where a human in the field records a personal, verified observation of an individual organism or its sign. The Global Biodiversity Information Facility (GBIF) database (GBIF 2019) is one major effort to collate such records from a variety of sources. As of the time of writing, this database has passed 1 billion occurrence records, the vast majority of which are sourced from citizen science efforts.
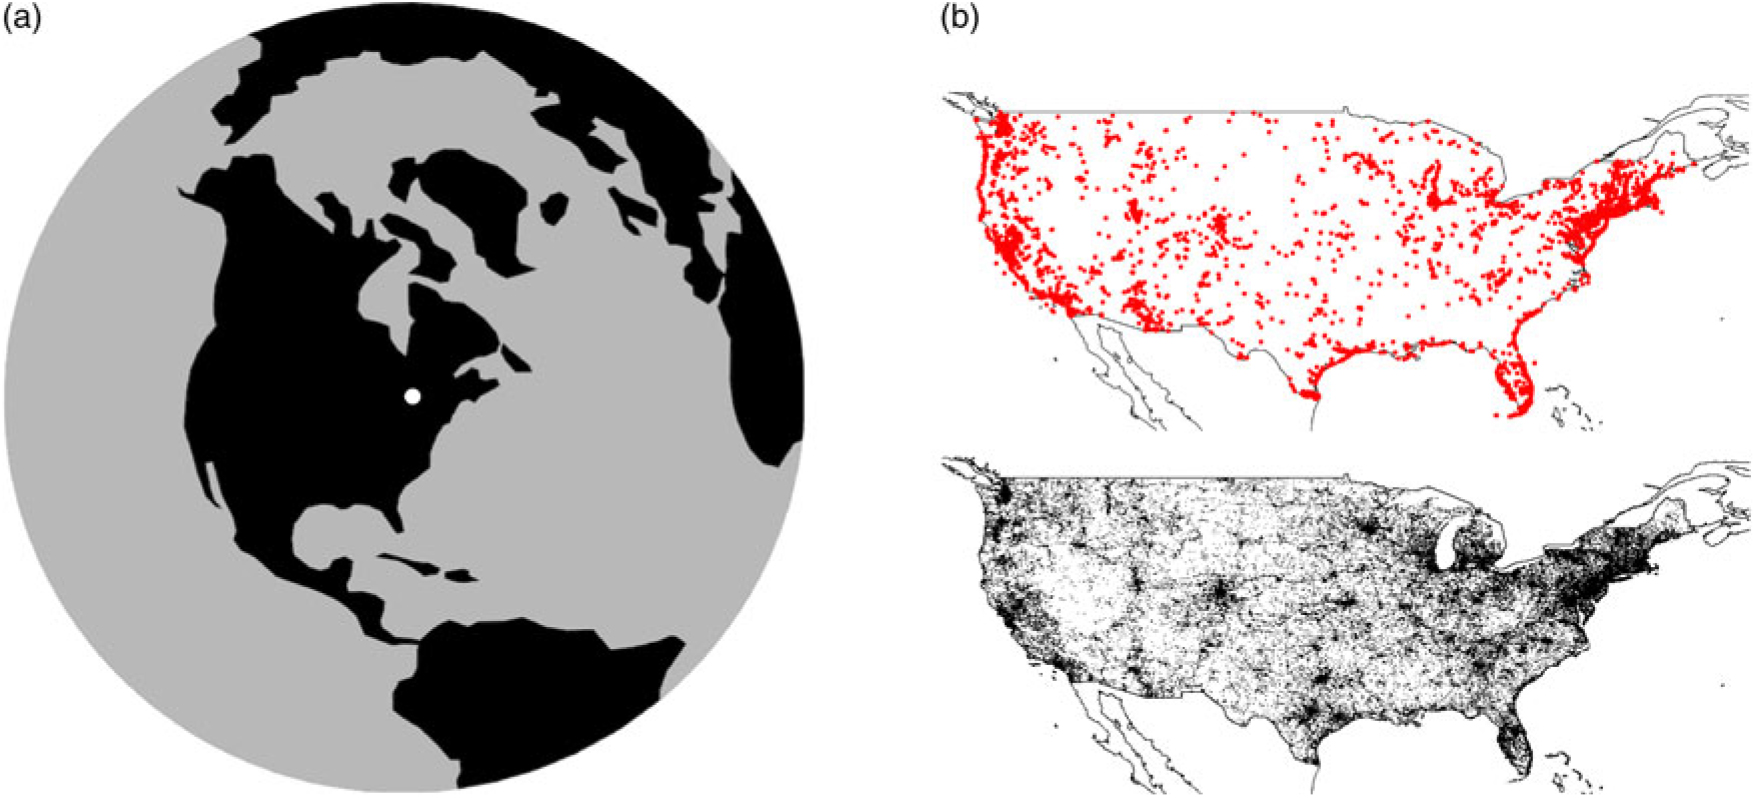
We would note, however, that these data are not as big as they are often perceived to be. For example, there were c. 92 million occurrence records added to the GBIF database for the year 2016. Presume, very generously, that none of these observations are overlapping in space. Assume further that each observation represents a human observing the organism in a 100-m2 area (e.g., a 10-m × 10-m box) for c. 15 minutes, a period during which the observer was present. Together, these 92 million observations would cover an effective area of 9200 km2 (Fig. 1(a)), which represents c. 0.002% of the Earth’s surface and 0.00000006% of the combined areas and times at which the planet could be observed. Each of those observations, of course, also describes only one of the perhaps hundreds or thousands of species that were in that area at the time of observation.
Fig. 1.(a) The centre dot covers an area of 9200 km2, approximately the estimated total area of the planet covered by Global Biodiversity Information Facility (GBIF) observations in 2016. (b) Top panel: 10 000 point occurrence records for the continental United States, drawn from the GBIF database in 2016. Points are denoted by markers of a size commonly used in data visualization. These markers cover c. 16% of the continental United States. Bottom panel: Map showing 2.5 arc minute grid cells, with black cells containing an eBird observation in 2016; 28% of cells in the continental United States are coloured black.
In our experience, many ecologists are surprised at the limited scope of this coverage. We suspect that this surprise is driven by our collective habit of making the markers on maps of these observations much larger than the actual area covered by the observation (Fig. 1(b)).
Even limited data, of course, can be used as the basis for models that predict species presence or population sizes in unsampled areas. Such modelling would ideally be based on unbiased, representative observations drawn from all possible areas and times of observation. There is evidence, however, that existing point occurrence data are not representative of habitats in this manner (see Supplementary Table S1, available online). Additionally, there are many conservation applications that are better served by actual species observations, not modelled predictions. Our experience is that this desire for ‘hard data’ is most common in situations involving management and policy decisions, which often involve significant costs, and for questions involving relatively fine spatial scales, below the resolution at which many spatial models are believed to apply.
The Promise: An Explosion in Biodiversity Observations, Starting Today
Indirect, technology-mediated observation approaches, such as camera traps (Steenweg et al. Reference Steenweg, Hebblewhite, Kays, Ahumada, Fisher and Burton2017, Buxton et al. Reference Buxton, Lendrum, Crooks and Wittemyer2018), acoustic recorders (Towsey et al. Reference Towsey, Parsons and Sueur2014, Sugai et al. Reference Sugai, Silva, Ribeiro and Llusia2018) and satellite imagery (Marconi et al. Reference Marconi, Graves, Gong, Nia, Le Bras and Dorr2019), are rapidly becoming familiar to ecologists and conservation biologists. When combined with machine learning classification methods that can identify species in the images and recordings captured by these devices, these tools can produce the same type of point occurrence records that are generated by human observers.
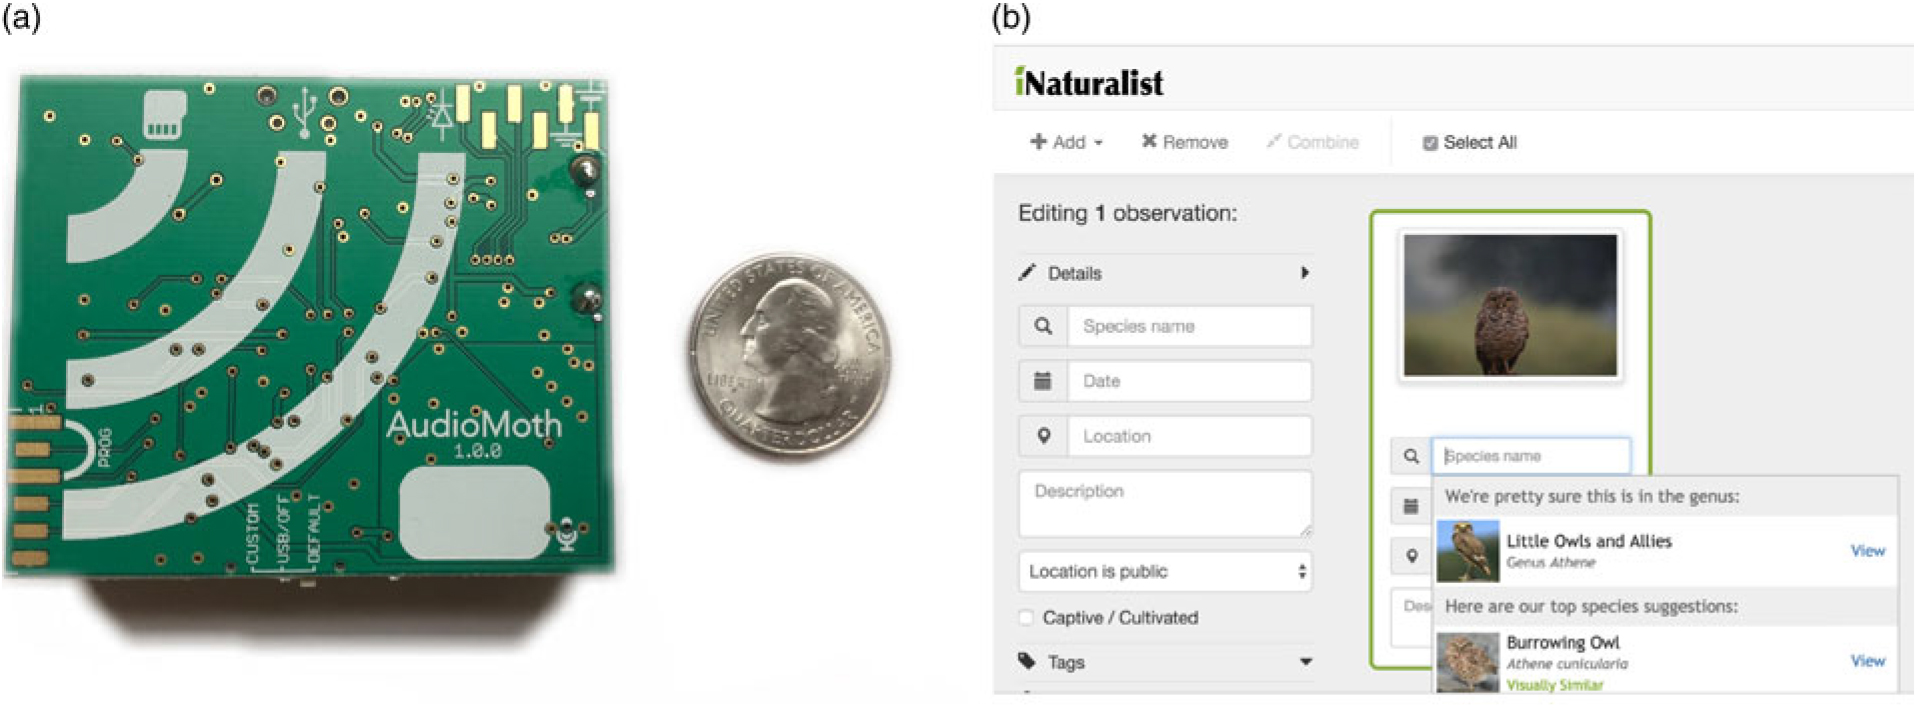
The first enabler of indirect observation is inexpensive hardware. For example, there have been several efforts to develop extremely low-cost versions of acoustic field recorders, including the recently released AudioMoth (Hill et al. Reference Hill, Prince, Pinña Covarrubias, Doncaster, Snaddon and Rogers2018), which can be produced for less than US$50 (Fig. 2(a)). These devices can record audible frequencies for c. 150–200 hours in the field and, in our experience, produce results comparable to widely used commercial field recorders that cost US$850 or more. Interestingly, we note that no similarly inexpensive automated camera trap equipment has yet been widely adopted.
The potential scale of indirect data collection enabled by this inexpensive hardware dwarfs current direct observational methods. For example, in 2017, the North American Breeding Bird Survey (BBS) (USGS 2017), one of the largest systematic avian biodiversity surveys in the world, surveyed 2646 road transects in the USA, each with 50 stops and a 3-minute point count at each stop. This represented a total of c. 6600 hours of sampling effort. A set of 50 AudioMoth field recorders, purchased for less than US$2500, can equal this sampling effort with a single field deployment. While we are not suggesting that the temporal replication provided by such recorders can replace the extensive spatial replication of the BBS, we highlight that even small numbers of recorders can generate far more biodiversity observations than researchers are accustomed to using when making inference about biodiversity patterns.
The second enabler of these large-scale surveys is software, specifically pre-trained machine learning models that can extract species identities from sensor-recorded data. For many applications, such models already exist and are in general use. For example, for acoustic recordings, at least three automated bat classification software packages have been approved for Indiana bat surveys by the US Fish and Wildlife Service (USFWS 2019). Accurate automated bird classification from recordings has proven to be a more difficult problem (LifeCLEF 2019, Stowell et al. Reference Stowell, Wood, Pamuła, Stylianou and Glotin2019), particularly in diverse communities, although accuracy may be very high under some conditions (Priyadarshani et al. Reference Priyadarshani, Marsland and Castro2018). The commercial ARBIMON platform (Corrada Bravo et al. Reference Corrada Bravo, Álvarez Berríos and Aide2017) provides a user-friendly, cloud-based system that allows users to create such classification models. For photographs, the iNaturalist app (iNaturalist 2019) and a recently released Microsoft AI for Earth photograph classification service (Microsoft 2019) provide models that identify the species present in photographs (Fig. 2(b)). Methods specifically designed for automated photographs taken by camera traps are becoming available as well (Norouzzadeh et al. Reference Norouzzadeh, Nguyen, Kosmala, Swanson, Palmer, Packer and Clune2018). As such models continue to shift to the cloud, users will be able to process much larger volumes of data than they could previously on their own computers.
Fig. 2.(a) Photograph of an AudioMoth, an inexpensive acoustic recording device. (b) Screenshot of the iNaturalist iOS app, demonstrating automated species classification from a photograph.
The Challenge: Drawing Conclusions from Uncertain Data
Despite the promise of technology-mediated indirect biodiversity observations, there are still several key challenges in gathering such observations. These include the costs of deploying large numbers of sensors, computational challenges surrounding the storage and processing of ‘big data’ and issues of survey design for large arrays of sensors. We wish to specifically highlight one subtler challenge, however, which we believe is substantially hindering progress: the need for better approaches for dealing with uncertainty in these indirect observations.
Machine learning classifiers often appear to be less accurate than well-trained human observers (although we note that, in practice, not all observers generating biodiversity data may be ‘well trained’). A potential advantage of automated classifiers over human observers, however, is that these classifiers are often able to provide quantitative estimates of the uncertainty in their identifications. Examples include non-binary predictions from a neural net, probabilities from a random forest or confusion matrices from model testing. In our experience, however, many ecologists and conservationist biologists are unsure how to draw conclusions from such uncertain data, particularly when uncertainties are high. For example, what should we conclude about the distribution or niche requirements of a species when, across 100 sampling points with varying habitat conditions, a classifier returns probabilities anywhere from 1% to 80% that a species was actually present?
A common approach is to choose a threshold (say, 50% or 75%) in order to convert these probabilities into binary outcomes. Probabilities below this threshold are either defined as an absence or as insufficient data. We do not find this approach satisfactory, as it effectively ignores or discards the information about the classification accuracy that the model has provided. When such uncertainty is ignored, our confidence about the drivers of a species’ presence or absence will generally be too high. When data are discarded due to low certainty, useful information about these drivers is effectively being thrown away.
We suggest that the correct approach is to use classifiers and statistical models that treat uncertainty more explicitly. First, machine learning classifiers must be specifically designed to return probabilistic, not binary, estimates of species occurrence in an image or recording. Second, statistical models must be designed to take this probabilistic classifier output as input data, instead of the more usual binary presence–absence data. The standard statistical models that are widely used in ecology and conservation, including generalized linear mixed models, generalized additive models and generalized estimating equations (Zuur et al. Reference Zuur, Ieno, Walker, Saveliev and Smith2009), are not designed for this type of input. There are several paths forward, including extending these existing frameworks using logic similar to weighted least squares or developing Bayesian hierarchical models that allow input data that are continuous probabilities rather than a binary observations. Ultimately, however, such practices will only be widely adopted by practitioners when accounting for classification uncertainty is no more difficult than the equivalent analysis that ignores uncertainty. Although new tools will need to be developed in order to make this type of analysis accessible, many of the conceptual and methodological pieces needed to create those tools already exist.
Summary
We believe that the fields of ecology and conservation biology are in the midst of a rapid and discipline-defining shift towards technology-mediated, indirect biodiversity observation. It is useful to remember that ecology and conservation biology are not the first fields to go through such a transition. Urban planners who review satellite imagery instead of walking city streets, astronomers who analyse data from automated sky surveys instead of looking through a telescope and sociologists who analyse online discussions instead of conducting interviews have all confronted many of the issues raised above and responded in part by opening up fundamentally new directions in their disciplines.
Finally, for those who remain sceptical of the value of indirect observations, it is also useful to remember that we can never predict the advances in methods that may occur in the future. Unlike humans in the field, automated sensors produce a permanent visual or acoustic record of a given location and time that is far richer than a simple note that ‘species X was here at time Y’. Similar to museum specimens, these records will undoubtedly be reanalysed by future generations of ecologists and conservation biologists using better tools than we have available now in order to extract information and answer questions that we cannot imagine today. And these future researchers will undoubtedly thank us, as we thank previous generations of naturalists, for having the foresight to collect as many observations as possible of the rapidly changing species and habitats on our planet.







 You have
Access
We are in the midst of a transformation in the way that biodiversity is observed on the planet. The approach of direct human observation, combining efforts of both professional and citizen scientists, has recently generated unprecedented amounts of data on species distributions and populations. Within just a few years, however, we believe that these data will be swamped by indirect biodiversity observations that are generated by autonomous sensors and machine learning classification models. In this commentary, we discuss three important elements of this shift towards indirect, technology-driven observations. First, we note that the biodiversity data sets available today cover a very small fraction of all places and times that could potentially be observed, which suggests the necessity of developing new approaches that can gather such data at even larger scales, with lower costs. Second, we highlight existing tools and efforts that are already available today to demonstrate the promise of automated methods to radically increase biodiversity data collection. Finally, we discuss one specific outstanding challenge in automated biodiversity survey methods, which is how to extract useful knowledge from observations that are uncertain in nature. Throughout, we focus on one particular type of biodiversity data – point occurrence records – that are frequently produced by citizen science projects, museum records and systematic biodiversity surveys. As indirect observation methods increase the spatiotemporal scope of these point occurrence records, ecologists and conservation biologists will be better able to predict shifting species distributions, track changes to populations over time and understand the drivers of biodiversity occurrence.
The Necessity: We Have Fewer Data than We Think
With few exceptions, global point occurrence records have historically been generated by direct observation, where a human in the field records a personal, verified observation of an individual organism or its sign. The Global Biodiversity Information Facility (GBIF) database (GBIF 2019) is one major effort to collate such records from a variety of sources. As of the time of writing, this database has passed 1 billion occurrence records, the vast majority of which are sourced from citizen science efforts.
We would note, however, that these data are not as big as they are often perceived to be. For example, there were c. 92 million occurrence records added to the GBIF database for the year 2016. Presume, very generously, that none of these observations are overlapping in space. Assume further that each observation represents a human observing the organism in a 100-m2 area (e.g., a 10-m × 10-m box) for c. 15 minutes, a period during which the observer was present. Together, these 92 million observations would cover an effective area of 9200 km2 (Fig. 1(a)), which represents c. 0.002% of the Earth’s surface and 0.00000006% of the combined areas and times at which the planet could be observed. Each of those observations, of course, also describes only one of the perhaps hundreds or thousands of species that were in that area at the time of observation.
(a) The centre dot covers an area of 9200 km2, approximately the estimated total area of the planet covered by Global Biodiversity Information Facility (GBIF) observations in 2016. (b) Top panel: 10 000 point occurrence records for the continental United States, drawn from the GBIF database in 2016. Points are denoted by markers of a size commonly used in data visualization. These markers cover c. 16% of the continental United States. Bottom panel: Map showing 2.5 arc minute grid cells, with black cells containing an eBird observation in 2016; 28% of cells in the continental United States are coloured black.
In our experience, many ecologists are surprised at the limited scope of this coverage. We suspect that this surprise is driven by our collective habit of making the markers on maps of these observations much larger than the actual area covered by the observation (Fig. 1(b)).
Even limited data, of course, can be used as the basis for models that predict species presence or population sizes in unsampled areas. Such modelling would ideally be based on unbiased, representative observations drawn from all possible areas and times of observation. There is evidence, however, that existing point occurrence data are not representative of habitats in this manner (see Supplementary Table S1, available online). Additionally, there are many conservation applications that are better served by actual species observations, not modelled predictions. Our experience is that this desire for ‘hard data’ is most common in situations involving management and policy decisions, which often involve significant costs, and for questions involving relatively fine spatial scales, below the resolution at which many spatial models are believed to apply.
The Promise: An Explosion in Biodiversity Observations, Starting Today
Indirect, technology-mediated observation approaches, such as camera traps (Steenweg et al. Reference Steenweg, Hebblewhite, Kays, Ahumada, Fisher and Burton2017, Buxton et al. Reference Buxton, Lendrum, Crooks and Wittemyer2018), acoustic recorders (Towsey et al. Reference Towsey, Parsons and Sueur2014, Sugai et al. Reference Sugai, Silva, Ribeiro and Llusia2018) and satellite imagery (Marconi et al. Reference Marconi, Graves, Gong, Nia, Le Bras and Dorr2019), are rapidly becoming familiar to ecologists and conservation biologists. When combined with machine learning classification methods that can identify species in the images and recordings captured by these devices, these tools can produce the same type of point occurrence records that are generated by human observers.
The first enabler of indirect observation is inexpensive hardware. For example, there have been several efforts to develop extremely low-cost versions of acoustic field recorders, including the recently released AudioMoth (Hill et al. Reference Hill, Prince, Pinña Covarrubias, Doncaster, Snaddon and Rogers2018), which can be produced for less than US$50 (Fig. 2(a)). These devices can record audible frequencies for c. 150–200 hours in the field and, in our experience, produce results comparable to widely used commercial field recorders that cost US$850 or more. Interestingly, we note that no similarly inexpensive automated camera trap equipment has yet been widely adopted.
The potential scale of indirect data collection enabled by this inexpensive hardware dwarfs current direct observational methods. For example, in 2017, the North American Breeding Bird Survey (BBS) (USGS 2017), one of the largest systematic avian biodiversity surveys in the world, surveyed 2646 road transects in the USA, each with 50 stops and a 3-minute point count at each stop. This represented a total of c. 6600 hours of sampling effort. A set of 50 AudioMoth field recorders, purchased for less than US$2500, can equal this sampling effort with a single field deployment. While we are not suggesting that the temporal replication provided by such recorders can replace the extensive spatial replication of the BBS, we highlight that even small numbers of recorders can generate far more biodiversity observations than researchers are accustomed to using when making inference about biodiversity patterns.
The second enabler of these large-scale surveys is software, specifically pre-trained machine learning models that can extract species identities from sensor-recorded data. For many applications, such models already exist and are in general use. For example, for acoustic recordings, at least three automated bat classification software packages have been approved for Indiana bat surveys by the US Fish and Wildlife Service (USFWS 2019). Accurate automated bird classification from recordings has proven to be a more difficult problem (LifeCLEF 2019, Stowell et al. Reference Stowell, Wood, Pamuła, Stylianou and Glotin2019), particularly in diverse communities, although accuracy may be very high under some conditions (Priyadarshani et al. Reference Priyadarshani, Marsland and Castro2018). The commercial ARBIMON platform (Corrada Bravo et al. Reference Corrada Bravo, Álvarez Berríos and Aide2017) provides a user-friendly, cloud-based system that allows users to create such classification models. For photographs, the iNaturalist app (iNaturalist 2019) and a recently released Microsoft AI for Earth photograph classification service (Microsoft 2019) provide models that identify the species present in photographs (Fig. 2(b)). Methods specifically designed for automated photographs taken by camera traps are becoming available as well (Norouzzadeh et al. Reference Norouzzadeh, Nguyen, Kosmala, Swanson, Palmer, Packer and Clune2018). As such models continue to shift to the cloud, users will be able to process much larger volumes of data than they could previously on their own computers.
(a) Photograph of an AudioMoth, an inexpensive acoustic recording device. (b) Screenshot of the iNaturalist iOS app, demonstrating automated species classification from a photograph.
The Challenge: Drawing Conclusions from Uncertain Data
Despite the promise of technology-mediated indirect biodiversity observations, there are still several key challenges in gathering such observations. These include the costs of deploying large numbers of sensors, computational challenges surrounding the storage and processing of ‘big data’ and issues of survey design for large arrays of sensors. We wish to specifically highlight one subtler challenge, however, which we believe is substantially hindering progress: the need for better approaches for dealing with uncertainty in these indirect observations.
Machine learning classifiers often appear to be less accurate than well-trained human observers (although we note that, in practice, not all observers generating biodiversity data may be ‘well trained’). A potential advantage of automated classifiers over human observers, however, is that these classifiers are often able to provide quantitative estimates of the uncertainty in their identifications. Examples include non-binary predictions from a neural net, probabilities from a random forest or confusion matrices from model testing. In our experience, however, many ecologists and conservationist biologists are unsure how to draw conclusions from such uncertain data, particularly when uncertainties are high. For example, what should we conclude about the distribution or niche requirements of a species when, across 100 sampling points with varying habitat conditions, a classifier returns probabilities anywhere from 1% to 80% that a species was actually present?
A common approach is to choose a threshold (say, 50% or 75%) in order to convert these probabilities into binary outcomes. Probabilities below this threshold are either defined as an absence or as insufficient data. We do not find this approach satisfactory, as it effectively ignores or discards the information about the classification accuracy that the model has provided. When such uncertainty is ignored, our confidence about the drivers of a species’ presence or absence will generally be too high. When data are discarded due to low certainty, useful information about these drivers is effectively being thrown away.
We suggest that the correct approach is to use classifiers and statistical models that treat uncertainty more explicitly. First, machine learning classifiers must be specifically designed to return probabilistic, not binary, estimates of species occurrence in an image or recording. Second, statistical models must be designed to take this probabilistic classifier output as input data, instead of the more usual binary presence–absence data. The standard statistical models that are widely used in ecology and conservation, including generalized linear mixed models, generalized additive models and generalized estimating equations (Zuur et al. Reference Zuur, Ieno, Walker, Saveliev and Smith2009), are not designed for this type of input. There are several paths forward, including extending these existing frameworks using logic similar to weighted least squares or developing Bayesian hierarchical models that allow input data that are continuous probabilities rather than a binary observations. Ultimately, however, such practices will only be widely adopted by practitioners when accounting for classification uncertainty is no more difficult than the equivalent analysis that ignores uncertainty. Although new tools will need to be developed in order to make this type of analysis accessible, many of the conceptual and methodological pieces needed to create those tools already exist.
Summary
We believe that the fields of ecology and conservation biology are in the midst of a rapid and discipline-defining shift towards technology-mediated, indirect biodiversity observation. It is useful to remember that ecology and conservation biology are not the first fields to go through such a transition. Urban planners who review satellite imagery instead of walking city streets, astronomers who analyse data from automated sky surveys instead of looking through a telescope and sociologists who analyse online discussions instead of conducting interviews have all confronted many of the issues raised above and responded in part by opening up fundamentally new directions in their disciplines.
Finally, for those who remain sceptical of the value of indirect observations, it is also useful to remember that we can never predict the advances in methods that may occur in the future. Unlike humans in the field, automated sensors produce a permanent visual or acoustic record of a given location and time that is far richer than a simple note that ‘species X was here at time Y’. Similar to museum specimens, these records will undoubtedly be reanalysed by future generations of ecologists and conservation biologists using better tools than we have available now in order to extract information and answer questions that we cannot imagine today. And these future researchers will undoubtedly thank us, as we thank previous generations of naturalists, for having the foresight to collect as many observations as possible of the rapidly changing species and habitats on our planet.
Supplementary Material
For supplementary material accompanying this paper, visit https://multimediafluids.uam.elogim.com/core/journals/environmental-conservation
Author ORCIDs
Lauren Schricker, 0000-0001-6598-4459
Acknowledgements
We thank David Luther, Bill McShea, Nicholas Polunin and three anonymous reviewers for helpful comments on drafts of this manuscript.
Financial Support
This work was supported by the Department of Biological Sciences and the Mascaro Center for Sustainable Innovation at the University of Pittsburgh, as well as Microsoft and National Geographic under grant NGS-55651T-18.
Conflict of Interest
None.
Ethical Standards
None.