Introduction
Valid causal inference from observational data requires at least two critical conditions: (i) all confounders are measured and (ii) are appropriately adjusted for in the analyses. Approaches such as instrumental variablesReference Imbens and Angrist 1 and sensitivity analysesReference Lash, Fox and Fink 2 can sometimes be used to account for unmeasured confounders. However, instrumental variable analysis is not always possible because acceptable instrumental variables may not exist.Reference Martens, Pestman, de Boer, Belitser and Klungel 3 In this paper, we focus on the appropriate adjustment of measured confounders and do not consider issues such as unmeasured confounders, measurement error, or exposure or outcome mis-classification.
The classic confounding adjustment method is covariate-adjusted regression. However, an alternative class of methods is gaining increasing popularity.Reference Rubin 4 These methods use the propensity score (PS), the conditional probability of receiving the exposure of interest given confounders.Reference Rosenbaum and Rubin 5 The PS is effectively a summary score that incorporates information from multiple confounders in a single value. PSs address the ‘curse-of-dimensionality’Reference Robins and Ritov 6 : a large number of confounders relative to the number of observations. Moreover, PSs can help in assessing overlap in the covariate space.Reference Ho, Imai, King and Stuart 7 However, despite the increasing use of the PS-based methods and advanced methodological research in this area,Reference Glynn, Schneeweiss and Sturmer 8 – Reference Austin, Mamdani, Stukel, Anderson and Tu 12 understanding of how to correctly apply these methods and their potential impact is still limited.Reference Austin 13 , Reference Stuart 14
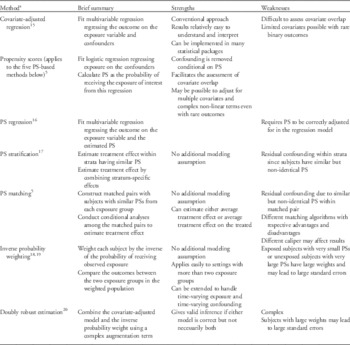
Our purpose is to explore six confounding adjustment methods: covariate-adjusted regression,Reference Casella and Berger 15 PS regression,Reference Kurth, Walker and Glynn 16 PS stratification,Reference Rosenbaum and Rubin 17 PS matching,Reference Rosenbaum and Rubin 5 inverse probability weighting,Reference Hernan, Brumback and Robins 18 , Reference Robins, Hernan and Brumback 19 and doubly robust estimation.Reference Bang and Robins 20 These are described succinctly in Table 1. Other than covariate-adjusted regression, all of these methods use PSs to adjust for confounding. To demonstrate the potential effects of adjustment, we compare results from two early life exposures that we and others have reported are associated with childhood obesity: breastfeeding statusReference van Rossem, Taveras and Gillman 21 – Reference Gillman 24 and delivery type.Reference Huh, Rifas-Shiman and Zera 25 , Reference Li, Zhou and Liu 26 In both cases, randomized trials are at best impractical, though it may be possible to use data from related trials to gain insight.Reference Kramer, Chalmers and Hodnett 27 Using these two examples, we review the strengths and weaknesses of the six confounding adjustment methods, use PSs to ensure overlap in the covariate space, examine the impact of choices made during implementation, discuss lessons learned from implementing them and identify knowledge gaps.
Comparisons of the six confounding adjustment methods

PS, propensity score.
a All methods are subject to bias if covariate overlap is not present. All methods require correct specification of models. For regression, this is the relationship between the confounders and the outcome. For PS, this is the relationship between the confounders and the exposure. The exception is doubly robust estimation, for which one of these may be incorrect.
In this paper, we implement the six methods to adjust for baseline confounding. We do not intend to infer causality in either application example for the following two reasons. First, the assumption of no unmeasured confounders is debatable. Second, breastfeeding during the first 6 months of life is not a one-time decision.Reference Gillman 24 , Reference Kramer, Moodie, Dahhou and Platt 28 During that period, mothers who breastfed likely considered multiple times whether to continue breastfeeding and made the decisions based on multiple factors that themselves changed over time. Some of these factors may well affect the childhood obesity outcome. To reduce difficult methodological issues raised by these relationships, we restricted our analyses to those who either exclusively breastfed or used formula only during the first 6 months of life.
We use a continuous outcome for illustration purposes, but these methods can be applied to other types of outcomes such as binary outcomes. In fact, with binary outcomes, the PS-based approaches have more advantages over the covariate-adjusted regression approach because it is more challenging to impose a correct covariate-adjusted regression model for binary outcomes when the outcome is rare and the number of covariates is large relative to sample size.
Methods
We begin by describing methods for covariate adjustment in more detail, then describe the two application examples.
Confounding adjustment methods
Covariate-adjusted regression
In covariate-adjusted linear regression, the outcome is regressed on the exposure variable and covariates. The validity of results depends on the correct specification of the regression model, meaning that all covariates, interactions and quadratic, logarithmic, etc. functions affecting the exposure-outcome relationship are included. If these conditions are met, the parameter associated with the exposure is the difference in the outcome due to adding the exposure to any set of fixed values of the other covariates.
PSs
The PS is defined as the individual probability of receiving the exposure of interest.Reference Rosenbaum and Rubin 5 PSs are typically estimated with a logistic regression model that regresses the exposure variable on observed confounders; PSs thus replace all of the confounders with a single value. In addition, PSs facilitate a requirement for valid covariate adjustment: overlapping covariate values, or ‘common support,’ across the exposure groups. Common support is required to prevent extrapolation beyond the range of the data. Covariate overlap is absent, for example, when the exposure of interest group includes subjects aged 45–65 years but the control group is limited to those aged 45–55 years. It can be challenging or tedious to detect poor covariate overlap when the ranges overlap, but the distribution in the two exposure groups differs substantially. For example, both groups might have ages between 45 and 65, but the exposed group might be 95% over age 55 and the unexposed 95% below age 55. It is quite difficult to detect this kind of differential distribution multidimesionally across a large set of covariates. However, it is relatively simple, as demonstrated below, to assess overlap using the PS.
After assessing overlap, PSs can be used to adjust for confounding in several ways: via regression, stratification, weighting, matching. The validity of each of these methods depends on a common assumption that the PS model is correctly specified, in the same sense as in the covariate-adjusted regression. The goodness-of-fit of the PS model can be assessed by comparing the distributions of the observed confounders between the exposure groups after adjusting for the estimated PSs.Reference Rosenbaum and Rubin 17 The confounders should be distributed similarly between the exposure groups after adjustment. As confounding can only affect inference if the confounders are unequally distributed between the exposure groups, valid causal inference is possible once this similarity is achieved.
Common-support regression
Common-support regression is simply covariate-adjusted regression conducted among the subset of patients within the common support. Common-support regression is generally preferred over covariate-adjusted regression as it avoids extrapolation into regions where one or the other exposure group provides little data.
PS regression
In PS regression, we regress the outcome on the exposure and the PS only. Conditional on the PS, exposure cannot be a result of confounding, so the exposure effect is un-confounded. However, analogous to covariate adjustment, the results might be biased if we do not adjust for PS appropriately in the regression model, for example, if a required quadratic function of the PS is omitted.Reference Kurth, Walker and Glynn 16
PS stratification
In PS stratification,Reference Rosenbaum and Rubin 17 the study population is classified into strata with similar PSs. The exposure effect is estimated within each stratum and the exposure effects in each stratum are then pooled to obtain the population-wide average exposure effect. This approach does not require the additional modeling assumptions that PS regression does, but the results might be slightly biased because the PSs within strata are similar but not identical. Therefore, it is recommended to use more than five strata when sample size allows.Reference Lunceford and Davidian 29
PS matching
PS matching avoids some potential issues in simpler approaches but is more complex in theory and application. In PS matching, each exposed and/or unexposed subject is matched with at least one ‘control’ from the other exposure group with the same PS. If a matched control is found only for each exposed subject, we are estimating the average exposure effect among the treated,Reference Imbens 30 which sometimes is the preferred parameter of interest, but may be a biased estimate of the exposure effect in the population at large.Reference Imbens 30 Matching each exposed and non-exposed case ensures that the estimate is unbiased for the effect of exposure in the population at large.
Exact matching is typically infeasible, however, so in practice matches are required to have only similar PSs. We refer to the maximum allowable difference in PSs for a matched pair as the ‘caliper.’Reference Austin 10 Common choices of caliper include an absolute value of 0.05Reference Kurth, Walker and Glynn 16 or 0.2 standard deviations of the logits of PS, that is, of the log(PS/(1−PS)).Reference Austin 10 Subjects without eligible matches, that is, no control with a PS within the caliper, are excluded from subsequent analyses. Conditional regressionReference Casella and Berger 15 analyses are conducted among the matched pairs, to account for matching.
Matching can be done ‘with’ or ‘without replacement’Reference Ho, Imai, King and Stuart 7 , Reference Dehejia and Wahba 31 ; with replacement means that, for example, a non-exposed subject may be the control for more than one exposed subject, and some subjects will likely be included in the analysis more than once. Matching with replacement reduces bias and thus is recommended, although a special variance estimator is required to appropriately account for the correlation due to duplication.Reference Abadie and Imbens 32
In the sense that each PS-matched pair comprises two people with approximately equal probabilities of exposure, and one is in each exposure group, PS matching mimics randomization. Like stratification, PS matching does not require modeling the PS-outcome relationship. Residual confounding due to imperfect matching remains a concern for the validity of PS matching results.
Inverse probability weighting
In inverse probability weighting,Reference Hernan, Brumback and Robins 18 , Reference Robins, Hernan and Brumback 19 each subject is weighted by the inverse of the probability of being assigned to their actual exposure group: 1/PS for exposed subjects and 1/(1−PS) for unexposed subjects. Confounding is removed in the resulting weighted ‘pseudo-population’ (7,8) so that linear regression applied to the pseudo-population estimates the un-confounded exposure effect.
The inverse probability weighting approach does not require modeling the PS-outcome relationship. In using the exact PS value, it avoids the risks of residual confounding within strata and imprecise matches. Moreover, it can be used without further modification in settings with multiple exposure groups. However, the standard error of the treatment effect may be large, due to large weights for subjects with PSs close to 0 or 1. Truncating weights or excluding subjects with extremely large weights may partially address this issue but could diminish the advantages described above and lead to estimating a different quantity than the one of interest.Reference Kurth, Walker and Glynn 16 , Reference Hernan and Cole 33
Doubly robust estimation
Doubly robust estimation combines the PS and covariate adjustment. In covariate-adjusted regression, the association between covariates and outcome needs to be accurately modeled; in the PS-based analyses described above, the logistic regression predicting the exposure needs to be correctly modeled. Doubly robust estimation is valid if either model is correct but not necessarily both.Reference Bang and Robins 20 The original doubly robust approach, which was proposed in Bang et al.,Reference Bang and Robins 20 functions by adding to the inverse probability weighting estimator an augmentation term, which depends on the predicted outcome from the multivariable regression model and the PSs. This term converges to zero when the PS is correct, but offsets the bias of the inverse probability weighting estimator when the PS is wrong and the outcome regression function is correct. This is a complex procedure. Interested readers are referred to Bang et al.,Reference Bang and Robins 20 for technical details. A SAS macro is available to implement this method.Reference Funk, Westreich, Davidian and Weisen 34
Table 1 summarizes each of the six methods and their strengths and weaknesses. Please refer to the online supplementary material for more details on the implementation of the six methods.
Application examples
We apply the forgoing methods to assess the associations of breastfeeding and cesarean section with body mass index (BMI) at age 3.
Study population
Study subjects were participants in Project Viva, a prospective observational cohort study of pre- and perinatal factors and maternal and child health.Reference Gillman, Rich-Edwards and Rifas-Shiman 35 Details of recruitment and retention procedures are available elsewhere.Reference Gillman, Rich-Edwards and Rifas-Shiman 35
We have previously published on the association of both breastfeeding (16) and cesarean section (17) with 3-year BMI z-score in Project Viva.
Outcome
At the 3-year Project Viva visit, we measured each child’s height with a research-standard stadiometer (Shorr Productions, Olney, Maryland, USA), and weight with a digital scale (Seca model 881, Seca Corporation, Hanover, Maryland, USA). We calculated BMI as weight in kg/(height in m)Reference Lash, Fox and Fink 2 . The outcome of interest was the age- and sex-specific BMI z-score at the participant’s 3-year visit, calculated using US national reference data.Reference Kuczmarski, Ogden and Grummer-Strawn 36
Exposure variables
Breastfeeding during the first 6 months of life was assessed by interviews at 6 months or 1 year postpartum.Reference van Rossem, Taveras and Gillman 21 We restricted our analyses to two subgroups: ‘exclusive breastfeeding’ (infants whose only liquid energy source was breast milk during the first 6 months of life), and ‘formula only’ (only formula during the first 6 months). Cesarean section v. vaginal delivery was derived from hospital medical records.
Covariates
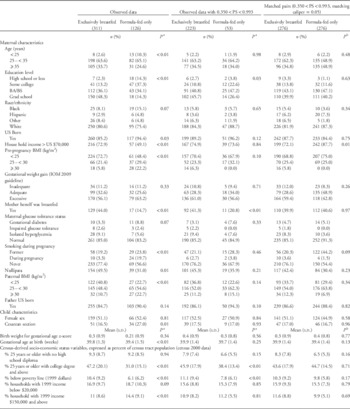
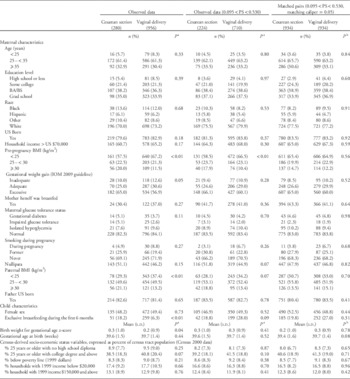
In Tables 2 and 3, we list the potential confounders considered in the covariate-adjusted regression analyses in the original publications;Reference van Rossem, Taveras and Gillman 21 , Reference Huh, Rifas-Shiman and Zera 25 not all were included in the final published models. These are all baseline covariates measured before either exposure.
Breastfeeding in first 6 months of life (exclusively breastfed v. formula-fed only)

PS, propensity score.
Characteristics among all subjects, among subjects with PS in (0.350, 0.993), and among matched pairs (data from Project Viva).
a P-value from χ 2-test or t-test.
b P-value from generalized score tests for Type III contrasts from PROC GENMOD to adjust for repeated use of the same subjects since matching was done with replacement.
Delivery mode (cesarean section v. vaginal delivery)

PS, propensity score.
Characteristics among all subjects, among subjects with PS in (0.095, 0.530), and among matched pairs (data from Project Viva).
a P-value from χ 2-test or t-test.
b P-value from generalized score tests for Type III contrasts from PROC GENMOD to adjust for repeated use of the same subjects since matching was done with replacement.
Statistical analyses
For both the breastfeeding and cesarean section examples, we implemented: (1) crude (univariate) regression; (2) covariate-adjusted regression using the covariates included in the final published models; and (3) covariate-adjusted regression with the larger set of covariates in Tables 2 and 3.
We fitted logistic regression models to estimate PSs, adjusting for the covariates listed in Tables 2 and 3. Variable selection in PS modeling is an important topic. We do not tackle this issue here. Project Viva collected a much larger set of covariates than those listed in Tables 2 and 3. In this paper, we only consider the subset of covariates that were selected by subject matter experts as potential confounders. Covariate balance was assessed using the F-test after PS stratification with quintiles.Reference Rosenbaum and Rubin 17
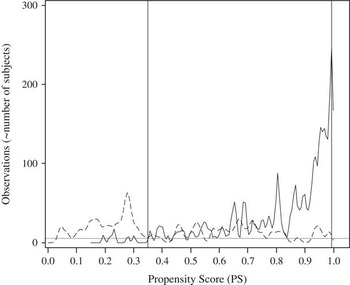
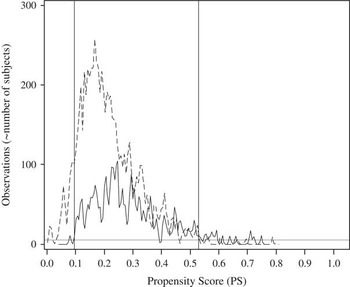
Theoretical guidance on determining the common support is not available, and we determined the common support region on an ad-hoc basis. We plotted smoothed histograms of the PSs within each group, based on kernel density estimates. These plots (Figs 1 and 2) show values of the PS for which each exposure group has at least a few observations, and we defined common support as the range of PS over which there are generally at least five observations in each exposure group.
Breastfeeding in first 6 months of life (exclusively breastfed v. formula-fed only): PS kernel density estimates and common support. The solid (exclusive breastfeeding) and dotted (exclusive formula) curves indicate the within-group smoothed histograms for the PSs, based on kernel density estimates. The gray horizontal line indicates a reference at five observations. The vertical lines indicate the common support, which we define as the interval on which the within-group kernel density estimates are mostly five or above. Here is the observed common support (0.350, 0.993).

Delivery mode (cesarean section v. vaginal delivery): PS kernel density estimates and common support. The solid (C-section) and dotted (vaginal birth) curves indicate the within-group smoothed histograms for the PSs, based on kernel density estimates. The gray horizontal line indicates a reference at five observations. The vertical lines indicate the common support, which we define as the interval on which the within-group kernel density estimates are mostly 5 or above. Here the observed common support is (0.095, 0.530).

We implemented the three regression adjustment methods listed above and PS regression with and without considering the PS-based common support to directly assess the impact of limiting covariates to the region of common support. Observations outside the common support were excluded from other analyses.
In PS regression, we regressed the outcome on the exposure variable and the PS. Adding polynomial terms for the PS up to the fifth order had little impact on the estimated exposure effect and variance; we report the model with linear adjustment only. For PS stratification, we used quintiles instead of higher-order quantiles due to relatively small numbers of formula-only babies and cesarean section births. In PS matching, we used two caliper values, 0.05 and 0.01. Each exposed and unexposed subject was matched to a subject in the other group, if one existed within the caliper. We used matching with replacement and accounted for this using the conservative Abadie–Imbens variance estimator.Reference Abadie and Imbens 32 In the breastfeeding example, we found some subjects with large weights in the inverse probability weighting and doubly robust approaches, and additionally recalculated the estimates from these two methods with PSs truncated at 0.95; truncation near 0 was unnecessary because subjects with small values had already been removed because of a lack of common support. Truncation in the cesarean section example was unnecessary after removing subjects lacking common support. In doubly robust estimation, we considered two multivariable regression models with one including all covariates and the other including published covariates only. All analyses were done in SAS 9.3 (SAS Institute, Cary, NC, USA) except PS matching, which was implemented using the R package ‘Matching’ (R 2.15.2).Reference Sekhon 37
Results
For breastfeeding, there were 437 subjects in the univariate analyses; 412 had complete data on relevant variables and were included in the covariate-adjusted regression with published covariates. Sample size further decreased to 354 in the regression with a larger set of covariates. For cesarean section, the corresponding sample sizes were 1236, 1229 and 1019.
For the PS analyses, we first examined the PS overlap to determine the common support, illustrated in Figs 1 and 2. For breastfeeding, the common support region was (0.350, 0.993), that is, subjects with PSs ⩽0.35 or ⩾0.993 were excluded from further analyses. For cesarean section, the common support was (0.095, 0.530). In eTable 1 in the supplementary material, we present the descriptive statistics among those that were within the common support v. those that were outside the common support.
In Tables 2 and 3, we present the descriptive statistics for the two examples, respectively. For each example, we present the statistics among the entire study population, among those within the common support region, and among the matched pairs constructed in the common support with a caliper of 0.05. Subjects outside the support were younger, less educated, more likely to be non-white, less wealthy, heavier, to have smoked during pregnancy. Because of a poorer PS overlap in the breastfeeding example than in the cesarean section example, a larger proportion of subjects fell outside the common support and thus were excluded. It appears that covariate balance was improved by restricting to subjects within the common support region and further improved by PS matching.
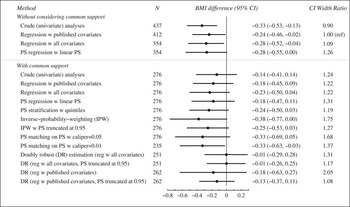
In the breastfeeding example, all analyses yielded qualitatively similar results, with the exception of the doubly robust method with all covariates. In addition, the doubly robust method was sensitive to the choice of covariates in that all covariates resulted in very different estimates compared with published covariates. In contrast, in multivariable regression, the other method that uses multivariable outcome regression, this choice did not materially affect the results.
Inverse probability weighting, PS matching with a caliper of 0.05, and doubly robust estimation with published covariates yielded notably wider CIs than the other methods. The greater standard errors for the inverse probability weighting method were likely driven by the few formula-only babies whose PSs were close to 1 and whose weights were thus large. PS truncation at 0.95 helped to reduce the standard error. For PS matching, the selection of caliper affected CI width. The CI width was, surprisingly, narrower with a smaller caliper, despite a smaller sample size. A similar result was seen for the doubly robust estimation (Fig. 3).
Breastfeeding in first 6 months of life (exclusively breastfed v. formula-fed only): difference in 3-year body mass index (BMI) z-score. The last column indicates the ratio of each CI width to the CI width from the covariate-adjusted regression with published covariates approach.

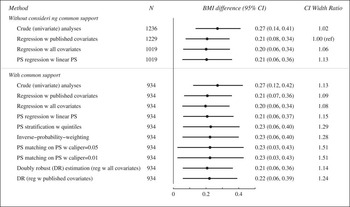
For cesarean section, the estimated difference in BMI between cesarian and vaginally delivered children was remarkably consistent across adjusted methods, and the widths of the CIs differed less than in the breastfeeding example (Fig. 4). The caliper choice had little impact. The CIs from PS matching were the widest, likely due to the conservative variance estimate.Reference Abadie and Imbens 32
Delivery mode (cesarean section v. vaginal delivery): difference in 3-year body mass index (BMI) z-score. The last column indicates the ratio of each CI width divided by the CI width from the covariate-adjusted regression with published covariates approach.

Discussion
We implemented several confounding adjustment methods to examine the associations of exclusive breastfeeding and cesarean section with 3-year BMI z-score: naïve covariate-adjusted regression, covariate-adjusted regression among all study subjects and among those within the common support, PS regression, PS stratification, PS matching, inverse probability weighting and doubly robust estimation. Each of the six methods has its own advantages and disadvantages and none is uniformly superior to others. Analysts need to select the method(s) that suit their data setting and pay close attention to the implementation caveats we illustrated in this paper via the two empirical examples.
One important observation is that accounting for covariate overlap can have a substantial impact, even on results from multivariable regression. In the breastfeeding example, restricting the sample to those within common support attenuated the point estimate from multivariable regression by 18%, from −0.28 to −0.23. In the cesarean section example, point estimates and CIs were more similar, presumably because the proportion of overlap was greater. In addition, the definition of the common support region may affect the results from all methods. The breastfeeding effect estimate and CI both varied widely with various definitions of the common support region (data not shown). The impact is likely to be bigger when the sample size is relatively small and PS overlap is relatively poor.
Second, inverse probability weighting and doubly robust estimation may have large standard errors. Truncating PS at a minimum value, for example, 0.05, and a maximum value, for example, 0.95 may partially address this problem, but it may introduce bias. For breastfeeding, the CI width for inverse probability weighting and doubly robust estimation with multivariable regression with published covariates decreased by 35% (from 0.77 to 0.50) and 47% (from 0.90 to 0.48), respectively, after PSs were truncated at 0.95. For cesarean section, PSs were bounded away from 0 and 1 and thus the weights were not large in either exposure group. The other methods do not use these weights and thus are not subject to this issue.
Third, the selection of caliper is important for PS matching. For breastfeeding, the point estimate remained the same when the caliper decreased from 0.05 to 0.01, but the 95% CI width decreased by 19% (from 0.74 to 0.60). We do not recommend drawing conclusions based on an arbitrary criterion of whether the 95% CI includes or excludes the null value. However, it is worth noting that if such an arbitrary criterion was used, different inference would have been obtained depending on which caliper was used.
Fourth, the doubly robust method in theory should result in estimates similar to either the covariate-adjusted regression or inverse probability weighting. In this example, however, the finite-sample performance of this method in the breastfeeding example is inconsistent with its large sample, theoretical property. Thus, the corresponding results should not be used to derive inference in this case. The failure of the doubly robust method here could be due to the small sample size, particularly the small number of formula-fed babies, and relatively poor overlap between the two exposure groups.
The six methods considered in this paper all assume there is no unmeasured confounding. The focus of this paper is on how to appropriately adjust for measured covariates. If residual confounding bias is a concern, there exist multiple sensitivity analyses methodsReference Rosenbaum 38 – Reference Shen, Li, Li and Were 42 that extend these confounding adjustment methods to assess how the results may vary as the amount of residual confounding bias exists. This is beyond the scope of this paper.
In summary, we compared several of the many existing confounding adjustment methods. For cesarean section, both the point and interval estimates were remarkably robust to method selection and implementation. This finding brings reassurance but does not guarantee the accuracy or precision of the estimated mean difference. The results for breastfeeding were less similar across analyses. However, apart from doubly robust estimation, all other analyses yielded qualitatively similar results.
We recommend assessing covariate overlap and limiting covariates to the region of common support no matter which confounding adjustment method is used. In addition, we recommend conducting analyses with multiple methods and varying implementation factors to help identify potential issues. One particular method can be pre-specified as the primary analysis and others viewed as sensitivity analyses. Consistency or inconsistency among the results should be assessed by point and interval estimates, not by whether P-values were above or below the 0.05 cut-off. More work is needed to guide implementation of each method, including how to select the common support; whether and how to truncate PS weights; and how to select the PS matching caliper.
Acknowledgment
The authors thank Sheryl Rifas for data preparation and help with familiarizing them with the data sets.
Financial Support
This work was supported by the National Heart, Lung, and Blood Institute [1P30HL101312 to Gillman MW].
Conflicts of Interest
None.
Supplementary material
To view supplementary material for this article, please visit http://dx.doi.org/10.1017/S2040174414000415