I. INTRODUCTION
Over the past 100 years, x-ray and neutron diffraction techniques have become powerful tools for material characterization. X-ray and neutron sources, optics, and detector technologies have advanced throughout the years, providing even greater insight into the crystallographic structure of materials. In materials science, in situ diffraction measurements provide valuable structural information of structure–property relationships, changes in structure with applied stimuli, and the application of this information to material processing. The importance of understanding the structure of a material and its response to a stimulus is vital to discover, produce, and understand the next generation of materials. Because the properties of ferroelectric materials are strongly dependent upon their structures, advances in the realm of in situ diffraction studies have been particularly useful to researchers in the field of ferroelectrics, e.g., enabling the distinction of subtle structural differences between different polymorphic structures, observing and quantifying the behavior of ferroelectric domains under applied electric field stimulus, and determining the characteristics of phase transitions with temperature and pressure.
X-ray and neutron diffraction are similar techniques and provide complementary information about a material, but differ in their scattering properties. X-rays interact with the electron cloud of an atom, therefore their scattering power is a function of the atomic number, and decreases in intensity at higher 2θ angles. X-ray tube sources are readily available in most university and industry laboratories, making x-ray diffraction (XRD) a common and useful approach in material characterization. Neutron diffraction offers some advantages over XRD for use in in situ studies of ferroelectrics. The scattering power of neutrons is not a function of the atomic number, since neutrons scatter from the nuclei instead of the electron cloud as seen in x-rays. As a result, neutron scattering can be sensitive to lighter elements, such as oxygen, in the presence of heavier elements.Reference Yashima1 When studying complex oxides that are ferroelectric, there is often sufficient scattering length contrast between oxygen and other atoms in the material. This can provide more accurate information about oxygen atom positions when compared to x-rays. However, neutron diffraction has a few shortcomings when compared to XRD that include requiring a large sample, having a lower availability of neutron sources than x-ray sources, and a lower flux relative to photons. The latter makes time-resolved measurements difficult if not performed at spallation sources.Reference Eckold, Schober and Nagler2
Before discussing ferroelectrics it is necessary to introduce piezoelectricity, an important property of ferroelectric materials. All ferroelectric materials are piezoelectric, but not all piezoelectric materials are ferroelectric. Piezoelectricity is characterized by an ability to induce a polarization in a crystal using an applied force. The existence of the piezoelectric effect requires a noncentrosymmetric crystal structure. The piezoelectric effect can be measured and utilized in two ways: the direct effect, Eq. (1), and the converse effect, Eq. (2). The direct effect involves the application of a stress to produce a polarization, as shown in Eq. (1);
 $${P_i} = {d_{ijk}}{\sigma _{jk}}\quad ,$$
where P i is the polarization, d ijk is the 3rd rank piezoelectric tensor, and σjk is the applied stress. The converse effect involves the application of an electric field to produce a strain in the material and is represented by Eq. (2);
 $${\varepsilon _{jk}} = {d_{ijk}}{E_i}\quad ,$$
where εɛjk is the strain, E i is the electric field, d ijk is the piezoelectric tensor, and i, j, k are integer indices ranging from 1 to 3. The piezoelectric tensors in Eqs. (1) and (2) are equivalent and the tensor components are of equal value. In general, a third rank tensor has 33 tensor components, but because stress is symmetric (σij = σji), the number of independent tensor decreases to 18 and can be represented in a 3 × 6 matrix. This matrix notation is a common method through which to report piezoelectric coefficients; the converse piezoelectric effect in this form is given by Eq. (3):
 $${\varepsilon _m} = {d_{im}}{E_i}\quad .$$
In this equation the subscript “m” substitutes for indices “jk” in Eq. (2) and the following holds true for indices m and i; (m = 1, 2, …, 6) and (i = 1, 2, 3). The piezoelectric tensor of a poled piezoelectric ceramic (∞m symmetry) reduces to three independent coefficients (d 31 = d 32, d 33, d 24 = d 15) from the 18 tensor components discussed previously. For a more in-depth description, the reader can refer to Ref. Reference Nye3.
A subset of noncentrosymmetric crystallographic structures, polar structures, have a spontaneous polarization (P s) due to the separation of positive and negative centers of charge. This charge separation arises from cation and anion displacements from their more symmetric (centrosymmetric) positions.Reference Cohen4 The direction of P s is determined by the crystallographic structure. For example, tetragonal perovskite ferroelectrics are spontaneously polarized in the [001] whereas rhombohedral perovskite ferroelectrics are spontaneously polarized in the [111]. Ferroelectricity is defined as a spontaneous polarization that can be inverted by applying an electric field of sufficient amplitude. The amplitude at which polarization is reoriented is called the coercive field (E c). Regions of a material with local polarization directions that are parallel are known as domains and these domains are separated by domain walls. The types of domain walls that exist depend on the crystallographic symmetry of the material. In tetragonal perovskite ferroelectrics, there are two types of domain walls, 180° and 90°, which separate domains with crystal orientations that vary by a 180° and 90° orientation relationship, respectively.
The electromechanical coupling is related to the extent of electrical energy converted into mechanical energy, or vice versa (mechanical into electrical energy). Specifically in ferroelectric materials, the electromechanical coupling is driven by the two main types of contributions: intrinsic piezoelectric effect [Eq. (2)], and extrinsic effects, e.g., domain wall motion. The motion of domain walls can be categorized as either 180° ferroelectric domain wall motion or non-180° (e.g., 90°) ferroelectric/ferroelastic domain wall motion. Both effects give rise to macroscopic electromechanical coupling and polarization.Reference Fang, Li, Liu, Zhang, Hong and Guo5,Reference Ambika6 Ferroelectric domain wall motion is predominantly an irreversible effect wherein the displacement does not return to the original position upon release of the electric field.
As ferroelectric materials undergo phase transitions with composition or temperature, the nature of the transitions can be categorized as morphotropic phase boundaries (MPBs) and polymorphic phase transitions (PPTs). On the phase diagram, these transitions separate stability regions of different polymorphic phases. The term “morphotropic” in MPB refers to phase transitions that occur due to a change in composition.Reference Goldschmidt7 In compositions approaching phase boundaries, dielectric and piezoelectric properties become enhanced and reach a maximum at or near the boundary.Reference Jaffe8,Reference Jaffe and Cook9 Using diffraction in these regions, it is very easy to mistake a higher-symmetry phase as a lower symmetry phase because of two reasons: (1) multiple phases can coexist in this region, and (2) the instrument resolution is often too poor for resolving subtle structural distortions. It is also easy to mistake a lower-symmetry phase as a higher-symmetry phase due to the hierarchical structures found in many ferroelectric materials.Reference Keeble, Barney, Keen, Tucker, Kreisel and Thomas10–Reference Levin and Reaney14 Phase boundaries are also of particular interest because electrical- or mechanical-induced phase transitions can occur in close proximity to these boundaries.
In this study, we review application of routine and advanced in situ x-ray and neutron diffraction techniques applied to polycrystalline ferroelectrics. We highlight key capabilities and insight that have been derived using in situ x-ray and neutron diffraction to motivate readers to undertake new and useful experiments. The remaining sections of this study are divided into the following: identification of structure and phase transitions, whole pattern fitting for structural refinement, diffraction during application of electric fields, stress-induced phase transitions and domain reorientation, diffraction during synthesis, total scattering and PDF analysis, and XRD based three-dimensional microscopy.
II. IDENTIFICATION OF STRUCTURE AND PHASE TRANSITIONS
Every unique crystallographic structure yields a unique theoretical x-ray and neutron diffraction pattern. Therefore, the x-ray and neutron diffraction patterns can be used to identify crystallographic structures and phases. To aid in the identification process, crystallographic databases can match the measured Bragg peak positions and intensities to the theoretical values of innumerous phases, yielding an identification of the most probable phases. The most common database in use today is the Powder Diffraction FileTM (PDF) which is maintained and updated by the International Centre for Diffraction Data (ICDD®). In a pattern that is confidently identified at room temperature, it is then possible to determine when peaks appear or disappear in response to a stimulus, one of the simplest forms of identifying a phase transition.
Line profile analysis, or the use of profile shape functions to fit measured diffraction profiles, can be performed to gain further insight of the material response to an applied stimulus. Single peaks can be modeled by profile shape functions (Gaussian, Lorentzian, Pearson VII, or Pseudo-Voigt) to extract peak position, full width at half maximum (FWHM), and intensity as well as their changes to an applied stimulus. This information can then be used to calculate unit cell dimensions, crystallite size using Scherrer's equation,Reference Dinnebier and Billinge15 and preferred orientation; examples can be found in Refs. Reference Kocks, Tomé and Wenk16–Reference Zhou, Obi, Nan, Beguhn, Lou, Yang, Gao, Li, Rand, Lin, Sun, Esteves, Nittala, Jones, Mahalingam, Liu and Brown25. Line profile analysis can be applied to diffraction data from in situ measurements during application of temperature, pressure, stress, and electric fields to detect and characterize both subtle and significant changes. Some of the most obvious changes observed can be the appearance or disappearance of diffraction peaks, which are often related to phase transitions. Line profile analysis is particularly useful when the profile shapes or the combination of peaks cannot be adequately modeled in a full profile refinement such as that used in Rietveld refinements (see Sec. III). In ferroelectric materials, in particular, profiles containing degenerate reflections (e.g., the (002) and (200) in tetragonal perovskite ferroelectrics) have significant diffuse scattering between the reflections due to scattering from ferroelastic domain walls,Reference Daniels, Jones and Finlayson26 an effect for which Rietveld refinement software packages do not yet have appropriately incorporated models.
A. Temperature
The crystallographic structures of ferroelectric materials are strongly dependent upon temperature. It is necessary to understand the structure of the polymorphs because the properties strongly depend on structure. For example, barium titanate, BaTiO3 (BT), has four different polymorphs (rhombohedral, orthorhombic, tetragonal, and cubic) in a temperature range of −100 to 150 °C. The highest relative permittivity is associated with a tetragonal polymorph and near the transition to the cubic phase.Reference Jaffe and Cook9
The changes in lattice parameter as a function of temperature are commonly studied using diffraction. As temperature is varied, lattice planes within a unit cell are displaced and there is a corresponding positional shift of the Bragg peaks. The changes in peak position directly correlate with changes in the lattice parameter. For some (hkl) planes such as the (001), the d-spacing is directly related to a single unit cell parameter. From individual or multiple peak positions, all unit cell parameters can be calculated.Reference Cullity and Stock27 The resulting unit cell parameters can then be used to calculate the volume and spontaneous strain. Volume can be used to obtain the average thermal expansion, as done in very early work by UedaReference Ueda and Shirane28 on PbZrO3. Similarly, a strong inflection in the lattice parameters, when plotted as a function of a stimulus, can also indicate a phase transition.
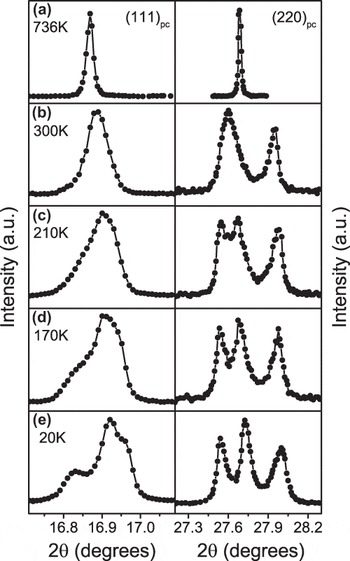
One of the most recent influential reports of the temperature dependence of structure in ferroelectrics is the work by Noheda et al.Reference Noheda, Cox, Shirane, Gonzalo, Cross and Park29 in which the first structural evidence for a monoclinic phase in PbZrxT1–xO3 (PZT) was reported at low temperatures. PZT near the MPB (PbZr0.52Ti0.48O3) powders was studied using high-resolution synchrotron XRD and the changes in the diffraction peaks of the (111) and (220) were observed. Figure 1(a) shows that the structure is cubic at 736 K; as temperature decreases, the emergence of new peaks indicates the existence of a lower symmetry phase. At ∼660 K, the symmetry changes to tetragonal as seen by the clear splitting of the (220) and remains tetragonal down to 300 K. As temperature is further decreased, Fig. 1(c) shows the (111) and (202) peaks broaden, a lower angle shoulder begins to appear on the (111), and the (202) is clearly split into two peaks of roughly equal amplitude. At 20 K [Fig. 2(e)], the (202) is well resolved into two peaks, and the (111) consists of a triplet with one strong peak in the middle and two weaker peaks on the low and high angle sides. The phase was later determined to correspond to the space group Cm by Noheda et al.Reference Noheda, Gonzalo, Cross, Guo, Park, Cox and Shirane30Cm is a subgroup of P4mm and R3m and allows the polar axis to lie anywhere between the [001] and [111]. Cm thereby provides a continuous polarization rotation pathway between P4mm and R3m and conveniently would explain some of the high properties near the MPB. However, nanodomains were more recently shown to give rise to diffraction patterns that can resemble the Cm phase,Reference Wang11 an adaptive phase phenomena. This observation re-opened debate about the true structure of PZT near the MPB. New phase diagrams have since been proposed, e.g., Ref. Reference Zhang, Yokota, Glazer and Thomas31 and some review studies exist.Reference Woodward, Knudsen and Reaney32,Reference Noheda and Cox33 Diffraction from single crystals of PZT, e.g., Ref. Reference Gorfman, Keeble, Glazer, Long, Xie, Ye, Collins and Thomas34 may help to clarify these structures in the future, though should be interpreted with measurements from other techniques including powder diffraction and microscopy.
Evolution of the (111) and (220) pseudo-cubic reflections in PbZr0.52Ti0.48O3. Redrawn from Ref. Reference Noheda, Cox, Shirane, Gonzalo, Cross and Park29.

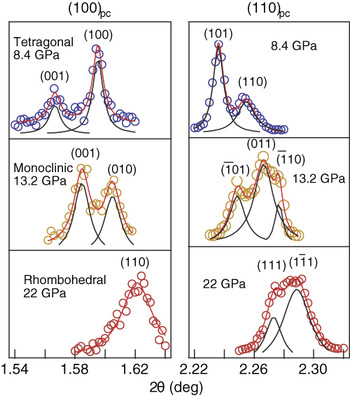
High-resolution, angle-dispersive XRD patterns at selected pressures and 10 K. Reprinted with permission from Macmillan Publishers Ltd: Nature,Reference Ahart, Somayazulu, Cohen, Ganesh, Dera, Mao, Hemley, Ren, Liermann and Wu40 Copyright (2008).

B. Pressure
Pressure-induced phase transitions are prevalent in ferroelectrics. The structure under pressure can be studied using a diamond anvil cell. In such an experiment, the incident x-ray beam passes through a diamond before reaching the sample and must pass through the opposing diamond after diffracting from the sample. The material of interest in these experiments is mixed with an internal standard such as ruby chips, gold, platinum, or tungsten to perform pressure and/or temperature calibration.Reference Katrusiak35 Diamond anvil experiments are typically performed at a synchrotron source because the diamond anvil cells only allow diffraction in a limited angular range.Reference Katrusiak35–Reference Anzellini, Dewaele, Mezouar, Loubeyre and Morard38 Synchrotron sources can enable higher energies than that available in x-ray tube sources, allowing many Bragg peaks to be measured in a limited angular range. Typical pressures achievable in diamond anvil cells range from a few GPa to over 100 GPa and are coupled with a temperature-controlled environment, most commonly in the cryogenic regime.Reference Pecharsky and Zavalij37
In most materials, an application of pressure induces a consistent reduction of interatomic distances. Pressure-induced phase transitions involve structural reorganization that is associated with a discontinuous volume decrease. Analysis of in situ pressure data proceeds similar to the approaches mentioned in earlier sections using line profile analysis and those discussed later in the section on Rietveld. In addition, some unique techniques are described here that involve diffuse x-ray scattering. Ahart et al.Reference Ahart, Cohen, Struzhkin, Gregoryanz, Rytz, Prosandeev, Mao and Hemley39 showed that the diffuse scattering of single crystal 0.96Pb(Zn1/3Nb2/3)O3–0.04PbTiO3 ((1-x)PZN-xPT) decreases with compression by qualitatively looking at an XRD pattern. The authors attributed these results to suppression of local ferroelectric distortions in the material upon compression. Ahart et al. were also able to calculate a bulk modulus using the Vinet equation, listed as Eq. (4),
 $$P = 3\left[ {{K_0}{{(1 - x)} \over {{x^2}}}} \right]\exp \left[ {{3 \over 2}(K_0^\prime - 1)(1 - x)} \right]\quad {\rm{,}}$$
 $$x = {\left( {{V \over {{V_0}}}} \right)^{1/3}}$$
from the volume of the unit cell. In Eq. (4), P is the pressure, K 0 is the bulk modulus,  $K_0^\prime$ is the first derivative of the bulk modulus with respect to pressure, and V 0 is the volume of the unit cell at ambient pressure.
High pressure studies of lead titanate PbTiO3 (PT) at low temperature, 10 K, have also been completed using XRD.Reference Ahart, Somayazulu, Cohen, Ganesh, Dera, Mao, Hemley, Ren, Liermann and Wu40 High-resolution angle dispersive diffraction was carried out at beamline 11-ID-C at the Advanced Photon Source (APS) in Chicago, to observe the splitting of the tetragonal doublet, which suggests the transition to a lower symmetry structure. Figure 2 shows a clear split at 13.2 GPa of the (110)–(011) tetragonal doublet into a  $\left( {\bar 1{\rm{01}}} \right)$–(011)–
 $\left( {\bar 110} \right)$ monoclinic triplet. A monoclinic structure persists up to 20 GPa and transforms into a rhombohedral structure as can be seen in Fig. 2 at 22 GPa where a triplet becomes a doublet. Using line profile analysis, Ahart et al.Reference Ahart, Somayazulu, Cohen, Ganesh, Dera, Mao, Hemley, Ren, Liermann and Wu40 calculated lattice aspect ratio and monoclinic angle as a function of pressure to characterize the phase transitions. Raman spectroscopy was utilized to determine the M A (Cm) to M C (Pm) and M C to rhombohedral transitions. The results suggested a phase transition sequence from tetragonal to monoclinic M C at 10 GPa, monoclinic M C to monoclinic M A at 15 GPa, and monoclinic M A to rhombohedral at 20 GPa. This led to the conclusion that a MPB region exists under pressure and at cryogenic temperature (10 K) in PT. The work further suggested that the high electromechanical coupling observed in PT-based solid solutions (e.g., Pb(Mg1/3Nb2/3)O3–PT (PMN-PT) and Pb(Zn1/3Nb2/3)O3–PT ((1-x)PZN-xPT)) is a result of tuning the high pressure MPB in pure PT to ambient pressure, and that complex microstructures are not required to obtain strong piezoelectricity.
C. Electric field
As stated earlier, the application of electric fields to ferroelectric materials can cause several different structural changes including piezoelectric lattice strain, ferroelectric domain wall motion, and phase transitions. The former two effects are discussed in later sections of this article. The present section is focused on the application of diffraction to study field-induced phase transitions.
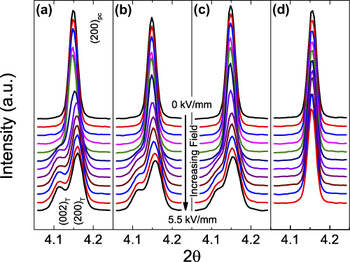
Electric-field-induced phase transitions have been inferred or observed in many ferroelectric materials, typically at compositions in close proximity to phase boundaries such as MPBs and PPTs. A notable example is by Saito et al.Reference Saito, Takao, Tani, Nonoyama, Takatori, Homma, Nagaya and Nakamura41 in which property anomalies are observed at a temperature near the phase transition, when an electric field is applied. It was suggested that the anomalies were the result of a field-induced transition during electric field drive at high amplitudes and further suggested that polymorphic phases be determined under application of electric fields. This structural determination requires in situ diffraction measurements and motivates several more recent studies along these lines. In the past decade, many such studies have been performed on compositions in systems of Na0.5Bi0.5TiO3–BaTiO3 (BNT–BT),Reference Daniels, Jo, Rödel, Honkimäki and Jones42,Reference Daniels, Jo, Rödel and Jones43 Na0.5Bi0.5TiO3–K0.5Bi0.5TiO3 (BNT–KBT),Reference Royles, Bell, Jephcoat, Kleppe, Milne and Comyn44 and PZT.Reference Dutta and Singh45,Reference Hinterstein, Rouquette, Haines, Papet, Knapp, Glaum and Fuess46 The approach typically taken is to observe the appearance and disappearance of peaks as a justification for proposed transitions.Reference Daniels, Jo, Rödel, Honkimäki and Jones42–Reference Hinterstein, Rouquette, Haines, Papet, Knapp, Glaum and Fuess46 As an example, we review the work of Daniels et al.Reference Daniels, Jo, Rödel, Honkimäki and Jones42 in which several compositions in the system (1−x−y)Bi0.5Na0.5TiO3–xBaTiO3–yK0.5Na0.5NbO3 (BNT–BT–KNN) were investigated. The in situ diffraction measurements for four compositions are shown in Fig. 3. The composition 0.93BNT–0.07BT shows the (002) pseudocubic reflection splitting into a doublet during application of electric field. The doublet suggests that the structure transitions into a tetragonal polymorph. As the composition is modified by increasing the KNN concentration, higher electric fields are required to induce the tetragonal polymorph [Figs. 3(a)–3(c)]. In the composition with the highest KNN concentration, the electric-field-induced transition is suppressed at all measured electric field amplitudes and only the electrically induced lattice strain is observed [Fig. 3(d)].
Pseudocubic (002) reflection of (a) 0.93BNT–0.07BT, (b) 0.938BNT–0.053BT–0.009KNN, (c) 0.932BNT–0.045BT–0.023KNN, and (d) 0.86BNT–0.14KNN as a function of electric field. Redrawn from Ref. Reference Daniels, Jo, Rödel, Honkimäki and Jones42.

In other systems, multiple polymorphic phases can coexist at equilibrium or nonequilibrium conditions and the fraction of the different phases subtly changes by the application of electric field. This has been observed in PZT near the MPB using XRDReference Hinterstein, Rouquette, Haines, Papet, Knapp, Glaum and Fuess46 and in BiScO3–PbTiO3 near the MPB using neutron diffraction.Reference Jones, Aksel, Tutuncu, Usher, Chen, Xing and Studer47 Analysis of ferroelectric phases can also be performed as a function of both temperature and electric field simultaneously, as demonstrated using neutron diffraction by Simons et al.Reference Simons, Daniels, Studer, Jones and Hoffman48 In Ref. Reference Simons, Daniels, Studer, Jones and Hoffman48, field-induced phase transitions were observed in the system 0.94BNT–0.06BT at elevated temperatures. It was shown that both phase transitions and a ferroelectric domain texture occur during application of an electric field.
III. WHOLE PATTERN FITTING FOR STRUCTURAL REFINEMENT
The most predominant method for refining the crystallographic structure of materials using powder diffraction data is the Rietveld method, which was developed in the 1960s.Reference Rietveld49 The Rietveld method, also referred to as Rietveld refinement, is a whole-pattern fitting method that refines the crystal structure through minimizing the difference between the measured and modeled diffraction patterns. In the least, the Rietveld method ultimately provides structural details including but not limited to atomic coordinates, atomic displacement factors, and site occupancies. This is achieved by minimizing a calculated diffraction pattern against an observed diffraction pattern using a least squares refinement. In addition to refining crystallographic structural details, a whole-pattern analysis enables additional factors to be determined including, e.g., phase fractions, crystallite size, macrostrain, microstrain, and crystallographic texture. Guidelines for the Rietveld method can be found in Refs. Reference McCusker, Von Dreele, Cox, Louër and Scardi50,Reference Young51. Several Rietveld packages are available and two popular examples are the General Structure Analysis System (GSAS)Reference Toby52,Reference Larzon and Von Dreele53 and FullProf.Reference Rodríguez-Carvajal54
Careful interpretation should be made using the results from a Rietveld refinement because of the limitations and potential errors involved in the refinements. First, the final result may rely strongly on the starting approximation of the structure, meaning that the initial structure should be selected carefully. A final result that is at a local minimum in the least squares refinement, but is not the correct structural solution, may be referred to as a false minimum. False minima can result from a poorly selected initial structure, or from refining parameters in a particular (ill-advised) sequence. Ultimately, the final results should make physical and chemical sense, in addition to representing the appropriate minimum in the least squares refinement. The experimenter must also remember that the refinement uses a single unit cell to model the structure, preventing accurate modeling of local disorder, hierarchical symmetries, and heterogeneity present in some ferroelectric materials (e.g., see Refs. Reference Keeble, Barney, Keen, Tucker, Kreisel and Thomas10–Reference Aksel, Forrester, Nino, Page, Shoemaker and Jones13).
Another recent example that illustrates how structural complexities can sometimes be manifested in the refined structures is the ferroelectric-like displacement fluctuations of Pb identified in PbTe.Reference Božin, Malliakas, Souvatzis, Proffen, Spaldin, Kanatzidis and Billinge55,Reference Zhang, Ke, Kent, Yang and Chen56 In PbTe, it is reported that the average structure determined from Rietveld refinement exhibits inflections in the atomic displacement parameters with temperature. Without additional information, these displacements could either be interpreted as thermal displacement parameters, or as a local positional disorder that is modeled as atomic displacements in the Rietveld refinement. A Rietveld refinement by itself, therefore, is inadequate to completely characterize the structure. Additional measurements using total scattering and pair distribution function (PDF) analysis methods suggest that these atomic displacement parameters are due to positional disorder of Pb on a length scale of ∼0.1 Å. This example illustrates that the Rietveld method can provide small signatures of local positional disorder, and can be complemented by other measurements and analysis routines.
A. Temperature
The Rietveld method can be applied to ferroelectric materials as a function of temperature to model important crystallographic changes such as lattice distortion, tilting of polyhedra, and P s. The value of P s can be calculated using the atomic positions obtained in a Rietveld refinement. This information becomes useful for determining the influence of nonambient conditions such as pressure and temperature on P s. P s can be determined using Eq. (5),
 $${P_{\rm{s}}} = \mathop \sum \limits_i {{\left( {{m_i} \times \Delta {x_i} \times {Q_i}e} \right)} \mathord{\left/ {\vphantom {{\left( {{m_i} \times \Delta {x_i} \times {Q_i}e} \right)} V}} \right. \kern-\nulldelimiterspace} V}\quad {\rm{,}}$$
where for the ith atom in the asymmetric part of the unit cell, m i is the site multiplicity, Δx i is the atomic displacement from the neutral position along the polarization axis, Q ie is the ionic charge, and V the unit cell volume.Reference Axe57,Reference Shimakawa, Kubo, Nakagawa, Goto, Kamiyama, Asano and Izumi58
The rhombohedral perovskite structure is observed in many ferroelectric systems and is a prototypical structure in which to discuss the effects of temperature on octahedral tilting. Megaw and DarlingtonReference Megaw and Darlington59 described mathematical formulae for relating atomic positions in the structure to octahedral tilting parameters such as the octahedral tilt ω, octahedral distortion d, A- and B-cation displacements s and t, together with an elongation or flattening of the octahedron, ζ. Examples of applying these relationships can be found in Refs. Reference Pandey, Singh and Baik60–Reference Glazer and Mabud63. Glazer and MabudReference Glazer and Mabud63 are one of the many examples in which the fractional coordinates obtained in the Rietveld refinement are used to calculate the cation displacements, octahedral distortions, and octahedral tilt angles as a function of temperature. As temperature is lowered, the octahedral tilt angles typically increase. Recently, new tilted phases have been observed and predicted across the PZT phase diagram at low temperatures (Refs. Reference Pandey, Singh and Baik60,Reference Kornev, Bellaiche, Janolin, Dkhil and Suard64).
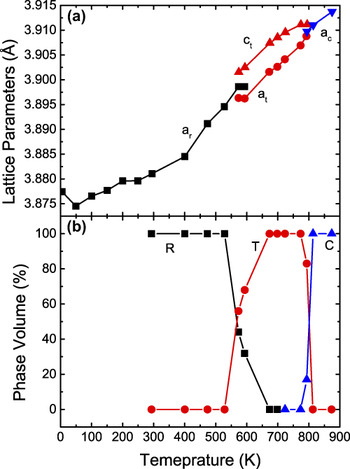
The Rietveld method is one of the most reliable approaches to quantify phase concentration because of the ability to use the entire diffraction pattern, which accounts for all diffraction peaks. This makes the Rietveld method ideal for the study of phase fraction changes across phase transitions. The approach of quantifying phase fractions from data refined in the Rietveld method is premised upon the fact that the observed intensities of constituent phases are scaled by a factor that is related to their phase fraction.Reference Pecharsky and Zavalij37,Reference Hill and Howard65 In BNT, a large region of coexistence of two polymorphs was determined by Jones and Thomas using neutron diffraction.Reference Jones and Thomas66 Some of these results are redrawn in Fig. 4, in which the unit cell parameters, Fig. 4(a), and phase fractions as a function of temperature demonstrate the phase transitions from rhombohedral R3c to tetragonal P4bm and then to the ideal cubic structure  $Pm\bar 3m$. The phase fraction data, Fig. 4(b), show two coexistence regions from 573 to 593 K (rhombohedral/tetragonal) and from 773 to 813 K (tetragonal/cubic). More recent high-temperature powder diffraction measurements of BNT proposed different room temperature structures and slightly modified phase transition temperatures.Reference Aksel, Forrester, Kowalski, Jones and Thomas67 The true structure of BNT and some details of the phase transitions are still open questions. Combined analysis of x-ray and neutron diffraction patterns could be very useful in helping to resolve these structures, solutions that may explain important temperature-dependent properties such as thermal depoling (Refs. Reference Aksel, Forrester, Kowalski, Jones and Thomas67–Reference Aksel, Forrester, Kowalski, Deluca, Damjanovic and Jones70).
(a) Lattice parameter versus temperature of BNT, where a r is the lattice parameter for the R3c rhombohedral structure, a T for the tetragonal, and a c for cubic. (b) Phase volume % versus temperature for the same material. Redrawn from Ref. Reference Jones and Thomas66.

B. Pressure
The measurement of diffraction patterns under hydrostatic pressure can also yield important information about the structure of ferroelectric materials and the nature of phase transitions, as introduced in Sec. II. B. Pressure-dependent diffraction measurements, using either x-ray or neutrons, measured in a diamond anvil cell can also be used in whole-pattern fitting to yield important structural details within each phase and approaching phase transitions. A study by Sani et al.Reference Sani, Hanfland and Levy71 on the classical ferroelectric PT used powder XRD to investigate structure as a function of pressure and temperature. Measurements were performed at various pressures and selected temperatures (room temperature, 462, 538, and 623 K). The measurement conditions and crystallographic details obtained from the Rietveld method enabled the calculation of several important parameters including bulk modulus (using a third order Birch–Murnaghan equation of state), bond distances (e.g., Ti–O and Pb–O), spontaneous strain, and P s [using Eq. (5)]. Using these results, this work reported a structural explanation of the first-/second order cross-over in ferroelectric–paraelectric phase transition upon applying pressure.
Other in situ diffraction measurements under pressure and using the Rietveld method have been conducted by Thomas et al.Reference Thomas, Kreisel, Glazer, Bouvier, Jiang and Smith72 on BNT to study its phase transition as a function of pressure. Both the high-pressure neutron diffraction and XRD experiments have confirmed the presence of a structural phase transition in the pressure interval of ambient to 97 kbar (9.7 GPa). The transformation begins at 20 kbar (2 GPa) and finishes at 40 kbar (4 GPa) as the structure goes from R3c to Pnma. Another important outcome of this study was the observation of the short Bi–O bond length that appears along the  ${\left\langle {\bar 101} \right\rangle _{{\rm{pc}}}}$ pseudocubic direction in the high pressure phase. The authors suggested that the displacement of Bi along this direction mimicked what is seen in a disordered R3c phase.
IV. DIFFRACTION DURING APPLICATION OF ELECTRIC FIELDS
The application of electric fields during diffraction measurements can provide useful information about the field-responsive mechanisms of ferroelectric materials. In particular, electric-field-induced lattice strain can be measured in diffraction as a shift of the peak positions. Ferroelectric/ferroelastic domain wall motion can be measured in diffraction as a change in intensities of certain ferroelastic degenerate reflections. For example, the (002) and (200) reflections from tetragonal perovskite materials should exhibit both changes in position and intensity as a result of lattice strain and domain wall motion. The resulting distribution of preferred domain orientations (with reference to the applied electric field direction) has been previously described as a domain texture. Because piezoelectricity is a strongly anisotropic property, the peak shifts of (002) and (200) are expected to be different. In soft PZT, in which significant domain wall motion occurs during application of electric fields, the shift in the position of the (111) reflection is particularly significant.Reference Pramanick, Damjanovic, Daniels, Nino and Jones73 Such a strong electric-field-induced lattice strain in the (111) reflection is also observed in other materials.
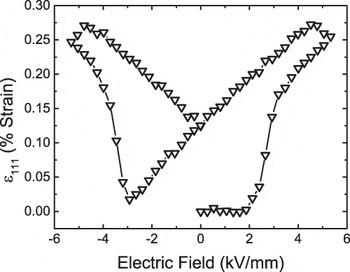
While Rietveld refinement can be used to model anisotropic lattice strain, a more straightforward and efficient method of extracting the amplitude of electric-field-induced lattice strain is single peak fitting, as described in Sec. II. The data in Fig. 5 show the electric-field-induced lattice strains for the (111) Bragg peak in 0.55Bi(Ni1/2Ti1/2)O3–0.45PbTiO3, a composition near a MPB.Reference Tutuncu, Fan, Chen, Xing and Jones74 The data in Fig. 5 are strongly hysteretic and mimic a strain-field “butterfly” hysteresis loop that is typical for ferroelectric materials. The lack of linearity and existence of hysteresis in this data suggests that the lattice strain is not purely intrinsic in nature and is instead coupled to hysteretic extrinsic effects, e.g., domain wall motion.
Electric-field-induced lattice strain of the (111) peak for the 0.55Bi(Ni1/2Ti1/2)O3–0.45PbTiO3. Redrawn from Ref. Reference Tutuncu, Fan, Chen, Xing and Jones74.

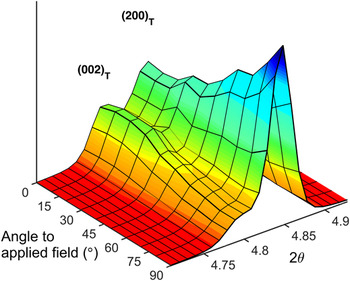
The extent of domain reorientation can be quantified using the intensities of ferroelastic degenerate reflections, e.g., the (002) and (200) of tetragonal perovskite or the (111) and  $\left( {\bar 111} \right)$ in rhombohedral perovskite. When an electric field of amplitude >E c is applied, significant domain reorientation occurs. Weak electric fields with amplitudes <E c can also result in domain reorientation that significantly affects the macroscopic properties. Using either strong or weak electric field amplitudes, the resulting electric-field-induced domain structure can be described as a domain texture. The greatest degree of domain alignment is typically expected in the diffraction pattern when the scattering vector, Q, is aligned parallel to the electric field direction. Figure 6 illustrates this effect for 0.93BNT–0.07BT during application of a strong (>E c) electric field. At an angle of 0°, the diffraction pattern describes the scattering from planes aligned perpendicular to the electric field direction, and an angle of 90° corresponds to scattering from planes aligned parallel to the electric field direction. When applying an electric field, a-oriented domains switch to c-oriented domains thus creating an increase in (002) intensity in the direction to the electric field (0°). In grains oriented at different angles to the field direction, there is a progressively decreasing driving force for domains to reorient.
The diffracted intensities of the (002) and (200) peaks of the 0.93BNT–0.07BT as a function of angle to applied electric field. The intensity of the (002) is the highest parallel to the electric field direction (0°). Redrawn from Ref. Reference Daniels, Jo, Rödel, Honkimäki and Jones42.

The degree of domain alignment can be quantified using the change in diffraction intensities of degenerate reflections relative to the unpoled state. For tetragonal perovskite ferroelectrics, domain alignment is quantified in terms of multiples of a random distribution (mrd) through the ratio of the diffraction intensity of the (002) and (200) reflections in the poled and unpoled states:
 $${f_{002}} = 3{{{{{I_{002}}} \over {I_{002}^\prime }}} \over {{{{I_{002}}} \over {I_{002}^\prime }} + 2{{{I_{200}}} \over {I_{200}^\prime }}}}\quad {\rm{,}}$$
where I 00h and  $I_{00{\rm{h}}}^\prime$ are the integrated intensities of 00h reflections of a poled and an unpoled sample. Equivalent relationships have been derived for other crystallographic structures.Reference Jones, Slamovich and Bowman75 The degree of domain alignment calculated from Eq. (6) has units of mrd and is related to the volume fraction of aligned domains in a particular scattering direction of the sample, η002. This relationship is defined by Eq. (7).
 $${\eta _{002}} = {{{f_{002}}} \over 3} - {1 \over 3}\quad {\rm{.}}$$
For tetragonal materials, a random distribution of ferroelectric domains results in n 002 = 0. For a fully aligned sample, the maximum value of n 002 = 0.67 would indicate that all a-oriented domains changed to c-oriented domains in the direction being measured. However, due to mechanical constraints imposed by neighboring grains in polycrystalline ferroelectrics, materials typically do not reach the maximum value of n 002 = 0.67. Reference Reference Tutuncu, Fan, Chen, Xing and Jones74 reports that typical n 002 values observed for PZT ceramics in the poled state are 0.13–0.46 in the direction parallel to field.Reference Tutuncu, Fan, Chen, Xing and Jones74
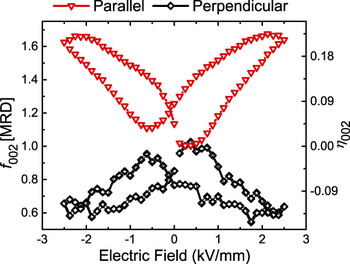
Using the above approach, Tutuncu et al.Reference Tutuncu, Li, Bowman and Jones76 performed in situ XRD studies on (1−x)(Ba(Zr0.2Ti0.8)O3–x(Ba0.7Ca0.3)TiO3. As shown in Fig. 7, the induced domain texture increases with increased applied electric field and exhibits hysteresis similar to that described previously for the (111) lattice strain. Because f 002 (and, equivalently, η002) is a direct measure of the degree of domain alignment, hysteresis with field evidences hysteretic domain wall motion. It is also noted that the degree of domain alignment during electric field application decreases with angle to the electric field, correlating with the orientation dependence of the intensities shown in Fig. 6.
Calculated f 002 and equivalent η002 values for 0.4(Ba(Zr0.2Ti0.8)O3–0.60(Ba0.7Ca0.3)TiO3 as a function of electric field amplitude and angle to field direction. The parallel and perpendicular represent the orientation of the scattering vector relative to the electric field direction. Redrawn from Ref. Reference Tutuncu, Li, Bowman and Jones76.

Ferroelectric materials are often used in dynamic modes and the physical phenomena involved are often time-dependent. Using time-resolved diffraction, Grigoriev et al.Reference Grigoriev, Do, Kim, Eom, Adams, Dufresne and Evans77 demonstrated a time resolution of the order ∼100 ps in a synchrotron experiment used to study ferroelectricity and piezoelectric lattice distortion in a PZT thin film. Such small time scales are not always needed to characterize the time-dependent response in ferroelectric ceramic materials, which have much longer characteristic times. For example, Genenko et al.Reference Genenko, Zhukov, Yampolskii, Schütrumpf, Dittmer, Jo, Kungl, Hoffmann and von Seggern78 showed that time scales of 10−5 to 102 s are most relevant for PZT and 0.94BNT–0.06BT ferroelectric ceramics. In the work of Daniels et al.,Reference Daniels, Cozzan, Ukritnukun, Tutuncu, Andrieux, Glaum, Dosch, Jo and Jones79 in situ high-energy XRD was used to investigate the switching mechanism and time scales in tetragonal ferroelectrics.Reference Daniels, Cozzan, Ukritnukun, Tutuncu, Andrieux, Glaum, Dosch, Jo and Jones79 It was found that there exists an intermediate domain orientation state during polarization reversal. The work identified two independent time constants that reflect the sequence between these unique domain orientation states. The first (fastest) time constant is shown to be strongly affected by residual stress that is developed during poling. The second (slower) time constant is associated with domain wall motion without the aid of residual stress. In addition to the examples cited above, diffraction of single crystals during application of electric fields has provided complementary information. Examples can be found in Refs. Reference Gorfman, Schmidt, Pietsch, Becker and Bohatý80–Reference Gorfman, Schmidt, Tsirelson, Ziolkowski and Pietsch83. Single crystal studies, in particular, readily characterize intrinsic piezoelectric lattice strains and changes to bond distances in response to fields.
These examples demonstrate the usefulness of the experimental approach and analysis methods for characterizing field-dependent behavior in ferroelectric materials. It is hoped that the development and increasing awareness of these techniques and approaches will promote their use by other investigators and in new material systems, enabling a more fundamental understanding of ferroelectric materials. Certain structure–property relationships have already been revealed using these techniques including the influence of spontaneous strain,Reference Tutuncu, Li, Bowman and Jones76 grain size,Reference Ghosh, Sakata, Carter, Thomas, Han, Nino and Jones84 and compositionReference Pramanick, Damjanovic, Daniels, Nino and Jones73 on domain wall motion and properties. When applied more pervasively, additional structure–property relationships will be revealed and the measurements can be used to inform and integrate with models.
V. STRESS-INDUCED PHASE TRANSITIONS AND DOMAIN REORIENTATION
In many ferroelectric materials, the application of mechanical stress can strongly influence the structure. Three examples of stress-induced structural changes include phase transitions, domain wall motion (through the ferroelastic effect, predominantly during application of high stresses), and charge displacement (through the piezoelectric effect, during application of weak stresses). Some conditions under which such experiments can be conducted include the application of uniaxial or biaxial compression,Reference Evans, Oliver, Withers, Mori and Hall85–Reference Webber, Zhang, Jo, Daniels and Rödel88 bending,Reference Tutuncu, Motahari, Bernier, Varlioglu, Jones and Ustundag87 stresses near crack tips,Reference Jones, Motahari, Varlioglu, Lienert, Bernier, Hoffman and Üstündag89 and conditions that induce domain wall creep.Reference Pojprapai(Imlao), Luo, Clausen, Vogel, Brown, Russel and Hoffman90 In the case of applied stress, the analysis of diffraction data proceeds along similar lines to that undertaken for the in situ electric field experiments and the values calculated can include f 002 and volume of domains switched (η), lattice strains, and intensity ratios of specific peaks.
A. Stress-induced phase transitions
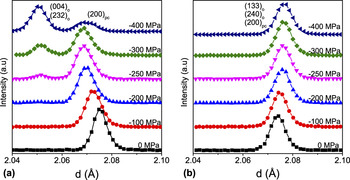
In the classical PZT system, the Zr/Ti = 95/5 composition is one example in which a stress-induced transition has been observed. In particular, neutron diffraction was used by Hall et al.Reference Evans, Oliver, Withers, Mori and Hall85 to observe a rhombohedral to an orthorhombic phase transition under uniaxial compression. Figure 8 reproduces some of these measurements for the pseudocubic {200}pc reflections. The changes in intensity of peaks from different phases indicate a phase transition. The development of the (004)o and (232)o orthorhombic reflections for scattering vectors parallel (planes perpendicular) to the loading direction [Fig. 8(a)] shows direct evidence of a rhombohedral to an orthorhombic phase transition under the influence of uniaxial compressive stress. In contrast, the diffraction patterns representing scattering vectors perpendicular (planes parallel) to the loading direction [Fig. 8(b)] do not show induced (004)o and (232)o reflections from the orthorhombic phase. The absence of these reflections in Fig. 8(b) indicates that the stress-induced phase is strongly textured, with the (004)o and (232)o planes from the orthorhombic phase perpendicular to the loading direction and the (133)o and (240)o planes from the orthorhombic phase parallel to the loading direction. The authors suggest that the strong crystallographic texture in the emergent orthorhombic structure is an indication of a displacive martensitic transformation since the crystallographic orientation of the new phase is dependent on the direction of the applied stress. These results also reinforce the value of measuring scattering vectors in all directions relative to the loading direction; this information is important for accessing phase transitions involving strongly textured domain orientations.
Neutron diffraction patterns obtained under increasing compressive stress in the region of the pseudocubic {200}pc (a) shows planes perpendicular to the loading direction (b) and planes parallel to the loading direction. Redrawn from Ref. Reference Evans, Oliver, Withers, Mori and Hall85.

Changes in the existence and intensity of superlattice peaks also indicate certain phase transitions that involve cell doubling. For example, Webber et al.Reference Webber, Zhang, Jo, Daniels and Rödel88 use high-energy XRD in a lead-free ferroelectric material, 0.94BNT–0.06BT, to investigate phase transitions involving octahedral tilting. In Ref. Reference Webber, Zhang, Jo, Daniels and Rödel88, the  ${1 \over 2}$(211)pc superlattice reflection is observed during application of a uniaxial stress at a temperature of 200 °C, an indication that oxygen octahedral tilting is involved in the phase transition.
B. Domain reorientation
Stress-induced domain reorientation has been widely studied using compositions in the classical PZT phase diagram. One example is by Rogan et al.,Reference Rogan, Üstündag, Clausen and Daymond91 who conducted neutron diffraction experiments on a PZT (52/48) that consisted of a coexistence of tetragonal and rhombohedral phases. The Rietveld method was used with a March–Dollase (M-D) texture model to obtain the crystallographic texture of both phases. The domain reorientation was shown to saturate at a stress of approximately 100 MPa.
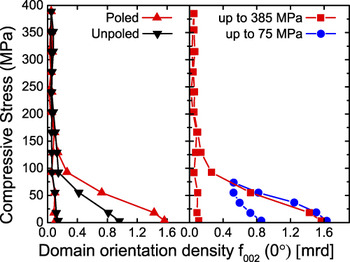
A more recent report by Marsilius et al.Reference Marsilius, Granzow and Jones92 shows the domain reorientation during the entire loading–unloading cycle of a commercial PZT composition (Pb0.99(Zr0.45Ti0.47(Sb0.67Ni0.33)0.08)O3) as a function of maximum stress amplitude and the effect of prepoling. In contrast to the Rietveld approach taken by Rogan et al.,Reference Rogan, Üstündag, Clausen and Daymond91 Marsilius et al.Reference Marsilius, Granzow and Jones92 determined the domain orientation density [f 002 (0°)] by profile fitting of the (002) and (200) reflections and calculated f 002 using Eq. (6). Figure 9 shows the resulting f 002 values as a function of the applied compressive stress. For unpoled samples, the initial domain orientations are random and the f 002 value starts at 1 mrd. In samples that are initially poled, the initial degree of domain alignment is increased parallel to the field direction and the initial value is f 002 = 1.6 mrd. In both unpoled and initially poled samples, the application of compressive stress causes a decrease in the degree of domain alignment, reflected in a decrease in f 002. Most changes in f 002 with stress take place at stresses below 150 MPa similar to the results of Rogan et al.Reference Rogan, Üstündag, Clausen and Daymond91 on a different PZT composition. Above 150 MPa, the f 002 values approach 0, indicating that the majority of the (002) poles are oriented in directions away from the loading direction, regardless of the initial poling state. The domain orientation density of prepoled samples at different maximum stress levels, 75 and 385 MPa, are plotted on the right-hand side of Fig. 9. These measurements show good reproducibility for small loads in the beginning of the loading cycle. For the experiment in which the maximum stress was 75 MPa, the unloading curve behaved differently from the experiment in which the maximum stress was 385 MPa. This result indicates that a certain volume of domains return to having their c-axes parallel to the loading direction during the unloading cycle, a phenomenon referred to as backswitching.
Domain orientation density f002 [mrd] as a function of applied compressive stress and measured with the scattering vector parallel to the loading direction (0°). Redrawn from Ref. Reference Marsilius, Granzow and Jones92.

Though both of these examples utilize PZT, the experimental technique and data analysis approach can also be applied to other compositions, for example the BNT–xBT system. Some in situ XRD measurements have been reported in BNT–xBT during the application of stress,Reference Jo, Daniels, Jones, Tan, Thomas, Damjanovic and Rödel93 and calculation of the domain volume fraction could be applied to further quantify the degree of domain reorientation.
VI. DIFFRACTION DURING SYNTHESIS
Ferroelectric materials have been synthesized through a variety of routes, including solid state synthesis, vapor deposition, and solution-based chemical routes. These synthesis processes can be monitored and studied using x-ray and neutron diffraction, the results of which can be used to understand material phenomena including the nucleation and growth of phases, diffusion, and texture evolution. Time is an important parameter in material synthesis and experiments can be designed to capture most time-dependent phenomena. Time-resolved diffraction patterns are often desired for in situ synthesis experiments.Reference Eckold, Gibhardt, Caspary, Elter and Elisbihani94–Reference Tutuncu, Chang, Poterala, Messing and Jones98 Since XRD (in particular, using synchrotron sources) produces relatively high intensity diffraction patterns, these sources are predominantly used for the diffraction characterization of material synthesis processes in situ. However, there exist a few of these types of studies that use neutron diffraction, e.g., see Refs. Reference Eckold, Gibhardt, Caspary, Elter and Elisbihani94,Reference Eckold, Hagen and Steigenberger95 on Rb2ZnCl4.
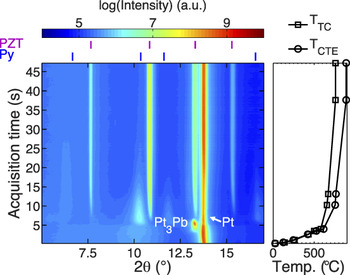
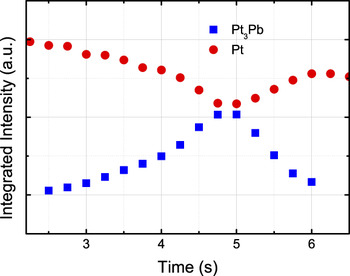
Ferroelectric thin films serve as an example for highlighting in situ diffraction techniques during synthesis. With decreasing thickness, ferroelectric thin films exhibit an increasing specific interfacial area. This means that the interaction between the films with the substrate and atmosphere is increasingly important as film thickness decreases. In polycrystalline PZT thin films produced by solution deposition, the interaction of Pb in the solution with the bottom electrode has been thought to affect the nucleation and growth of PZT during crystallization.Reference Huang, Zhang and Whatmore96 In particular the formation of a Pt3Pb phase has been identified as a transient phase during the crystallization using ex situ investigations. Using XRD at a synchrotron source, Nittala et al.Reference Nittala, Mhin, Dunnigan, Robinson, Ihlefeld, Kotula, Brennecka and Jones97 investigated phase and texture evolution of solution-derived PZT on platinized silicon substrates during heating and crystallization. This work found that the transient intermetallic phase, Pt3Pb, appears and then disappears, after which the sequential formation of a pyrochlore and perovskite phase is observed. The complete in situ crystallization experiment is shown in Fig. 10. While Rietveld is useful for quantifying phase fraction, single peak fitting can also yield quantitative and semiquantitative information about changing phase fractions. To further interpret the evolution of the Pt3Pb phase, the platinum (Pt) (111) and Pt3Pb (111) were fit to profile shape functions. The integrated intensities that are extracted from the profile fit can provide useful information to quantify changes in phase fraction. Figure 11 shows the integrated intensity of the Pt and the Pt3Pb peaks. The decrease in Pt intensity upon formation of the Pt3Pb is correlated with the increase in the Pt3Pb intensity. This data was reported to suggest that conversion of Pt into Pt3Pb was enabled by diffusion of lead into Pt.
In situ XRD measurements of solution-deposited PZT on Pt measured during heating using a synchrotron x-ray source. Pt (111) and Pt3Pb (111) peaks are labeled. Redrawn from Ref. Reference Nittala, Mhin, Dunnigan, Robinson, Ihlefeld, Kotula, Brennecka and Jones97.

Integrated intensities of the Pt (111) and Pt3Pb (111) diffraction peaks during formation and disappearance of the Pt3Pb phase. Redrawn from Ref. Reference Nittala, Mhin, Dunnigan, Robinson, Ihlefeld, Kotula, Brennecka and Jones97.

The synthesis of bulk, polycrystalline and powder ferroelectric materials can also be studied using in situ x-ray and neutron diffraction. A recent example was reported by Aksel and JonesReference Aksel, Forrester, Kowalski, Jones and Thomas67 on the formation of BNT during calcination. Based on the evidence from the XRD measurements, it was proposed that Bi2O3 serves as a host for a particle formation mechanism, i.e., that Na, Ti, and O diffuse into the Bi2O3 particle to form BNT through a diffusion-dependent process. The experiment, which utilized a laboratory x-ray diffractometer, was also adequate to detect a small fraction of a transient phase which disappeared before the conclusion of the process.
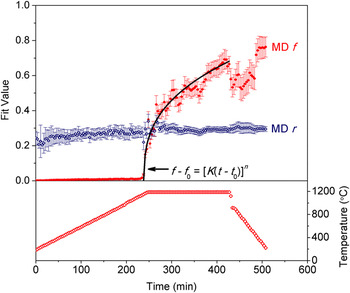
The characterization of texture can also be performed during material synthesis, and is a natural extension of the experiment described previously. For example, Tutuncu et al.Reference Tutuncu, Chang, Poterala, Messing and Jones98 used in situ high energy XRD to study the phase formation and texture development during templated grain growth of (Na0.5K0.5)0.98Li0.02NbO3 (NKLN). The starting materials consisted of a (Na0.4645K0.5145Li0.021)NbO3 matrix phase powder and anisometric templates of composition NaNbO3. At a temperature of 1115 °C during heating, interdiffusion of the elements between the two distinct phases enabled the template to convert to the matrix composition. Moreover, it was observed that significant texture evolution occurred during and after this process. The method of characterizing the texture development of the matrix phase was to fit the orientation dependence of a particular reflection to the M-D function. The M-D parameter r, which describes the degree of orientation, is used to show that the preferred orientation of the templates is inherited to the matrix phase. The M-D parameter f, which describes the fraction of the sample that has a preferred orientation, increases during the sintering and densification processes. Both of these parameters are shown in Fig. 12 during the process. Experiments and analyses such as those presented here demonstrate the usefulness for which diffraction can be used to characterize fundamentals underpinning material synthesis processes.
Fit coefficients f and r from the March–Dollase function describe the evolution of texture during templated grain growth of NKN ferroelectric ceramics. Reprinted with permission from Wiley and Sons: Journal of the American Ceramic Society,Reference Tutuncu, Chang, Poterala, Messing and Jones98 Copyright, 2012.

VII. TOTAL SCATTERING AND PDF ANALYSIS
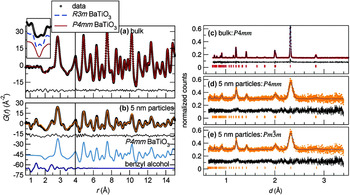
The PDF has become a useful way to describe the local structure of all materials, in particular those that are amorphous, of low crystallinity, or composed of nanometer- and subnanometer-sized crystalline regions. PDFs are constructed from experimental data using the Fourier transform of the experimentally measured x-ray and neutron diffraction patterns. This calculation is becoming more routine, though great care should be taken with appropriate instructions. Details of the PDF calculation can be found in Ref. Reference Egami and Billinge99. The PDF correlates to the probability of finding a pair of atoms separated by a given radial distance, r. The PDF method is particularly useful because it can extract relevant local-structure details from materials that produce broad or weakly scattering Bragg peaks. Examples of PDFs of large and small (∼5 nm) particle size BT are shown in Fig. 13. The PDFs are similar for both materials, which indicate that the local crystal structure is similar in both samples. However, the diffraction pattern from the sample with ∼5 nm particle size produces broadened Bragg peaks of lower intensity. Analysis of measured PDFs can proceed by fitting structural models to the measured data and are also discussed in detail in Ref. Reference Egami and Billinge99.
PDF of (a) bulk and (b) 5 nm BT. Diffraction patterns and representative Rietveld refinement of (c) bulk, and (d, e) 5 nm BT. Adapted with permission from Page et al.: Probing Local Dipoles and Ligand Structure in BaTiO3 Nanoparticles. Chem. Mater. 22, 4386 (2010). Copyright (2010) American Chemical Society.

In addition to nanocrystalline materials, locally ordered structural distortions of small amplitude can be characterized in crystalline materials using the PDF. For example, the local structure of PMN and PZN and their solutions with PT has been determined as well as BNT.Reference Keeble, Barney, Keen, Tucker, Kreisel and Thomas10,Reference Aksel, Forrester, Nino, Page, Shoemaker and Jones13,Reference Jeong and Lee100–Reference Egami, Dmowski, Akbas and Davies104 In PMN-PT, the diffraction pattern appears cubic, i.e., there is no splitting of Bragg peaks that indicate symmetry lowering with temperature change. However, the use of PDFs has enabled the characterization of polar nanoregions (PNRs) that exist within a pseudocubic matrix.Reference Jeong, Darling, Lee, Proffen, Heffner, Park, Hong, Dmowski and Egami102 Within the PNRs, the displacement of cations parallel to [111] indicates local rhombohedral distortions, though the average symmetry measured at a longer length scale remains cubic. A similar phenomenon was observed in PMN-PT where the PNRs are larger (∼150 Å at 300 K) than PMN-PT (∼20 Å at 300 K) and are visible in powder diffraction by splitting of Bragg peaks thus resulting a rhombohedral structure below 325 K.Reference Jeong and Lee100 In BNT, it was found that Bi displaces anisotropically from the average position, while Na does not.Reference Keeble, Barney, Keen, Tucker, Kreisel and Thomas10,Reference Aksel, Forrester, Nino, Page, Shoemaker and Jones13 These two cations occupy the same site, but have unique local structures that can be determined from the PDF. The PDF is therefore shown to be useful in characterizing local displacements (and polarity) that is not readily accessible from diffraction. PDFs can also be determined for ferroelectric materials under pressure as done by Chapman et al.Reference Chapman, Chupas, Halder, Hriljac, Kurtz, Greve, Ruschman and Wilkinson105 on BaTiO3. Because many ferroelectric materials and systems exhibit subtle structural distortions, many of which are not correlated at longer length scales, the PDF technique exhibits great promise for resolving these structural characteristics. This technique will become more important as the complexity increases in new multicomponent systems and complex solid solutions.
VIII. X-RAY DIFFRACTION BASED THREE DIMENSIONAL MICROSCOPY
XRD based three-dimensional microscopy (3D-XRD) is used to measure the spatially resolved structure in three dimensions inside of solid materials. In essence, 3D-XRD provides a nondestructive microscope that can be used to characterize polycrystalline structures. It can specifically be used to characterize the spatial dependence of crystallite size, crystallographic texture, and strain. There are currently two well-known permanent installations of 3D-XRD setups, the ID11 beamline at the European Synchrotron Radiation Facility in Grenoble, France and 1-ID-D at the APS in Chicago.
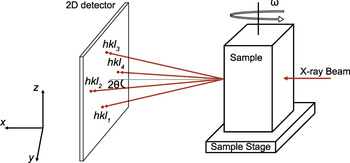
A typical 3D-XRD setup involves measuring two-dimensional diffraction patterns at fixed distance(s) from the sample, as illustrated in Fig. 14.Reference Poulsen106,Reference Jensen and Poulsen107 The sample is rotated about the angle omega (in increments of Δω) and diffraction patterns are measured at each sample orientation. At each sample orientation, the sample is oscillated by an angle (typically Δω) during each exposure to measure scattering from crystallites oriented within that angular range. To generate a full 3D reconstruction of the material, the sample is iteratively stepped in the z direction (in increments of Δz) then two-dimensional diffraction patterns are measured for all sample orientations.
3D-XRD setup at beamline 1-ID-C of the APS. Redrawn from Ref. Reference Varlioglu, Lienert, Park, Jones and Üstündag111.

The reconstruction of the material structure in three dimensions is challenging due to the complexity of the experimental setup and data processing. Some standard software packages that have been developed to determine the material structure include Grainspotter,Reference Schmidt108 GRAINDEX,Reference Lauridsen, Schmidt, Suter and Poulsen109 and GrainsweeperReference Schmidt110 which are used to index grains and assemble the structural information into a 3D reconstruction of the material.
Because 3D-XRD can determine the spatial dependence of structure in solid materials, it is a technique with significant potential use in ferroelectric materials. Varlioglu et al.Reference Varlioglu, Lienert, Park, Jones and Üstündag111 demonstrated application of this technique to BT ceramics at elevated temperature and during electric field application. Using 3D-XRD, the orientation of domains within a grain was studied during a phase transformation from cubic to tetragonal. In future application of this technique, researchers should explore other experimental variations of interest to ferroelectric materials, e.g., the change in domain switching and domain configuration during electric field or stress application, and approaching or during structural phase transitions as a function of temperature, pressure, electric field, and stress.
IX. OUTLOOK
In this study, we reviewed several important experimental and analysis approaches for characterizing ferroelectric materials in situ and reviewed several important findings and discoveries that resulted from their use. Most of the approaches introduced in this study can be equally applied to ex situ measurements as in situ measurements. Phase identification was discussed in the context of determining phase transitions during applied stimuli. Line-profile analysis of select peaks was introduced as a means to further evaluate characteristics of phase transitions and microstructure effects including crystallite size, microstrain, crystallographic texture, and domain reorientation. Whole-pattern fitting, which is a method that involves fitting the entire (or multiple) diffraction patterns by refining a model, is a versatile and effective technique which extracts crystallographic information that is important for ferroelectric materials such as spontaneous strain and polarization. In some ferroelectric materials, multiple polymorphic phases can co-exist and quantitative phase analysis was discussed as a means to determine fractions of these phases. The Rietveld method was introduced as a reliable method of determining phase fractions from diffraction patterns measured as a function of temperature and pressure. Measurement of diffraction patterns during application of electric fields was discussed as an approach to characterize electric-field-induced strain and domain texture and reorientation. All of the above measurements can be equally applied to in situ measurements during application of mechanical stress. XRD was introduced as a valuable technique for characterizing the synthesis of materials in situ and examples were given for thin films, solid state synthesis of powders, and textured polycrystalline materials. While the above techniques are useful for determining important changes in the average structure of ferroelectric materials during applied stimuli, the PDF was introduced as a way to describe the local structure of nanocrystalline and crystalline materials and how the local structure changes under different conditions. Advances in determining the spatial variation of the structure inside solid samples were also discussed and 3D-XRD was introduced as a new technique with great potential for contributing important spatial information about ferroelectric materials. While these techniques and approaches have enabled significant discoveries and advancement in ferroelectric materials already, it is expected that their application will continue to grow and they will remain as central techniques for characterizing ferroelectric materials.
ACKNOWLEDGMENTS
The authors acknowledge support from the Army Research Office under contract W911NF-09-1-0435.