Introduction
Upper airway anatomy can significantly affect pharyngeal patency. Soft tissues, bony enclosure of the upper airway and their combinations can affect the size of the upper airway. There is substantial evidence that the pharyngeal airway volume of patients with obstructive sleep apnoea (OSA) is smaller than normal.Reference White1,Reference Dempsey, Veasey, Morgan and O'Donnell2 Several mechanisms have been speculated to cause systemic and local airway oxidative stress and inflammation in patients with OSA, including ischaemia-reperfusion injury caused by hypoxaemia and reoxygenation and repeated trauma because of episodes of obstructive airway reopening during sleep and mechanical trauma secondary to snoring with associated vibration-induced soft tissue injury. Additionally, soft tissues of the upper airway and adipose tissue can act as reservoirs of cytokines, with leptin-mediated systemic inflammation, significantly reduced rapid eye movement (REM) sleep, and an increased sympathetic tone occurring in severe OSA.Reference Yokoe, Minoguchi, Matsuo, Oda, Minoguchi and Yoshino3–Reference Schwarz, Martinez-Lozano Sinues, Bregy, Gaisl and Garcia Gomez6
The airway mucosa plays an important role in regulating the patency of the lower airway; however, its role in regulating the structure of the upper airway in OSA patients remains uncertain. Inflammation in this area can increase the mucosal thickness of the oropharyngeal wall and lead to upper airway narrowing.Reference Woodson, Garancis and Toohill7,Reference Paulsen, Steven, Tsokos, Jungmann, Müller and Verse8 The existing inflammation and abnormal repair cause increased connective tissue deposition, which may lead to upper airway remodelling in severe OSA.Reference Sekosan, Zakkar, Wenig, Olopade and Rubinstein9 Tissue fibrosis may represent the end-stage of tissue inflammation. Histological studies have demonstrated diffuse inflammatory changes, myopathy, focal neuronal degeneration, and neuropathy in the soft palate and uvular surgical specimens of patients with OSA.Reference Woodson, Garancis and Toohill7–Reference Hunter, McVittie and Comaish11
Fibrosis and remodelling of the upper respiratory tract may hinder the mechanical coupling between upper airway non-contraction and contraction elements, weakening the force-generating ability of the skeletal muscles, along with impairing pharyngeal reflex-mediated upper airway muscle contractility and efficiency of upper airway contraction.Reference Hunter, McVittie and Comaish11–Reference Friberg, Gazelius, Hökfelt and Nordlander13 Additionally, airway inflammation and remodelling may change tissue compliance, which could adversely affect upper airway collapsibility.Reference Hunter, McVittie and Comaish11–Reference Carrera, Barbé, Sauleda, Tomás, Gómez and Agustí15 Berger et al. demonstrated that laser palatoplasty resulted in soft palate scarring and increased upper airway collapsibility, suggesting that upper airway remodelling is associated with worsening of OSA.Reference Berger, Finkelstein and Ophir16 Sériès et al. showed that compared with normal individuals, stimulating muscle contractions of equivalent intensity produced less uvular tissue displacement in patients with OSA.Reference Sériès, Côté and St Pierre17
This study aimed to assess whether molecular signalling involved in upper airway remodelling (upper airway inflammation, remodelling, and the expression of pro-fibrotic and pro-inflammatory cytokines in the uvula) is enhanced in patients with OSA.
Materials and methods
Patient selection
We prospectively recruited 40 patients who had just been diagnosed with severe or moderate OSA. The included patients had no other diseases, were taking no medications, had failed continuous positive airway pressure (CPAP) treatment or could not tolerate CPAP treatment and wanted to undergo uvulopalatopharyngoplasty (UPPP). Twenty healthy individuals who had mild OSA (apnoea-hypopnea index greater than 5 and absent daytime hypersomnolence) and desired UPPP were recruited as the control group. OSA was confirmed by an overnight sleep study.
We excluded participants who were over 65 years old and smokers (more than 10 pack-years) as well as those with recent acute illnesses, diabetes (postprandial blood sugar more than 200 mg/dl or pre-meal blood glucose more than 120 mg/dl), severe or moderate hyperlipidaemia (triglycerides more than 250 mg/dl or cholesterol more than 230 mg/dl), high blood pressure (blood pressure exceeding 140/85 mmHg at least twice in three measurements), neuromuscular diseases, heart diseases, and lung diseases.
To match the weights of the two groups of individuals, the OSA group only included participants with a body mass index (BMI) less than 32 kg/m2, and the control group only included participants with a BMI more than 25 kg/m2. The study was approved by our ethics review committee (approval number: 09-P-006), and written informed consent was obtained from all participants.
We evaluated all participants through physical examination, history review and blood tests (including triglycerides, cholesterol, before-meal and after-meal blood sugar, and haematocrit). In addition, all participants participated in an overnight sleep study and underwent lung function assessment. After resting for more than 15 minutes in the sleep laboratory, blood pressure was examined at 07:00, 20:00 and 22:00 hours.
Sleep study
According to the American Academy of Sleep Medicine scoring rules, respiration and related events are manually scored to evaluate them.Reference Iber, Ancoli-Israel, Chesson and Quan18 Briefly, apnoea is defined when the amplitude of the airflow during the apnoea period is less than 10 per cent of the baseline amplitude during evaluation by an oronasal thermal sensor. The amplitude standard for apnoea is an event that lasts more than 10 seconds and meets the amplitude standard for more than 9 seconds. Hypopnea is defined as a reduction of equal to or more than 50 per cent in one of the following three respiratory parameters: airflow signal (detected by nasal pressure sensor), abdominal or chest breathing signal (detected by induction plethysmography) over 10 seconds, and oxygen desaturation equal to or more than 3 per cent or arousal from sleep.Reference Iber, Ancoli-Israel, Chesson and Quan18 More than 90 per cent of the duration of the event should meet the amplitude criterion. The apnoea-hypopnea index is defined as the mean of the sum of hypopnea and apnoea per hour of sleep. The desaturation event frequency was defined as the average number of episodes of oxygen desaturation per hour of sleep. The arousal index was defined as the average number of arousals per hour of sleep, and sleep efficiency was calculated as a percentage of the total sleep time divided by the total bed time.Reference Iber, Ancoli-Israel, Chesson and Quan18 Obstructive sleep apnoea with an apnoea-hypopnea index score equal to or more than 5 and apnoea-hypopnea index score equal to or more than 20 were defined as moderate and severe OSA, respectively. The Epworth Sleepiness Scale was used to assess the state of excessive sleep during the day.Reference Johns19
Uvulopalatopharyngoplasty technique
Bilateral tonsillectomy was performed if tonsils were present. The redundant mucosa at the anterior edge of the velum along with the lower end of the uvula was trimmed. The uvular muscles were preserved, and meticulous dissection was performed to avoid damaging the underlying musculature. The closure was started by suturing the tonsillar fossa; the anterior and posterior pillars, as well as the uvular tip, were sutured together to increase the airway size and decrease tissue collapse. An experimental sample was obtained from the central part of redundant mucosa and underlying soft tissues of the velum and uvula (1 × 1 cm).
Histological examination
After UPPP, surgical specimens were collected from the control group (n = 20) and OSA group (n = 40). The tissue specimens were immediately fixed in 4 per cent alcoholic formalin acetic acid solution and embedded in paraffin. A 4 μm section from the centre of the uvula was stained with haematoxylin and eosin as well as Masson's trichrome stain for microscopic examination using an Eclipse 80i microscope (Nikon, Japan). Five fields of view were randomly selected from each section, and the thickness of the lamina propria (interstitial oedema index) from the surface epithelial basement membrane to the closest minor salivary glands was measured. The interstitial oedema index for each patient was calculated as the average of the scores of the interstitial oedema index of the uvula in five microscopic fields. The interstitial oedema index scores in the OSA group were compared with those in the control group and expressed as a relative fold change relative to the control group. The haematoxylin and eosin stain was used to evaluate the severity of inflammation. Two pathologists who were blinded to the sample background assigned a total inflammation score to each part of the uvula as follows: 0, normal; 1, inflammatory infiltration of neutrophils and lymphocytes accounting for less than 25 per cent of the entire section; 2, inflammatory infiltrate between 25–50 per cent of the entire section; 3, inflammatory infiltrate between 50–75 per cent of the entire section; and 4, inflammatory infiltrate more than 75 per cent of the entire section. The inflammation score for each patient was calculated as the average of the scores of all the microscopic fields of the uvular section.
Masson's trichrome stain was used to determine the degree of collagen deposition in the uvula. Masson's trichromatic staining intensity (0, 1+, 2+, 3+ or 4+) was used to semi-quantitatively determine the intensity score of each field of view of the uvular samples, from the adventitia layer to the subepithelial basement membrane of the uvula. The Masson's trichrome staining intensity score of each patient was calculated as the average of all the microscopic visual field scores of the uvular slices.
Staining for MMP-9 and TGF-ß in the uvula
A BenchMark XT automatic immunostaining machine (Roche Diagnostics and Ventana Medical Systems, Tucson, Arizona, USA) was used to stain the paraffin-embedded sections (thickness of 4 μm) of the uvula with MMP-9 and TGF-ß. An Eclipse 80i microscope, a charger coupler device camera (QImaging, Surrey, Canada) and Nikon's NIS-Elements software (Nikon, Tokyo, Japan) were used to capture immunostained images. The immunohistochemical results for MMP-9 and TGF-ß were evaluated by a semi-quantitative method, which was used to score the histological staining intensity of the uvular samples. We determined the staining intensity (0, 1+, 2+ or 3+) of each cell in the fixed field. The histological staining intensity was based on the sum of the individual histological staining intensity score for each intensity level observed. Through this method, we calculated the percentage of cells with each staining intensity level and finally used the following formula to determine the histological staining intensity: (1 × (per cent cells 1+) + 2 × (per cent cells 2+) +3 × (per cent cells 3+)). The final score was between 0 and 300. The histological staining intensity score of the immunostaining intensity for each patient was calculated as the average of the scores of the immunostaining intensity of the uvula in five microscopic fields. The histological staining intensity scores for MMP-9 and TGF-ß in the OSA group were compared with those in the control group and expressed as a relative fold change relative to the control group.
Western blot analysis
Uvula tissue samples were homogenised by manual crushing with a scissor in a radioimmunoprecipitation assay lysis buffer supplemented with protease inhibitors, followed by sonication. Proteins were loaded into 4–12 per cent Bis-Tris Gels (Invitrogen, Carlsbad, USA), transferred onto polyvinylidene fluoride membrane (GE Healthcare, Milwaukee, USA) and subsequently immersed with 5 per cent bovine serum albumin in Tris-buffered saline with 0.1 per cent Tween® 20 detergent for 1 hour. Antibodies used in this study were purchased and included the following: fibrinogen, MMP-9, VEGF, TGF-ß, p38 MAPK, SMAD 2/3, p-AKT and p-JNK (1:2000; Cell Signaling Technology, Beverly, USA), β-actin and glyceraldehyde 3-phosphate dehydrogenase (1:5000; Novus Biologicals, Littleton, USA). Following incubation with the secondary antibodies (1:2000; Cell Signaling Technology, Beverly, USA), the Amersham ECL Prime Western Blotting Detection Kit (GE Healthcare, UK) was used to detect the signals. Target protein bands were normalised to β-actin or glyceraldehyde 3-phosphate dehydrogenase as an internal standard and quantified using Image J software (National Institutes of Health, Bethesda, USA).
RNA isolation and assay
To isolate RNA from the uvula, tissue samples were extracted with QIAamp RNeasy Mini Kit (Qiagen, Hilden, Germany). The primer sets targeting different genes (MMP-9, VEGF, TGF-ß, SMAD 2/3, AKT, JNK, p38 MAPK and β-actin) were designed and tested. Real-time polymerase chain reaction amplifications were performed using the 1Step RT qPCR Green ROX H Kit (highQu GmbH, Kraichtal, Germany) and the Applied Biosystems 7900HT Fast Real-Time PCR (Applied Biosystems, Foster City, USA) machines, according to the manufacturers’ instructions. Cycle conditions were 1 cycle of 55°C for 10 minutes (for cDNA synthesis) and 1 cycle of 95°C for 2 minutes (initial denaturation), followed by 40 cycles of 95°C for 5 seconds and 65°C for 20 seconds. All samples were tested in triplicate for polymerase chain reaction. Fluorescence was quantified as a cycle threshold value, defined as the cycle number at which the detected fluorescence exceeds the threshold value. Messenger RNA (mRNA) expression was reported as the ratio of target gene cycle threshold to β-actin cycle threshold. SDS RQ Manager (version 1.2.1) statistical analysis software (Applied Biosystems) was used to analyse the data.
Data analysis
All values were expressed as the mean ± standard deviation. Student's t-test was used for pairwise comparisons. SPSS® statistical analysis software (version 14.0) was used to perform all statistical analysis, and p-values of less than 0.05 were considered statistically significant.
Results
Patient characteristics
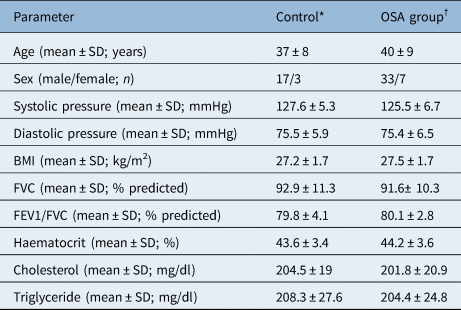
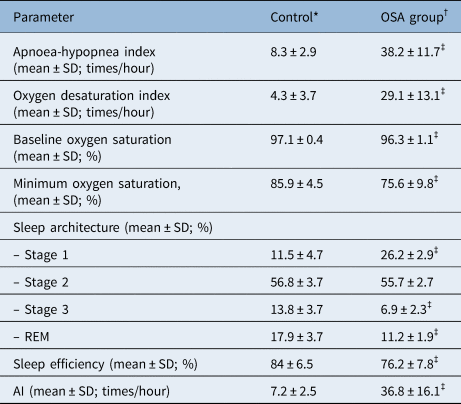
Before UPPP treatment, the patient characteristics (systolic and diastolic blood pressure, BMI, cholesterol, and triglyceride levels) and lung function test results in the OSA and control groups at baseline showed no significant differences (Table 1). The OSA group had a higher apnoea-hypopnea index, oxygen desaturation index, percentage of stage 1 sleep and arousal index than the control group. Similarly, the OSA group had a lower percentage of REM and stage 3 sleep, low oxygen saturation and poor sleep efficiency compared with the control group (Table 2).
Characteristics and pulmonary function test results

*n = 20; †n = 40. Student's t-test was applied for comparison between control and OSA group. BMI = body mass index; FVC = forced vital capacity; FEV1 = forced expiratory volume in 1 second
Results of sleep study

*n = 20; †n = 40; ‡p < 0.05, for difference between control and obstructive sleep apnoea (OSA) group. Student's t-test was applied for comparison between control and OSA group. REM = rapid eye movement; AI = arousal index.
Histology and remodelling of the uvula
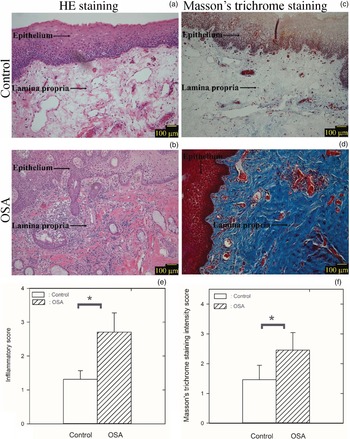
The OSA group showed more severe inflammation than the control group, which was characterised by hyperaemia, interstitial oedema and increased inflammatory cell infiltration in the lamina propria of the uvula (Figure 1a and b). The inflammatory score of the lamina propria of the uvula was significantly higher in the OSA group than in the control group. The mean inflammation scores of the uvula were 2.7 ± 0.6 and 1.3 ± 0.3 in the OSA group and control group, respectively (Figure 1e). Additionally, the mean interstitial oedema index in the lamina propria of the uvula was significantly higher in the OSA group than in the control group. The mean fold-change in the mean interstitial oedema index of the lamina propria of the uvula relative to the control group was 1.4 ± 0.2-fold in the OSA group.
Histopathology images of the uvula representing two experiments: (a and c) Haematoxylin and eosin (HE) staining (×100); (b and d) Masson's trichrome staining (×100); (e) Mean inflammatory score of the uvula; and (f) mean Masson's trichromatic staining intensity scores of the uvula were significantly higher in the obstructive sleep apnoea (OSA) group than in the control group (*p < 0.05). Scale bar = 100 μm

The Masson's trichrome staining intensity score of the uvula was significantly higher in patients in the OSA group than in those in the control group (Figure 1c and d). The mean Masson's trichrome staining intensity score of the uvula was 2.5 ± 0.6 in the OSA group and 1.5 ± 0.5 in the control group (Figure 1f).
Staining for TGF-ß and MMP-9 in the uvula
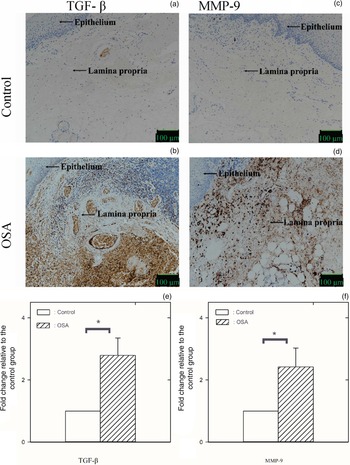
The OSA group demonstrated a higher histological staining intensity score of immunohistochemical staining intensity for TGF-β (Figure 2a and b) and MMP-9 in the uvula than in the control group (Figure 2c and d). In the OSA group, the mean fold change in the histological staining intensity score of TGF-β and MMP-9 relative to the control group was 2.8 ± 0.6-fold and 2.4 ± 0.6-fold, respectively (Figures 2e and f).
Immunohistochemical staining of the uvula in two experiments: (a and c) for TGF-ß (×200) and (b and d) for MMP-9 (×200); (e) mean fold change in the histological intensity score (fold change with respect to the control) for TGF-ß in the uvula relative to the control; and (f) mean fold change in the histological intensity score (fold change with respect to the control) for MMP-9 in the uvula relative to the control was significantly higher in the obstructive sleep apnoea (OSA) group than in the control group (*p < 0.05). Scale bar = 100 μm

Western blot analysis
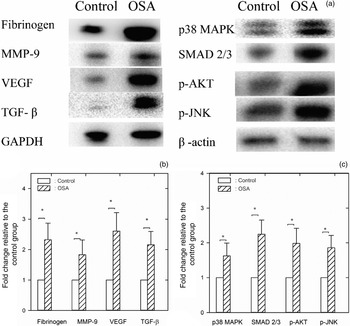
The expression (fold change with respect to the control) of fibrinogen, MMP-9 and VEGF proteins was consistently higher in the OSA group than in the control group (Figure 3). The expression levels (fold change with respect to the control) of the regulatory proteins TGF-β, p38 MAPK, SMAD 2/3, p-AKT and p-JNK were also consistently higher in the OSA group than in the control group (Figure 3a). The mean fold change in the expression of fibrinogen, MMP-9 and VEGF relative to the control group was 2.3 ± 0.5-fold, 1.8 ± 0.5-fold and 2.6 ± 0.6-fold, respectively, in the OSA group (Figure 3b). The mean fold change in the expression of TGF-β, p38 MAPK, SMAD 2/3, p-AKT and p-JNK relative to the control group was 2.2 ± 0.4-fold, 1.6 ± 0.4-fold, 2.3 ± 0.4-fold, 2.0 ± 0.4-fold, and 1.9 ± 0.4-fold, respectively, in the OSA group (Figures 3b and c).
(a) Western blot analysis for the protein expression of fibrinogen, MMP-9 and VEGF in the uvula in the two experiment groups and Western blot analysis for the expression of the regulatory proteins TGF-ß, p38 MAPK, SMAD 2/3, p-AKT and p-JNK in the uvula in the two experimental groups. (b and c) Relative changes in the protein expression (fold change with respect to the control) of fibrinogen, MMP-9, VEGF, TGF-ß, p38 MAPK, SMAD 2/3, p-AKT and p-JNK in the uvula were significantly higher in the obstructive sleep apnoea (OSA) group than in the controls (*p < 0.05). GAPDH = glyceraldehyde 3-phosphate dehydrogenase

Messenger RNA expression in the uvula
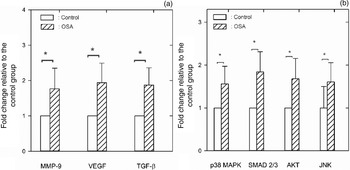
On performing real-time reverse transcription-polymerase chain reaction, the mRNA expression levels of MMP-9 and VEGF, as well as the mRNA expression levels of the regulatory proteins TGF-β, p38 MAPK, SMAD 2/3, AKT and JNK relative to β-actin (fold change with respect to the control), were consistently higher in the OSA group than in the control group (Figure 4a and b).
(a) Relative changes in the messenger RNA expression of MMP-9, VEGF and TGF-ß in the uvula were greater in the obstructive sleep apnoea (OSA) group than in the control group. (b) Relative changes in the messenger RNA expression of p38 MAPK, SMAD 2/3, AKT and JNK in the uvula were greater in the OSA group than in the control group. *p < 0.05 for comparison between the OSA and control groups

Discussion
In this study, we observed that the OSA group showed more severe inflammation, which was characterised by congestion, interstitial oedema and increased inflammatory cell infiltration in the lamina propria of the uvula, than the control group. Additionally, the OSA group exhibited increased Masson's trichrome staining intensity in the lamina propria of the uvula compared with the control group. The histological staining intensity scores of TGF-β and MMP-9 in the uvula were higher in the OSA group than in the control group. The protein expression and mRNA expression levels of the pro-inflammatory and pro-fibrotic cytokines (including fibrinogen, VEGF and MMP-9) and their regulatory proteins (including TGF-β, p38 MAPK, SMAD 2/3, AKT and JNK) were higher in the OSA group than in the control group.
Several studies indicated that nasal lavage, induced sputum and exhaled breath condensate specimens have increased inflammatory markers in OSA patients.Reference Carpagnano, Spanevello, Sabato, Depalo, Turchiarelli and Foschino Barbaro20–Reference Sariman, Levent, Aksungar, Soylu and Bektaş22 Histopathological examination of the uvular tissue obtained from OSA patients treated with UPPP showed that inflammation, subepithelial oedema, vascular congestion and inflammatory cell infiltration in the upper respiratory tract tissue were significantly increased, and the surface area of the connective tissue papilla that provides anchorage to the epithelium decreased.Reference Paulsen, Steven, Tsokos, Jungmann, Müller and Verse8,Reference Berger, Gilbey, Hammel and Ophir14,Reference Berger, Finkelstein and Ophir16 Berger et al. demonstrated that there was significantly more connective tissue in patients with moderate OSA than in the control group.Reference Berger, Gilbey, Hammel and Ophir14,Reference Berger, Finkelstein and Ophir16 Wasicko et al. demonstrated vasodilation, decreased pharyngeal cross-sectional area and increased upper airway collapsibility in anesthetised cats.Reference Wasicko, Hutt, Parisi, Neubauer, Mezrich and Edelman23
• Obstructive sleep apnoea (OSA) patients showed greater uvular inflammation than controls
• OSA patients showed increased collagen deposition in the uvula compared with controls
• The uvula of OSA patients showed higher immunohistochemical staining intensity for TGF-ß and MMP-9 than controls
• Protein and messenger RNA expression of pro-inflammatory and pro-fibrotic cytokines was higher for OSA patients than for controls
Sekosan et al. found that the white blood cell count in the lamina propria of the uvula was significantly higher in OSA patients than in the control group.Reference Sekosan, Zakkar, Wenig, Olopade and Rubinstein9 Boyd et al. claimed that the increased inflammatory cells in the upper airway mucosa and muscle tissue of OSA patients were different, comprising mainly CD4+ and activated CD25+ T cells in the muscle tissue and mainly CD8+ and activated CD25+ T cells in the mucosa.Reference Boyd, Petrof, Hamid, Fraser and Kimoff24 Loubaki et al. reported that there was increased CD4+ T-cell infiltration in the subepithelial area associated with a disorganised elastin fibre network in the uvular tissue.Reference Loubaki, Jacques, Semlali, Biardel, Chakir and Sériès25 These inflammatory patterns may be partly caused by tissue damage after repeated upper airway flutter.Reference Almendros, Acerbi, Puig, Montserrat, Navajas and Farré5 Sériès et al. reported that compared with the control group, CD4+ and CD8+ lymphocytes and macrophages in the uvular tissues of morbidly obese OSA patients increased. Moreover, the elastin fibre network disorganisation score demonstrated a positive correlation with the apnoea-hypopnea index. These results suggested that OSA is related to the structural changes in the extracellular matrix of the upper respiratory tract tissues.Reference Sériès, Chakir and Boivin26 In this study, we observed that patients in the OSA group exhibited increased upper airway inflammation and airway remodelling characterised by an increased inflammatory score and increased collagen deposition in the lamina propria of the uvula before UPPP, compared with those in the control group.
Almendros et al. demonstrated that the mechanical stimulus of snoring-like vibration applied for three hours triggered upper airway inflammation and induced the overexpression of TNF-α and neutrophil attractant MIP-2 in the soft-palate tissues of Sprague-Dawley rats compared with controls.Reference Almendros, Acerbi, Puig, Montserrat, Navajas and Farré5 Kimoff et al. observed that the expression of IL-1α, IL-6, TGF-β, and RANTES, as well as oxidative stress (increased protein carbonylation) and connective tissue deposition in the submucosal and perimuscular tissues of the upper airway, increased in severe OSA patients compared with mild OSA patients.Reference Kimoff, Hamid, Divangahi, Hussain, Bao and Naor27
Systemic inflammation has been reported in OSA patients, which is characterised by increased plasma levels of C-reactive protein, IL-1α, IL-6, TNF-α, adhesion molecules and reactive oxygen species.Reference Lavie4,Reference Kimoff, Hamid, Divangahi, Hussain, Bao and Naor27,Reference Hatipoğlu and Rubinstein28 The upper airway represents a potential source of inflammatory mediators, which are easily released into the circulatory system, leading to a systemic inflammatory state.Reference Loubaki, Jacques, Semlali, Biardel, Chakir and Sériès25,Reference Kimoff, Hamid, Divangahi, Hussain, Bao and Naor27,Reference Hatipoğlu and Rubinstein28 Kataoka et al. found that serum TNF-α level decreased after one month of nasal CPAP treatment.Reference Kataoka, Enomoto, Kim, Yokoi, Fujimori and Sakai29 Furthermore, the TNF-α plasma level similarly decreased after effective surgical treatment in OSA patients.Reference Kataoka, Enomoto, Kim, Yokoi, Fujimori and Sakai29 Loubaki et al. reported that the TNF-α expression was higher in whole uvular protein extracts from the OSA group compared with those from the control group.Reference Loubaki, Jacques, Semlali, Biardel, Chakir and Sériès25 In this study, we observed that the immunohistochemical staining intensity of TGF-β and MMP-9 in the uvula as well as the protein and mRNA expression levels of pro-inflammatory and pro-fibrotic cytokines (including VEGF, and MMP-9) and their regulatory proteins (including TGF-β, p38 MAPK, SMAD 2/3, AKT and JNK) in the OSA group were increased and upregulated, leading to further inflammation and upper respiratory tract remodelling.
Even treatment for snoring and mild OSA using cutting radiofrequency surgery causes minimal histological and ultrastructural collateral injuries to the soft palate. The overall average depth of injury was 0.15 mm, and the maximum depth of tissue injury was 1 mm. In this study, the uvula was similarly resected. The samples were obtained from redundant mucosa at the anterior edge of the velum along with the lower end of the uvula. The procedure was performed using cold knife dissection, and the sample was resected in an identical manner. Notably, we did not use electrocautery, laser or radiofrequency ablation to avoid thermal injury to the samples. However, the study is limited as we did not evaluate the histopathological changes in the resection margin of uvula tissues or assess the local tissue effects by employing scanning electron-microscopy to investigate the resection margin of uvula tissues at the cellular level.Reference Stimpson and Kotecha30
In conclusion, the molecular signalling involved in upper airway remodelling (inflammation, remodelling and expression of pro-inflammatory and pro-fibrotic cytokines in the uvula) is enhanced in patients with OSA.
Acknowledgements
This work was funded by a grant from the Ministry of Science and Technology (Grant MOST 109-2314-B-303 -028; approval number 09-P-006).
Competing interests
None declared