


1. INTRODUCTION
Only a handful of microfossil records from ice cores and surface snow samples are available at present (overview in Table 1), probably because the records are difficult to retrieve and the concentrations of the target material are low. In contrast to the more traditional archives of palynology (e.g. lakes and peat bogs), ice archives have specific advantages. For instance, they are well suited to address vegetation dynamics and land-use activities at subcontinental scales (Liu and others, Reference Liu, Yao and Thompson1998), since drilling sites on high-alpine glaciers are remote from microfossil sources and undesired local biases are absent. Further, they do not suffer from fine-scale disturbances that may affect lakes or peatlands such as soil erosion and related reworking issues. Ice cores usually provide excellent chronologies and high temporal resolution records, especially for the most recent 200 years where age-depth models can rely on absolutely-dated reference horizons (e.g. volcanic layers) and annual layer counting (e.g. Preunkert and others, Reference Preunkert, Wagenbach and Legrand2003; Olivier and others, Reference Olivier2006; Jenk and others, Reference Jenk2009; Sigl and others, Reference Sigl2009; Herren and others, Reference Herren2013; Konrad and others, Reference Konrad, Bohleber, Wagenbach, Vincent and Eisen2013). Multiproxy climate and environmental evidence from the same cores (e.g. temperature reconstructions or chemical tracers for environmental variables; Eichler and others, Reference Eichler2011) contribute to assess past ecosystem dynamics.
Methods for microfossil extraction from ice, grouped according to the main water elimination procedure with an indication of marker use
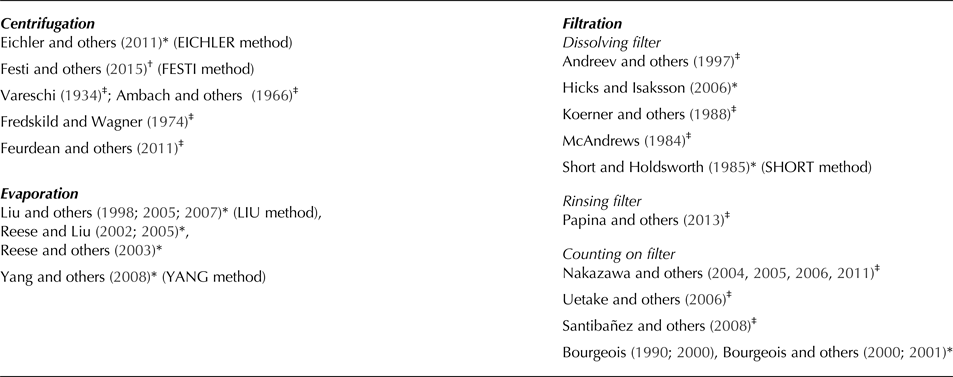
Approaches used for the method comparison in this paper with method-name in brackets. Filtration-based approaches are divided in methods that chemically dissolve the filter, rinse the microfossils with water from the filter surface or methods where microfossils are directly counted on the filter.
* Marker added, †No marker added, ‡No information available.
Glaciers contain extremely low microfossil concentrations compared with lake and mire sediments, hence large ice volumes are needed for quantitative microfossil analyses. Furthermore, given the difficulty of accessing the often remote drilling sites, ice core material is usually very limited and therefore it is crucial to extract a maximum of microfossils for analysis. This provides a major challenge for sample processing. Different methods have been used in the past to concentrate and extract pollen from ice or snow samples with three main water elimination approaches described in the literature: evaporation, centrifuging followed by decanting of the supernatant liquid and filtering methods (see Table 1 for an overview of the available methods). No qualitative or quantitative comparison of the different extraction methods is available so far. Differences among the approaches may impede comparison of microfossil ice core results, but this potential source of uncertainty is unexplored. Thus, the situation is very different than for pollen analysis in lake and mire sediments with well-recognized preparation procedures and protocols (Faegri and Iversen, Reference Faegri and Iversen1989; Moore and others, Reference Moore, Webb and Collison1991; Lang, Reference Lang1994).
Marker spike application is a long-established and reliable method to estimate microfossil concentrations and influx (Benninghoff, Reference Benninghoff1962; Stockmarr, Reference Stockmarr1971; Peck, Reference Peck1974; Birks and Birks, Reference Birks and Birks1980; Maher, Reference Maher1981; Birks and Gordon, Reference Birks and Gordon1985; Moore and others, Reference Moore, Webb and Collison1991). Its use additionally allows to check for microfossil losses during sample preparation (Stockmarr, Reference Stockmarr1971). Most of the previous microfossil records from ice cores rely on marker application (e.g. Liu and others, Reference Liu, Yao and Thompson1998; Eichler and others, Reference Eichler2011; see Table 1 for an extensive list). Exceptionally, its use has been neglected in recent ice studies (Festi and others, Reference Festi2015) because the utility of this standard palynological approach has been questioned (Festi and others, Reference Festi, Hoffmann and Luetscher2016). Here we address existing knowledge gaps and open questions in respect to the effects of sample preparation methods on pollen assemblages from ice core records with the following aims: (1) to compare different palynological extraction methods for snow, firn and ice core records; (2) to assess the risk of microfossil losses during the extraction procedure and thus the utility of markers in ice core samples; and (3) to propose an improved extraction protocol to gain reliable, accurate and comparable microfossil results from snow and ice samples with a minimum of loss during extraction.
2. MATERIALS AND METHODS
2.1. Marker tablets
To quantify the losses during the different extraction procedures, we added two different markers to the samples, one before and another after the physical and chemical treatments. We used Lycopodium clavatum (Batch number 3862 with 9666 spores per tablet ± 671 Std dev.) and Eucalyptus marker tablets (Batch number 106720 with 13500 pollen grains ± 210) provided by University of Lund (Maher, Reference Maher1981). Before proceeding with microfossil extraction, we tested the reliability of the marker tablets by mixing one tablet of Lycopodium marker and one tablet of Eucalyptus marker. Ten of these marker tablet pairs were dissolved in 10% HCl following standard procedures for palynology (e.g. Moore and others, Reference Moore, Webb and Collison1991). The marker suspensions were mounted on microscopic slides. We counted a sum of 1000 grains (Lycopodium + Eucalyptus) to estimate the accuracy of the expected marker ratio between Lycopodium and Eucalyptus grains.
2.2. Microfossil extraction methods
2.2.1. Snow replicate samples
To compare the different microfossil extraction methods from snow and ice, we collected 10 surface snow samples (uppermost 30 cm) of ~4 kg at Jungfraujoch (Swiss Alps, 46° 32′ 54.6″ N, 7° 58′ 58.8″ E, 3400 m a.s.l.) in July 2016 after conifers flowered in late spring (Lauber and Wagner, Reference Lauber and Wagner2012). The 10 samples (Jung-1 – Jung-10) were transported frozen to the laboratory and separated in small pieces in the freezing chamber at −17°C to avoid melting. The pieces were homogenized well before dividing them into six replicate subsamples, resulting in a total of 60 test samples. Each of the six replicate samples weighed between 370 and 400 g (corresponding to a volume of 370–400 mL). The microfossil extraction followed five methods from the literature covering the main physical water reduction procedures of evaporation (Liu and others, Reference Liu, Yao and Thompson1998; Yang and others, Reference Yang, Tang, Bräuning, Davis, Shao and Jingjing2008), centrifuging and decanting (Eichler and others, Reference Eichler2011; Festi and others, Reference Festi2015), and filtration (Short and Holdsworth, Reference Short and Holdsworth1985; Fig. 1), followed by a chemical treatment involving several centrifuging steps. For simplicity, we labeled the applied methods using the first author's name in the publications (e.g. LIU method for the method described in Liu and others, Reference Liu, Yao and Thompson1998; and accordingly, YANG, EICHLER, FESTI and SHORT method; Table 1). The evaporation-based methods LIU and YANG differ in a HF treatment included in the latter method, which requires additional steps for the laboratory protocol. The EICHLER and FESTI methods follow a comparable protocol except for the addition of Lycopodium tablets and an alcohol treatment to lower the water surface tension in the samples used by FESTI. Microfossil concentration methods based on filtration, with direct counts of microfossils on the filter, were not considered in this study due to the strong limitations in the taxonomic resolution that can be achieved (Nakazawa and others, Reference Nakazawa2005).
Flowcharts for ice and snow sample extraction methods: BRUGGER = this study, LIU = Liu and others (Reference Liu, Yao and Thompson1998), YANG = Yang and others (Reference Yang, Tang, Bräuning, Davis, Shao and Jingjing2008), EICHLER = Eichler and others (Reference Eichler2011), FESTI = Festi and others (Reference Festi2015), SHORT = Short and Holdsworth (Reference Short and Holdsworth1985). Right column for each method indicates original method description. Left column (shaded in dark grey) indicates required steps to add a second marker (Eucalyptus) and the deviation from the original protocol for the standardized method comparison of this paper with two markers. CND = centrifuging, shock-freezing in liquid nitrogen, decanting, CD = centrifuging, decanting. C2H6O = ethanol, C2H4O2 = glacial acetic acid, C2H6O3 = acetic anhydride, H2SO4 = sulphuric acid, dem. H2O = demineralized water.

We tested a new extraction method, which we refer to as BRUGGER method (Fig. 1). This method starts with evaporation in a drying cabinet (1 week at 70°C for 400 mL sample volume) to reduce the water content to ~20 mL. The samples are then transferred to 50 mL tubes including careful rinsing of the original containers. After each centrifugation step, we shock-freeze the bottom liquid of the tubes, which contains the sunken microfossils, with liquid nitrogen and decant the remaining water. Subsequently, the samples are transferred to 15 mL tubes. Acetolysis and a 10% KOH treatment follow before mounting the samples in glycerine (for details on acetolysis see Moore and others, Reference Moore, Webb and Collison1991). The protocol is comparable with the method described in Liu and others (Reference Liu, Yao and Thompson1998) but it includes the step of shock-freezing the bottom liquid after each centrifugation step to avoid material losses. Additionally, we add a drop of ethanol (C2H6O) to the centrifuge tubes before centrifuging for all protocol steps with water to reduce floating of microfossils due to water surface tension effects (Dietrich, Reference Dietrich1923). Finally, to test for microfossil losses during the physical and chemical procedure we added one Lycopodium tablet to each snow replicate sample prior to sample processing (Stockmarr, Reference Stockmarr1971). After sample processing, we added one Eucalyptus marker tablet and we applied once more 10% HCl to dissolve the tablet before the last centrifugation step (Fig. 1). Lycopodium spores and Eucalyptus pollen are nonvesiculate grains and have a diameter of ~25 and 20 µm, respectively.
2.2.2. High-alpine ice core samples
To further evaluate our new method, we applied it to high-alpine ice core samples from Colle Gnifetti glacier. This glacier saddle forms part of the Monte Rosa massive in the Swiss Alps (45°55′50″N, 7°52′33″E, 4450 m a.s.l.). The ice core was drilled in September 2015 and stored frozen at the Paul Scherrer Institute in Villigen. In total 18 samples from adjacent core segments of varying length (Samples Colle-1 – Colle-18) spanning 2015–01 AD were cut in the freezing chamber. We included one additional replicate sample (Colle-15 replicate) from core segment 15 to examine the reproducibility of the results. Each sample contained between 230 and 870 g of ice. The samples were processed identically to the Jungfraujoch snow samples following the BRUGGER method, involving the same protocol modification for the second marker treatment (Fig. 1).
2.3. Pollen analysis
A pollen sum of 500 grains per sample was counted except for the high-alpine ice samples from Colle Gnifetti for which we reached a pollen sum of 350 due to low pollen concentrations. Pollen identification was conducted under a light microscope at 400× magnification following Beug (Reference Beug2004) and the reference collection of the Institute of Plant Sciences at University of Bern. Pollen percentage calculations are based on the terrestrial pollen sum, and concentrations were standardized to one liter of water. Lycopodium and Eucalyptus markers were counted alongside pollen and we obtained a minimum sum of 1000 marker grains for each sample.
2.4. Numerical analysis
We estimated average deviation of marker loss in percentages from the ideal marker ratio Lycopodium : Eucalyptus (0.72) based on the mean content of one marker tablet with one standard deviation of each marker to indicate the range of the ratio uncertainty for the tablets (0.66–0.78). We calculated coefficients of determination (R 2) for the marker ratios for each extraction method of the snow replicate samples and for the marker ratio of the high-alpine ice core samples as well as for pollen percentages of the two Colle Gnifetti replicate samples of segment Colle-15, with all pollen types >1%, including and excluding vesiculate pollen taxa. To test statistically potential differences between the effects of the extraction methods, we conducted one-way ANOVA followed by a Tukey-Kramer post-hoc test for the marker ratios and the vesiculate pollen percentages for all 60 snow samples grouped by extraction methods.
We performed ordination analyses to visualize the distance between the pollen assemblages of the 60 snow samples. The short length of the first axis (1.48 Std dev. units) of a detrended correspondence analysis (DCA, by segments) for the pollen percentage dataset of the snow replicate samples justifies using linear ordination methods (ter Braak and Prentice, Reference Ter Braak and Prentice1988). Principal component analysis (PCA, ter Braak and Šmilauer, Reference Ter Braak and Šmilauer2002) was performed based on a correlation matrix for pollen percentages (all taxa >1%), which is the standard unit to present pollen data (Maher, Reference Maher1981; Faegri and Iversen, Reference Faegri and Iversen1989). Additionally, we conducted PCA with the same explanatory variable based on a covariance matrix for pollen concentrations (grains l−1) standardized by norm to assess potential absolute differences of single pollen types independently from each other (data not shown). Ordinations were carried out using CANOCO version 4.5 (ter Braak and Šmilauer, Reference Ter Braak and Šmilauer2002).
3. RESULTS AND INTERPRETATION
3.1. Marker tablet reliability
Given that the tablets completely dissolved in HCl, the added marker did not alter the quality of the samples. Instead, we assume that the marker spores and pollen increase the quality by adding more mass to the samples, thus contributing mass to and strengthening the organic pellet formed at the base of the centrifuge tubes (Moore and others, Reference Moore, Webb and Collison1991). The tablets contained only the declared spores and pollen and the screening of the entire microscopic slides yielded no foreign materials (e.g. other pollen, charcoal) as potentially deriving from contamination during the tablet production process (see Festi and others, Reference Festi, Hoffmann and Luetscher2016). The ratio of Lycopodium/Eucalyptus grains was in all 10 samples of the marker reliability test within the expected ratio (0.66–0.78 Lycopodium/Eucalyptus) confirming that the marker tablets are reliable to use for our quantitative investigations.
3.2. Comparison of microfossil extraction methods with standard snow samples
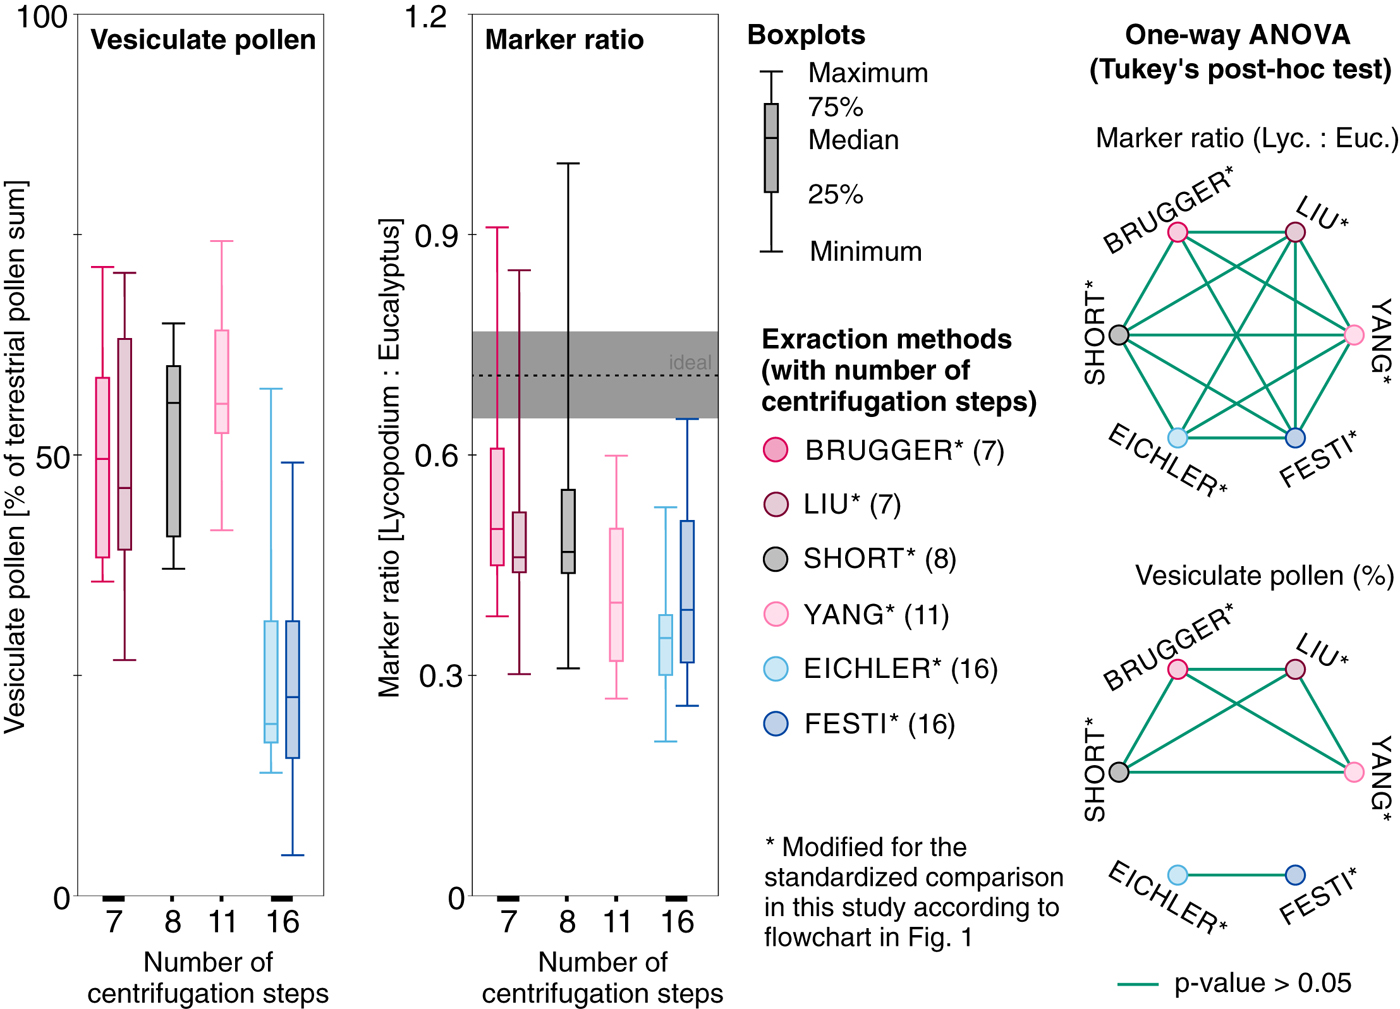
All 60 samples yielded countable microfossil slides. The average marker ratio Lycopodium/Eucalyptus in the replicate snow samples processed with the BRUGGER method is 0.56 (22.1% average deviation from the ideal marker ratio i.e. 0.72). The number of counted Lycopodium spores is strongly correlated with the counted Eucalyptus pollen (R 2 of 0.94; Figs 2 and 3), suggesting that this pollen loss resulted in a systematic (and thus predictable) shift in the estimated pollen concentrations. Slightly higher marker deviation with 24% (average ratio = 0.55) is reached with the filtration-based SHORT method and 29.8% deviation (average ratio = 0.51) with the related LIU method, while the R 2 of 0.87 reached in both methods is somewhat reduced compared with the BRUGGER method (R 2 of 0.94, Fig. 2). Extraction methods which involve many centrifugation steps without bottom freezing (EICHLER, FESTI, YANG) result in higher average marker deviation and lower R 2 (Figs 2 and 3, marker ratio = 0.36–0.42, 41–50% deviation, R 2 = 0.81–0.86) suggesting that, on average, considerable numbers of Lycopodium spores (and thus of the targeted microfossils) are lost during water removal and chemical treatment and that the loss variability is larger with these extraction methods. However, ANOVA for the marker ratio differences between the extraction methods (Fig. 3) suggests that only the best performing BRUGGER and the least performing EICHLER method yield statistically significant differences in the mean marker ratios.
Marker ratio of Lycopodium (added prior to sample processing) to Eucalyptus (added before mounting in glycerine) for standard snow replicate samples from Jungfraujoch (Jung-1 to Jung-10). Sample preparation according to flowcharts in Figure 1 (modified for the standardized method comparison with two markers). Ideal marker relationship (dashed lines) with confidence intervals for marker tablet uncertainties based on standard deviations of tablet content (grey). Marker ratio and average deviation of markers from ideal marker ratio (% of 0.72) indicating average sample loss during processing with R 2 as a measure of correlation strength indicating loss variability.

Left: Boxplots for vesiculate pollen (as percentages of the terrestrial pollen sum, left side) and the counted marker ratio (Lycopodium : Eucalyptus with indication of the ideal marker ratio and one standard deviation uncertainty in grey, right side) for the different extraction methods sorted according to number of involved centrifugation steps including the physical and chemical treatment for 400 mL water (see numbers on the x-axis and in brackets in the method description) applied to standard snow replicate samples from Jungfraujoch. Right: One-way ANOVA followed by Tukey-Kramer post-hoc test results of marker ratios (top) and vesiculate pollen percentages among the different extraction methods. Circles joined by green lines indicate samples for which the tests did not provide evidence for statistical differences at the p= 0.05 level. All protocols modified from original lab protocols for the standardized comparison with a second marker (see flowchart in Fig. 1).
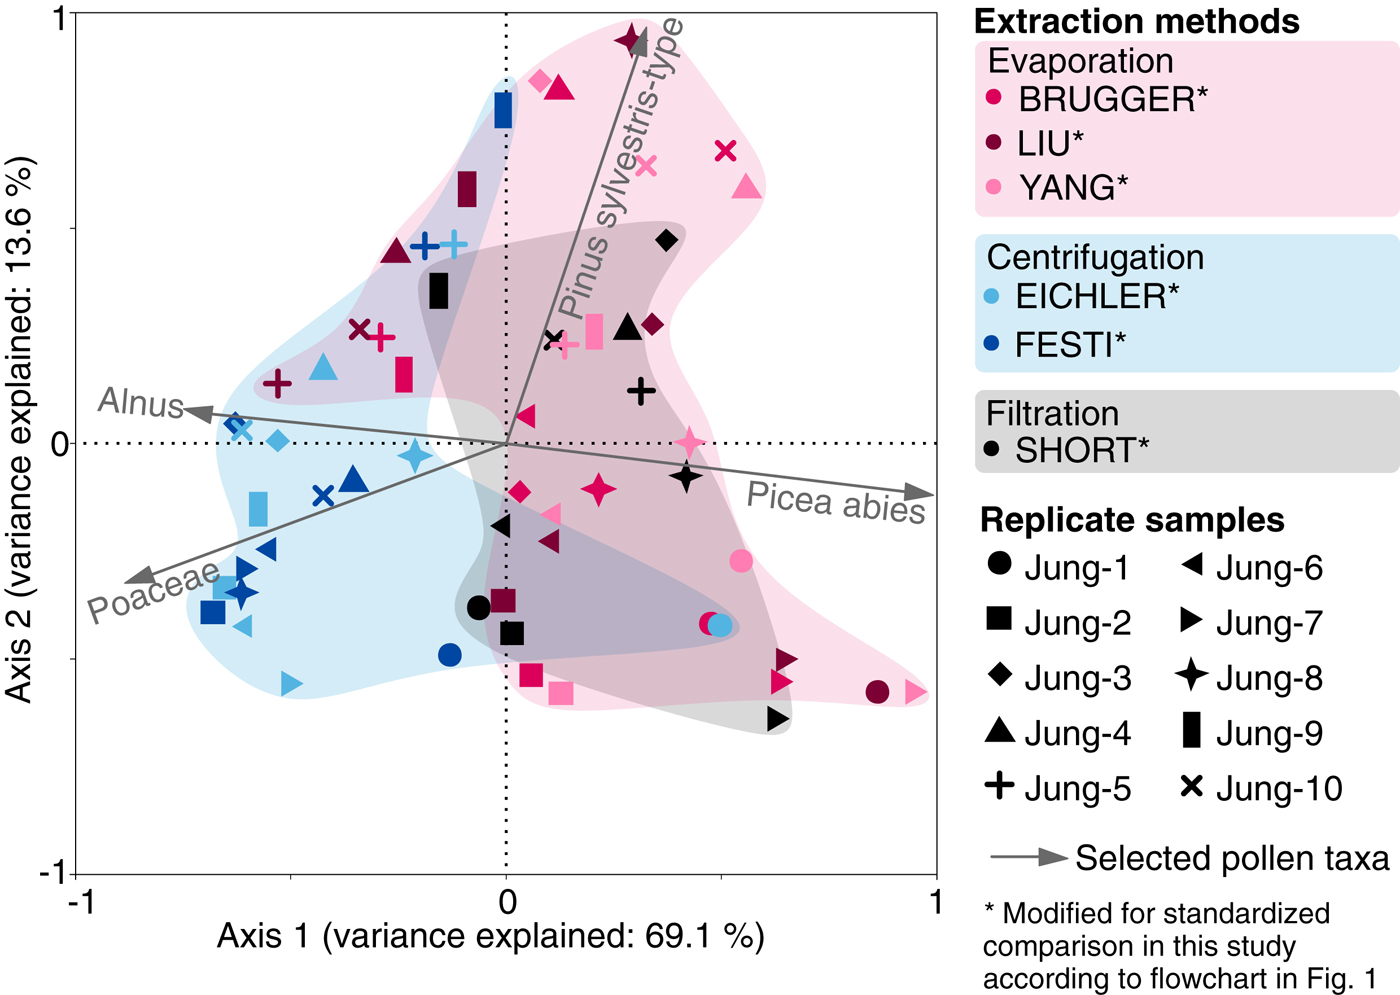
The pollen assemblages in all samples are dominated by Picea abies, Pinus sylvestris-type (both vesiculate = pollen with air bladders), Alnus and Poaceae with lower amounts of Betula, Plantago lanceolata-type, Cyperaceae and small pollen grains of Castanea and Urtica (Fig. 4). Picea abies and Pinus sylvestris-type pollen percentages and concentrations are generally higher in samples processed with evaporation- (BRUGGER, LIU, YANG) or filtration-based (SHORT) methods compared with samples processed with solely centrifugation-based methods (EICHLER, FESTI), suggesting that centrifugation may reduce vesiculate pollen grains compared with nonvesiculate pollen grains (Fig. 4). The large and relatively constant amount of Urtica (grain diameter ~10–15 µm, 15–20% abundance in all replicates from Jung-2) and Alnus, Poaceae and Betula (grain diameter 20–30 µm) in all replicate samples indicates that the six tested methods do not induce biases related to pollen grain size in the small to medium size range. Assessing differences in the amount of large nonvesiculate pollen (>50 µm, e.g. Larix) was not possible as these pollen types were too rare in our snow samples. The pollen concentrations in the snow replicate samples vary between 12000 and 65000 grains l−1 (average 26000 grains l−1) except samples Jung-4 and Jung-10 which contain five to 10 times higher pollen concentrations (Figs 3 and 4). Nonvesiculate pollen shows only small variability among snow replicate samples while vesiculate pollen concentrations show a much larger variability confirming that vesiculate pollen is mainly responsible for the differences in the percentages of the replicate samples, and therefore also of the main pollen percentage diagram for trees, shrubs and herbs.
Pollen percentage diagram of all pollen types more common than 5% in any one sample based on the terrestrial pollen sum and concentrations [grains−1] of vesiculate and nonvesiculate pollen for standard snow samples from Jungfraujoch. Each sample (Jung 1–10) was divided into replicate samples that were processed with six extraction methods (Modified from original protocols for a standardized comparison with a second marker, see flowchart in Fig. 1). Hollow bars = 10× exaggeration.

The first PCA axis for the pollen percentages of the snow replicate samples explains 69.1% of the variance, and separates samples that used evaporation (BRUGGER, LIU and YANG) and filtration (SHORT) from samples that underwent many centrifugation steps without bottom freezing (EICHLER and FESTI methods). These latter samples contain generally lower amounts of Picea abies pollen (Fig. 5). The second axis explains 13.6% of the variance, and possibly reflects Pinus sylvestris-type abundance in the samples. Thus, the high cumulative variance explained by the two axes (82.7%) suggests that the vesiculate pollen abundance in the pollen assemblages may be strongly affected by the microfossil extraction procedure. Analyses with absolute values (pollen concentrations in grains l−1) yield comparable results confirming the ordination results of the percentage dataset (data not shown).
Principal component analysis of pollen assemblages (percentages of the terrestrial pollen sum) for standard snow replicate samples from Jungfraujoch processed with six different microfossil extraction methods modified from original lab protocols for a standardized comparison with a second marker; see flowchart in Fig. 1. Colors refer to extraction methods grouped according to the main water elimination procedures: evaporation, centrifugation and filtration. Symbols refer to replicate samples.
The boxplots (Fig. 3) for vesiculate pollen percentages grouped by methods also indicate a selective vesiculate pollen loss with centrifugation-based methods without bottom freezing (EICHLER and FESTI by ~25%). It also seems that pollen composition among samples is characterized by a slightly higher variability compared with the evaporation and filtration-based methods. ANOVA for vesiculate pollen percentages grouped by extraction methods (Fig. 3) provides no evidence for statistically significant differences between samples processed with evaporation and filtration-based methods (BRUGGER, LIU, SHORT and YANG). For the centrifugation-based methods EICHLER and FESTI, ANOVA also provides no evidence for statistically significant differences in vesiculate pollen percentages. However, the analyses indicate statistically significant differences between these samples and those processed with the four other methods. Both ANOVA and visual examination of the data, therefore, suggest a distinct difference between evaporation- or filtration-based methods and solely centrifugation-based methods in respect to the percentage of vesiculate pollen, with a clearly larger loss of vesiculate pollen in the EICHLER and FESTI methods. In contrast, the influence of different extraction methods on the marker ratio is less distinct (Fig. 3). This suggests a disproportionate effect of the solely centrifugation-based methods on vesiculate pollen (i.e. EICHLER and FESTI methods involving 16 centrifugation steps for 400 mL water, Fig. 3).
3.3. Validation of the BRUGGER method with high-alpine glacier ice samples
We applied the BRUGGER method to ice samples from the high-alpine Colle Gnifetti glacier because it yielded the smallest loss among all approaches used in our comparison with snow replicates from Jungfraujoch. The average marker ratio (0.57, 20.2% deviation from ideal ratio) in the high-alpine ice samples is very similar to the average marker ratio in the snow replicate samples processed with the same method (0.56, 22.1%), suggesting minor losses of Lycopodium and thus microfossils. The slightly lower correlation between Lycopodium spores and Eucalyptus pollen (R 2 = 0.78, Fig. 6a), when compared with snow samples (Fig. 6a), may be explained by properties inherent to these specific samples, for example low concentrations of insoluble organic and inorganic particles leading to smaller pellets during the concentration process. Indeed the microscopic slides from ice contained fewer dust particles than those from snow.
Application of the BRUGGER method to Colle Gnifetti ice samples. Protocol with second marker application (see flowchart in Fig. 1). a) Marker ratio of Lycopodium spores (added prior to sample processing) and Eucalyptus pollen (added before mounting in glycerine) for 18 ice samples and one replicate of sample 15 from Colle Gnifetti glacier. Ideal marker relationship (9666 Lycopodium spores : 13500 Eucalyptus pollen = 0.72; dashed line) with tablet uncertainty (grey). b) Pollen assemblage comparison of sample 15 and its replicate (15 replicate) with all taxa presented as percentages of the terrestrial pollen sum. All pollen types >1 % in one of the samples are shown. Dashed black line indicates ideal 1:1 pollen percentage ratio. P. cembra = Pinus cembra, R. acetosa = Rumex acetosa-type. Insert box: Magnification for pollen types with percentages between 1 and 3.
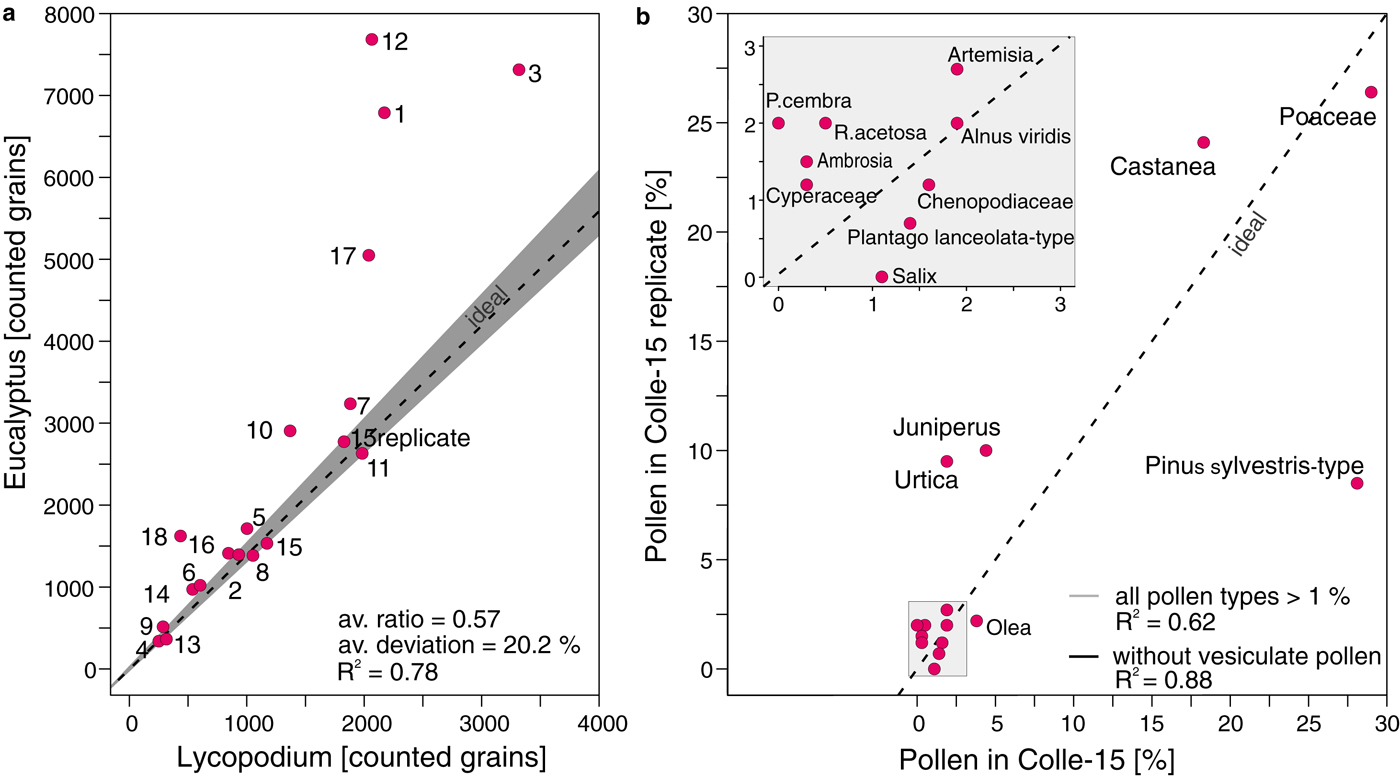
Pollen concentrations in the high-alpine ice core samples from Colle Gnifetti are low when compared with the snow samples from Jungfraujoch, ranging between 310 and 18300 grains l−1 (mean of 6600 grains l−1) vs. 12000–400000 grains l−1 (115000 grains l−1), respectively. This finding may reflect the altitudinal difference of 1000 m between Colle Gnifetti (4450 m a.s.l.) and Jungfraujoch (3400 m a.s.l.), which markedly increases the distance to the vegetation at lower altitudes (colline to alpine belts between ~200 and 3000 m a.s.l.; Ellenberg, Reference Ellenberg1996) that produces the palynological signal. Pollen percentages for taxa >1% in the two replicate samples of Colle-15 are very similar resulting in a high R2 between pollen percentages of different taxa in these two samples (0.88 for pollen >1% occurrence without vesiculate). The exception is Pinus sylvestris-type which occurs at 27% in Colle-15 and 10% in the Colle-15 replicate resulting in a much lower R 2 (0.62, Fig. 6b), if the vesiculate pollen taxa are included in the dataset (Fig. 6b). This suggests a high reproducibility of most pollen taxa (e.g. Poaceae and Castanea). The vesiculate morphology of Pinus sylvestris-type may influence the reproducibility of its abundance compared with other pollen taxa with a nonvesiculate morphology, while Pinus cembra values (2% vs. 0%, respectively) are too low to be assessed. Even though the statistical power of two high-alpine ice core replicates is limited, these results strongly support the outcome of the snow replicates as discussed in Section 3.2.
4. DISCUSSION
4.1. The necessity of marker application
Adding microfossil markers to palynological sediment samples has been a standard in palynology since the early 1970s (e.g. Stockmarr, Reference Stockmarr1971; Moore and others, Reference Moore, Webb and Collison1991; Dark and Allen, Reference Dark and Allen2005; Finsinger and Tinner, Reference Finsinger and Tinner2005; Maher and others, Reference Maher, Heiri, Lotter, Birks, Lotter, Juggins and Smol2012; Brugger and others, Reference Brugger2016; Campbell and others, Reference Campbell, Fletcher, Hughes and Shuttleworth2016; Rey and others, Reference Rey2017). This allows quantitative pollen concentration and influx estimates (Stockmarr, Reference Stockmarr1971; Birks and Gordon, Reference Birks and Gordon1985), which cannot be achieved otherwise unless the entire sample is counted (von Post, Reference von Post1916; Welten, Reference Welten1944; Moore and others, Reference Moore, Webb and Collison1991). Adding markers also helps to estimate losses during pollen extraction. Some recent studies tend to avoid adding markers to the palynological samples because of the costs, the additional labor or presumed contamination issues (Festi and others, Reference Festi, Hoffmann and Luetscher2016). Based on our results presented here, we can reject these speculations about contamination issues when using commercially available, standardized and quality checked marker tablets (e.g. Lycopodium tablets provided by the University of Lund; Maher, 1981).
Our results clearly show that microfossil loss during pollen extraction from ice samples is inevitable (i.e. >20% of the Lycopodium marker is lost). This loss occurs while initially reducing the water content (e.g. evaporation, filtration, centrifuging followed by decanting), during the chemical treatment involving inevitable centrifuging steps in all tested methods and after sample processing. The very low amount of pollen in ice and snow samples is not easy to extract from the centrifuge tubes, to be fixed without losses on the slide and partly becomes covered under the microscopic cover slip margins. These losses strongly affect any absolute microfossil counts (e.g. pollen, charcoal particles in ice core samples) that do not add markers. Thus, marker application is imperative to estimate realistic absolute values (concentrations, influx) and as a control for total sample loss (Stockmarr, Reference Stockmarr1971; Peck, Reference Peck1974; Finsinger and Tinner, Reference Finsinger and Tinner2005), particularly for ice samples.
4.2. Influence of specific ice sample properties on pollen extraction
Ice samples have specific properties that may explain differences in the microfossil behavior during laboratory processing compared with sedimentary samples. The microfossil deposition on glaciers is different than the deposition in lake and mire sediment archives. Fresh pollen, spores and other microfossils (e.g. charcoal) get directly covered with snow after deposition on the surface and incorporated into the ice. This is unlike pollen deposited in lake sediments, which only settles to the lake bottom when it is saturated with water and dense enough to sink (Faegri and Iversen, Reference Faegri and Iversen1989; Dark and Allen, Reference Dark and Allen2005). A special behavior of vesiculate pollen compared with nonvesiculate pollen was demonstrated in transect studies in lakes, with shore sediments enriched in vesiculate pollen compared with sediments from the lake center. This pattern is explained by the fact that vesiculate pollen floats for a long time and is thus transported to the shore where it accumulates (Ammann and Tobolski, Reference Ammann and Tobolski1983). The different behavior of vesiculate and nonvesiculate pollen was also observed in floating pollen traps in lakes (Giesecke and Fontana, Reference Giesecke and Fontana2008). Early controlled laboratory experiments on the pollen floating behavior confirmed that the majority of vesiculate pollen (e.g. Pinus sp.) floated on the water surface in still standing glass beakers for hours while most fresh nonvesiculate pollen (e.g. 95–100% Corylus, Quercus, Juniperus and Larix) sank within the first 5 minutes after the experiment started (Hopkins, Reference Hopkins1950). We thus assume that pollen of vesiculate pollen floated on the water surface after thawing of the ice samples and was preferentially lost during the subsequent decanting of the centrifuge tubes. A major difference between ice and sediment samples is that while pollen is frozen in ice, sediment pollen is soaked in water over years to millennia, potentially reducing its floating capacity. The high floating capacity of well-preserved vesiculate pollen in ice may explain the larger variability of vesiculate compared with nonvesiculate pollen (Fig. 4). This finding is important because it implies a negative bias on vesiculate pollen concentration estimates from ice core records. Peck (Reference Peck1972), Davis and Brubaker (Reference Davis and Brubaker1973) and Holmes (Reference Holmes1990) reported differences of settling time among nonvesiculate pollen depending on the size. However, based on our results we cannot confirm a larger variability of pollen grains with small diameters and lower densities compared with larger grains (e.g. Urtica and Castanea vs. Alnus and Poaceae).
While the morphology of vesiculate pollen is an evolutionary advantage for wind and water pollination (the latter because buoyancy aids floating upwards in a liquid drop into the ovules; Owens and others, Reference Owens, Takaso and Runions1998; Runions and others, Reference Runions, Rensing, Takaso and Owens1999), it is a clear disadvantage for laboratory processing of palynological samples. This implies that thawed ice samples should stand around some days to extend the water saturation and sinking time for pollen before applying centrifugation steps. This waiting time is inherent to evaporation-based methods (BRUGGER; LIU; YANG) where the pollen stays in the water for several days during the initial evaporation. Similarly, filtration-based methods (SHORT; or the method in Nakazawa and others, Reference Nakazawa2005) circumvent the problem of floating pollen in the first water reducing step. However, centrifuging samples may also help vesiculate pollen to sink from a water surface by filling the air bladders with water (Hopkins, Reference Hopkins1950) implying that increasing the centrifugation time in each centrifuging step may help to increase the number of sunken vesiculate pollen.
Microfossils from ice samples are not incorporated in a matrix as is typical for sediment samples from lakes or mires. We assume that this causes higher and more variable pollen loss during the pollen extraction from ice samples, especially during decanting of centrifuge tubes. Indeed, pollen assemblage differences were smaller in sediment samples as evidenced by a tentative comparison with replicate sediment samples from Moossee, Switzerland (unpublished results). Similarly, snow replicate samples from Jungfraujoch with most likely higher dust concentrations have a lower pollen loss variability than the high-alpine ice samples from Colle Gnifetti glacier, presumably since they form a more stable pellet at the bottom of centrifugation tubes after centrifugation. Our solution to this problem is to minimize pollen losses in ice samples by mimicking a matrix through shock-freezing of the tube bottom always after centrifuging and before decanting. The pollen quality was not affected by the shock-freezing procedure. However, our observations suggest that the low concentrations of suspended particles in the high-alpine ice core samples compared with samples with a sediment matrix may influence the sinking behavior during centrifugation. Comparing samples that are processed with identical laboratory protocols except for an alcohol treatment before centrifuging to lower the surface tension (EICHLER and FESTI methods) points to smaller pollen loss with an alcohol treatment (FESTI), although marker ratios are not significantly lower according to the comparison statistics (Fig. 3).
Our data indicate that losses increase with the number of increasing centrifuging steps (Fig. 3) suggesting that the number of centrifuging steps is crucial for microfossil losses. Remote archives at high altitudes (e.g. high alpine glaciers in the Andes above 6000 m a.s.l.; Liu and others) or high latitudes (e.g. Arctic sites, Short and Holdsworth, Reference Short and Holdsworth1985; Hicks and Isaksson, Reference Hicks and Isaksson2006) usually demand high ice volumes (e.g. >400 mL) because of low pollen concentrations. Microfossil concentrations may also be more diluted in archives with high snow accumulation rates common in some mountain ranges (e.g. Neff and others, Reference Neff2012; Schwikowski and others, Reference Schwikowski, Schläppi, Santibañez, Rivera and Casassa2013; Mariani and others, Reference Mariani2014). Given that the required sample volume for reliable analysis is much larger (i.e. several liters) in such extreme archives, evaporation methods appear best suited to reduce undesired pollen losses.
5. CONCLUSIONS
The BRUGGER extraction method is developed from existing evaporation-based water reducing methods (e.g. LIU protocol; Liu and others, Reference Liu, Yao and Thompson1998) with a newly invented step of freezing the tube bottom after centrifugation during the chemical treatment. Based on our results, the BRUGGER protocol can minimize microfossil loss if compared with the other approaches. However, the differences are statistically not pronounced. Our study highlights that pollen assemblages from ice cores processed with different microfossil extraction protocols challenge the reproducibility between records from different study sites. This is especially valid for sites where vesiculate pollen grains from conifers are an important component of pollen assemblages. Remote ice archives at extreme altitudes, high latitudes, or with high snow accumulation rates and consequently extremely low microfossil concentrations, need a special focus when processing samples for palynological analysis. We show that significant losses are inevitable during processing of samples. Therefore, applying high-quality marker tablets prior to microfossil extraction from ice records is crucial if the goal is to produce absolute counts and not only percentages. Speculations about marker contaminations or other negative effects on the pollen assemblage quality can definitely be rejected. To conclude, we recommend following a strictly standardized protocol that includes high-quality marker tablets to obtain reliable concentration and influx estimates. Applying the new BRUGGER approach may contribute to minimizing microfossil losses and gaining reproducible results.
SUPPLEMENTARY MATERIAL
The supplementary material for this article can be found at https://doi.org/10.1017/jog.2018.31
ACKNOWLEDGEMENTS
We are grateful to Ruth Drescher-Schneider for providing Eucalyptus tablets, to Florencia Oberli for technical assistance with developing the new extraction method, to Daniela Festi, Klaus Oeggl and their colleagues from Innsbruck University for stimulating discussions, to Dimitri Osmont and Denis Alija for their help with sampling in the freezing room and at the Jungfraujoch station. We thank H.J.B. Birks and an anonymous reviewer for their constructive remarks, which substantially improved the manuscript. We acknowledge the SINERGIA project Paleo fires from high-alpine ice cores funded by the Swiss National Science Foundation (SNF grant 154450).
AUTHORS CONTRIBUTIONS
SO Brugger and E Gobet contributed equally.


 Open access

