National elections in France have been an object of scientific forecasting efforts since the 1980s (for a review, see Jérôme and Jérôme-Speziari Reference Jérôme and Jérôme-Speziari2010), with an initial deployment of political-economy models based on regression analysis. Later, these models were rivaled by public-opinion polling approaches that emphasized the use of vote intentions to foretell election outcomes (e.g., Jérôme, Jérôme, and Lewis-Beck Reference Jérôme, Jérôme and Lewis-Beck1999; Selb, Göbel, and Lachat Reference Selb, Göbel and Lachat2020). Other theoretical efforts occasionally emerged (e.g., Nadeau, Bélanger, and Lewis-Beck Reference Nadeau, Bélanger and Lewis-Beck2012), but the dominant approaches have been structural models versus vote-intention polls. We propose another approach that recently has been tested in France: citizen forecasting (CF).
CF uses responses to voters’ expectations (not their intentions) as expressed in answering: “Who do you think will win the upcoming election?” We assembled CF questions and embedded them in national surveys of the French electorate before the 2022 presidential election. The French system represents a complex party system, as highlighted by the surprising results of the 2017 Macron triumph. In addition to the numerous new (and changing) parties, the voting rules generally involve two rounds of balloting. This article reviews the general literature on CF of elections. We focus on preliminary efforts in the French case, especially as applied to forecasting during the 2017 French presidential-election campaign. This background provides the groundwork for our 2022 CF surveys.
CITIZEN FORECASTING METHODOLOGY
Among the various scientific approaches to predicting elections, CF is highlighted. Before an election, we ask citizens who they think will win. As more people answer, for example, “party X,” this party’s likelihood of winning is considered higher. Such an approach has frequently been applied elsewhere, including the United Kingdom, the United States, and—more recently—Canada (Temporão et al. Reference Temporão, Dufresne, Savoie and van der Linden2019) and Germany (Murr and Lewis-Beck Reference Murr and Lewis-Beck2022). Thus, it did not seem unreasonable to imagine that CF would work in France.
The advantage of vote-expectation polls is that people are invited to think about the public’s vote intention; therefore, in addition to their own intention, they may report that of their family and friends (Leiter et al. Reference Leiter, Murr, Ramírez and Stegmaier2018). Indeed, several studies have shown that vote-expectation polls are more accurate than vote-intention polls (e.g., Graefe Reference Graefe2014; Murr, Stegmaier, and Lewis-Beck Reference Murr, Stegmaier and Lewis-Beck2021). That said, a disadvantage of our approach is that we asked the likelihood for each candidate and therefore needed survey questions for each candidate instead of a single vote-intention question. Compared to structural models, which are based on theories of elections, a disadvantage of CF is that we learn less about the nature of elections. However, in CF, we learn something about the practical political knowledge and the psychological thinking of citizens. Another advantage is that in CF, we do not need historical data to fit regression models because a single snapshot will suffice for each election.
The advantage of vote-expectation polls is that people are invited to think about the public’s vote intention…
It is helpful to reconsider the foundational questions of data and measures. Lewis-Beck and Skalaban (Reference Lewis-Beck and Skalaban1989), who likely initiated modern CF, exercised the method on national probability samples of the American National Election Study. Those surveys consistently asked respondents before the contest, “Who do you think will be elected President in November?” In the eight surveys that they examined since 1956, voters correctly predicted the winner 69% of the time (Lewis-Beck and Skalaban Reference Lewis-Beck and Skalaban1989, 148). This benchmark result was repeated in subsequent US studies (Graefe Reference Graefe2014; Lewis-Beck and Tien Reference Lewis-Beck and Tien1999; Murr Reference Murr2015). Moreover, regarding Europe, primarily the United Kingdom, the finding also has been sustained (Lewis-Beck and Stegmaier Reference Lewis-Beck and Stegmaier2011; Murr Reference Murr2011, Reference Murr2016). A contemporary study drawing on 449 surveys from British elections (1950 to 2017) impressively shows that vote-expectation polls sharply outperform the more popular method—vote-intention polls (Murr, Stegmaier, and Lewis-Beck Reference Murr, Stegmaier and Lewis-Beck2021).
Another multiparty European case, Germany recently received a surge of election forecasting attention (see especially the symposium edited by Jérôme and Graefe Reference Jérôme and Graefe2022). Moreover, some of this attention was for CF. In their investigation of the 2017 national election, Lehrer, Juhl, and Gschwend (Reference Lehrer, Juhl and Gschwend2019) reported that CF predicts the Alternative for Germany vote but in ex post fashion. Furthermore, Graefe (Reference Graefe2016) examined the 2013 election and questioned a non-probability sample of adults; they could predict 12 of 14 possible election outcomes. Again, however, this was ex post. In a break from that strategy, Murr and Lewis-Beck (Reference Murr and Lewis-Beck2022) followed an ex ante CF methodology, drawing on 2021 voter expectations.
We summarize our two hypotheses as follows. First, our CF data would accurately forecast the eventual winner of the French presidential contest. The theory underlying CF—which draws on Condorcet’s Jury Theorem and the “wisdom of the crowds”—argues that as groups of voters increase in size, it becomes more likely that, as a collective, their expectation responses will not be random; rather, they will converge on the correct choice. Second, we hypothesized that given the first theory, our CF forecasts would perform at least as well if not better than vote-intention polls.
CITIZEN FORECASTING IN FRANCE
Over time, core CF questions have been posed, in fact, by different French polling firms to pre-election national samples of French voters, with results typically published before the election in newspapers. The two standard questions asked were either “According to you, who is going to win the next presidential election?” or “According to you, who is going to win in the second round?” These questions were fielded across presidential elections from 1965 to 2017 by at least seven survey companies: OpinionWay, The Harris Poll, Institut français d’opinion publique, BVA Group, IPSOS, Consumer Science & Analytics (previously l’Institut CSA), and Société française d’enquête par sondage (Sofres).Footnote 2
In general, the question was asked only for the two supposed leaders—for example, de Gaulle versus Mitterrand in 1965. However, sometimes a third candidate was added as a possible choice—for example, in 1995, Balladur was listed with Chirac and Jospin. In that contest, the marketing research firm TNS Sofres asked respondents before the second round who they thought would win. They overwhelmingly and accurately predicted a Chirac victory (i.e., 60%; only 19% predicted Jospin). Ambivalence in CF also can indicate the closeness of a race. For example, in The Harris Poll of 2012, 33% of respondents predicted a Sarkozy win and 34% predicted a Hollande win. These data aggregated over time, which we identified for 52 pre-presidential election polls, suggest the possibilities of CF (Dufresne et al. Reference Dufresne, Jérôme, Lewis-Beck, Murr and Savoie2022). However, they were too scattered (or too missing) to enable systematic conclusions about the French CF choice process—that is, the surveys typically were only one time and focused on only two candidates. Fortunately, these data limitations were markedly reduced when we reviewed the recent extensive studies of the 2017 French presidential election.
THE 2017 FRENCH PRESIDENTIAL ELECTION: DATA AND METHODOLOGY
During the 2017 French presidential-election campaign, Vox Pop Labs, in collaboration with France 24, operated the interactive online voting application Vote Compass (in French, Boussole électorale). Vote Compass questions online users about their views on various policies to evaluate their personal alignment with parties or candidates (van der Linden and Dufresne Reference van der Linden and Dufresne2017). The French Vote Compass ran continuously from April 5 to May 7, 2017, collecting more than 140,000 responses to two sets of vote-expectation questions.
The first question set asked respondents how likely it was on an 11-point scale that candidate X would win the presidential election. For the first round, the candidates included François Fillon, Benoît Hamon, Jean-Luc Mélenchon, Emmanuel Macron, Marine Le Pen, Nicolas Dupont-Aignant, Nathalie Arthaud, Jacques Cheminade, and Philippe Poutou. In the second round, responses were limited to Le Pen and Macron.
Another question asked respondents which one of these candidates they thought would win the most votes in their department or overseas territory in the first and second rounds of the presidential election. Because we did not have access to department-level data for this study, we focused on the national level.
RESULTS: THE NATIONAL LEVEL
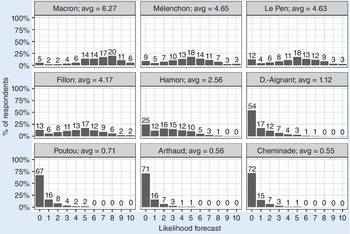
Figure 1 shows CF results at the national level for the first round on April 23, 2017. Specifically, 6% of respondents answered “10 (very likely)” when asked how likely it was that Macron would win the presidential election. The average (appearing in the row second from the bottom in figure 1) was simply the weighted sum over [0-10] of the percentage of respondents who answered using this value. Intuitively, it could be said that, on average, respondents gave Macron a 6.3/10 “likelihood” of winning the election. Macron’s chances were much higher than those of any other candidate. The second place was tied between Mélenchon (4.65) and Le Pen (4.63), with Fillon not far behind (4.17). All other candidates did not appear viable. Technically, these results are neither probabilities nor odds, and their correct “meaning” certainly requires further discussion.
Distribution of Citizen Forecasts of the 2017 French Presidency at the National Level in the First Round
Note: The numbers above the bars refer to the proportion of respondents who indicated each likelihood value for the candidate. Each candidate is a separate question, with N between 137,265 and 144,171.

Table A1 in the online appendix shows similar results for the second round held on May 7, 2017. Of all respondents, 15% indicated Macron was “10 (very likely)” to win compared to 4% for Le Pen. The average score for Macron was 6.9, almost double that of Le Pen’s 3.8. Respondents overwhelmingly forecasted correctly that Macron would become President of the Republic.
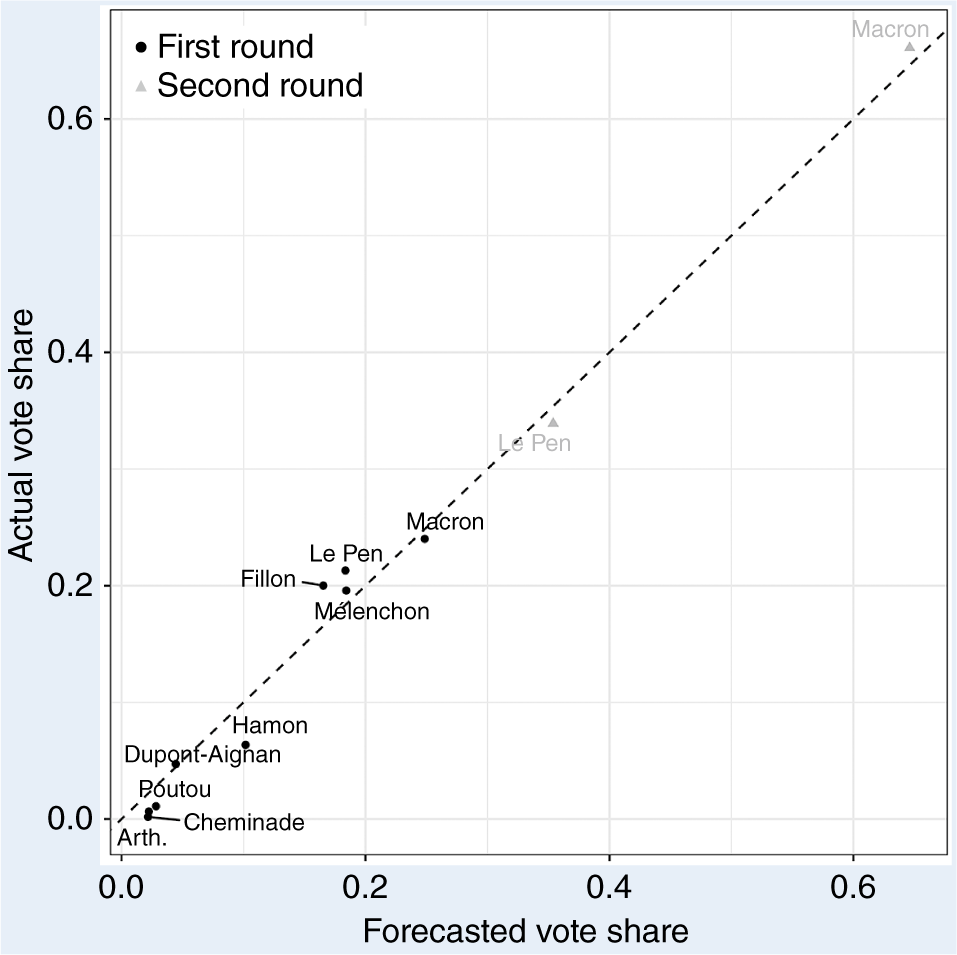
How well did citizens forecast the vote share of each candidate in each round? To forecast vote shares, we divide the average likelihood for a candidate listed in figures 1 and A1 by the sum of all likelihoods in a round. Figure 2 plots the actual vote share against the forecasted vote share for both rounds. Figure 2 shows that this simple forecasting rule is remarkably accurate by comparing its forecast with the actual vote shares. The points fall close to the 45-degree line, indicating a “perfect” forecast. As a result, the mean absolute error was 2 percentage points in the first round and 1.5 percentage points in the second.
Actual and Forecasted Vote Shares in the First and Second Rounds of the 2017 French Presidential Election
Note: The dashed 45-degree line indicates a forecast without error.

Figure 2 shows that this simple forecasting rule is remarkably accurate by comparing its forecast with the actual vote shares.
Online appendix figure A1 shows that the average scores remained mostly stable over time. For instance, in both rounds, CF of the winner (i.e., Macron) was similar from one day to the next. The only exception was Fillon’s increase, starting on approximately April 13. The key takeaway is that in 2017, voting expectations were quite stable.
THE 2022 FRENCH PRESIDENTIAL ELECTION: DATA AND METHODOLOGY
Based on analysis of the 2017 French Vote Compass data, the use of CF as a forecasting strategy seemed promising. Thus, we conducted a national survey that queried voter expectations on the same question as in 2017 (before the first and second rounds). For 2022, we identified seven serious competitors (as of November 2021), representing the usual French ideological range from Extreme Left to Extreme Right candidates, as follows:
Jean Luc Mélenchon (La France insoumise)
Anne Hidalgo (Parti socialiste)
Yannick Jadot (Les Verts)
Emmanuel Macron (La République en marche)
Valérie Pécresse (Les Républicains)
Marine Le Pen (Rassemblement national)
Eric Zemmour (Reconquête)
For readers who are unfamiliar with the candidates, Macron—who was the current Centrist president—was the favorite. Le Pen, leader of the Extreme Right Front National, was the runner up in 2017. Pécresse led the Traditional French Right and Hidalgo led the Traditional Left (experiencing difficulty since the foundation of Macron’s party in 2016). Zemmour was another Extreme Right candidate who often was depicted as an (intellectualist) agent provocateur trying to overtake the Rassemblement national on the Right. Mélenchon was Traditional Far Left and Jadot was a typical Green.
Because of the time dynamic that the two-round system imposes, these candidates needed to be evaluated over time, in waves. Thus, from OpinionWay, we commissioned three national-survey waves, with two in the first round (in November 2021Footnote 3 and April 2022) and one before the second round (in April 2022). Each survey aimed for a representative sample of 1,000 French respondents and contained, in addition to our CF items, a socioeconomic-status battery and political questions (including vote intention and Left–Right self-placement).Footnote 4
2022 RESULTS AND DISCUSSION
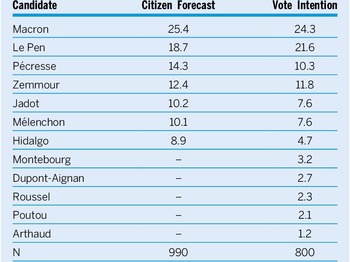
Although CF represents a new approach to election prediction in France, we were encouraged by its pioneering performance in the contentious 2017 presidential election. Therefore, we pursued it for the 2022 presidential contest through our three national samples with voter-expectation questions, in a continuous 11-point format, that we asked of all earnest contenders from the Extreme Left to the Extreme Right. Recall our two hypotheses: (1) our CF data would accurately forecast the eventual winner of the French presidential contest, and (2) our CF would perform at least as well if not better than vote-intention polls. Table 1 summarizes the findings of our first OpinionWay survey, fielded in late November 2021. Vote intentions in that survey placed the top four candidates in the first round in the following order: Macron, Le Pen, Zemmour, and Pécresse. By comparison, CF results from our first wave of first-round data showed similar results, with the important exception that Zemmour and Pécresse would trade places. Generally, however, results from the likelihood forecast and vote intentions were similar.
Forecasted Vote Share of Candidates in the First Round of the 2022French Presidential Election Based on Citizen Forecasts and Vote Intentions

CONCLUSION
To forecast the 2022 French presidential election, we did not rely on a structural model or vote-intention surveys. Instead, we relied on the expectations of the voters. When they were asked, French citizens clearly expected Macron to become the next president. It would remain to be seen how these rankings evolved over the second and third waves of our surveys. However, based on the 2017 experience, we anticipated Macron’s lead would hold.
We relied on the expectations of the voters. When they were asked, French citizens clearly expected Macron to become the next president.
A general takeaway from the French case in 2017 is that CF derived from a likelihood-to-win question predicted the correct winner and produced precise vote-share forecasts. For the 2022 presidential election, the CF methodology provided a reasonable forecast. Time would tell whether it was as accurate as in 2017.
DATA AVAILABILITY STATEMENT
Research documentation and data that support the findings of this study are openly available at the PS: Political Science & Politics Harvard Dataverse at https://doi.org/10.7910/DVN/MUXIKE.
Supplementary Materials
To view supplementary material for this article, please visit http://doi.org/10.1017/S1049096522000567.
CONFLICTS OF INTEREST
The authors declare that there are no ethical issues or conflicts of interest in this research.