Language development after first words emerge has been well defined in terms of vocabulary growth, the acquisition of morphology and growth in mean length of utterance during early childhood (e.g. Bates, Bretherton & Snyder, Reference Bates, Bretherton and Snyder1988; Fenson et al., Reference Fenson, Dale, Reznick, Bates, Thal and Pethick1994). For example, a large cross-sectional study has produced growth curves depicting normative ages and individual variation in language development (Fenson et al., Reference Fenson, Dale, Reznick, Bates, Thal and Pethick1994). Understanding the timing of growth and change has permitted comparisons with other areas of development and contributed to theories of language development. Knowing when morphological structures emerge, for example, has stimulated investigations of associated events in language and cognitive development.
There are no comparable growth curves for speech development before the onset of words. For example, the number of repetitions produced within infant utterances during the first year has not been well documented. Instead, much of the literature on early speech development has focused on identifying stages of infant vocal production and describing consonant inventories (e.g. Locke, Reference Locke1983; Stark, Reference Stark, Yeni-Komshian, Kavanagh and Ferguson1980). As with later language development, understanding the timing of changes in early mean length of utteranceFootnote 1 will permit comparisons with other areas of development and contribute to theories of language development. For example, knowing how vocalizations change between reduplicated babble onset and word comprehension and production will contribute to our understanding of processes involved in the transition to word use. Moreover, measuring change both over time and in relation to established stages of speech development will increase our understanding of the stages themselves, their role in language development and the processes underlying language development.
Stages of speech development
Research describing universal stages of speech development has documented regularities in early vocalizations, related in part to changes in anatomy, respiration and neuromotor control (Kent, Reference Kent and Stark1981, Reference Kent1984; Stark, Reference Stark, Yeni-Komshian, Kavanagh and Ferguson1980). Universal stage models generally describe a progression from reflexive vocalizations (e.g. crying), to cooing, babbling and first words (Kent, Reference Kent1984; Oller, Reference Oller2000).
Canonical babbling has been broadly characterized as the use of well-formed syllables containing at least one consonant (C) and vowel (V) with the characteristic timing of mature syllables later used in words and sentences (Oller, Reference Oller2000). reduplicated babbling, a milestone in speech development that typically emerges between 0 ; 6 and 0 ; 8 (Koopmans-van Beinum et al., Reference Koopmans-van Beinum, Clement and van den Dikkenberg-Pot2001; Locke, Reference Locke1983; Mitchell & Kent, Reference Mitchell and Kent1990; van der Stelt & Koopmans-van Beinum, Reference van der Stelt, Koopmans-van Beinum, Lindblom and Zetterstrom1986) is characterized more specifically by utterances containing multiple repetitions of CV syllables (e.g. [dadada]). However, exact numbers of repetition within reduplicated utterances are seldom measured (see Mitchell & Kent, Reference Mitchell and Kent1990). Moreover, reports about change in long strings of CV syllables following reduplicated babble onset are conflicting. Some report that reduplicated CV utterances decline after age 1 ; 1 (Smith, Brown-Sweeney & Stoel-Gammon, Reference Smith, Brown-Sweeney and Stoel-Gammon1989; Winitz & Irwin, Reference Winitz and Irwin1958), while others report that longer strings continue to occur around the time of word onset (Vihman & Miller, Reference Vihman, Miller, Smith and Locke1988). Despite evidence of continuity in consonant use from babbling to first words (Oller & Eilers, Reference Oller and Eilers1982; Vihman, Ferguson & Elbert, Reference Vihman, Ferguson and Elbert1986), little attention has been directed toward investigating continuity in number of repetitions or associated features of utterances (e.g. number of sounds and CV syllables). However, Winitz & Irwin (Reference Winitz and Irwin1958) noted that 18% of words produced at 1 ; 1 contained two reduplicated syllables (e.g. [dada]). Documenting longitudinal trends in mean length of utterance will establish both number of repetitions per utterance and patterns of continuity or change during the transition from reduplicated babbling to word production.
The role of reduplicated babbling
Babbling is perhaps the most studied stage of early speech development. The importance of reduplicated babbling, however, is still subject to speculation. Questions remain regarding the necessity of reduplicated babbling, the role of reduplicated babbling in speech development and the significance of delayed babbling. For example, Stoel-Gammon (Reference Stoel-Gammon1989) reported abnormal patterns of babbling in two 2 ; 0 late-talkers; both children were otherwise developing normally and both developed age-appropriate language by the time they entered school. Moreover, the absence of reduplicated babbling following tracheotomy in children who later speak normally (Locke & Pearson, Reference Locke and Pearson1990) has led some to suggest that reduplicated babbling may occur in relation to a particular interval of vocal tract maturation and control but that babbling may not be essential for speech acquisition (Kent, Reference Kent1984).
Because reduplicated babbling depends at least in part on changing influences on vocal development, examining these influences may shed light on the role of reduplicated babbling in language development. Whereas cross-linguistic regularities in consonant emergence (Locke, Reference Locke1983; Oller & Eilers, Reference Oller and Eilers1982) indicate that vocalizations during the second half of the first year continue to be influenced in part by fine motor control (Kent, Reference Kent and Stark1981; MacNeilage, Davis & Matyear, Reference MacNeilage, Davis and Matyear1997), vocalizations during this time are also influenced by auditory perception and linguistic input. For example, at 0 ; 10, infants from different language communities (e.g. French, Swedish, Arabic) selectively produced the vowels and consonant–vowel relationships typical in their linguistic environment (Boysson-Bardies, Halle, Sagart & Durand, Reference Boysson-Bardies, de Halle, Sagart and Durand1989), and French adults presented with vocalizations of 0 ; 8 and 0 ; 10 French, Arabic and Cantonese infants successfully identified the vocalizations of French infants (Boysson-Bardies, Sagart & Durand, Reference Boysson-Bardies, de Sagart and Durand1984). Thus, perceptual experience shapes infant vocalizations well before first words emerge; this influential effect of auditory perception is evident by 0 ; 8 to 0 ; 10, around the time that word comprehension is typically noted (e.g. Fenson et al., Reference Fenson, Dale, Reznick, Bates, Thal and Pethick1994).
Auditory perception has a marked influence not only on features of infant vocalizations but also on the appearance of reduplicated babbling. In a study of identical twins – one with a profound hearing loss and the other with normal hearing – when compared with the hearing twin whose language was age-appropriate, the twin with impaired hearing produced few syllables and no reduplicated babbling before 1 ; 8 (Kent, Osberger, Netsell & Hustedde, Reference Kent, Osberger, Netsell and Hustedde1987). Similar reports of impoverished syllable production and delayed or absent reduplicated babbling among deaf and hearing-impaired infants, as well as emerging reports of reduplicated babbling after cochlear implantation, indicate that reduplicated babbling relies on residual or amplified hearing (Koopmans-van Beinum et al., Reference Koopmans-van Beinum, Clement and van den Dikkenberg-Pot2001; Oller & Eilers, Reference Oller and Eilers1988). Despite documented relations between reduplicated babbling and auditory perception, little more is known about why CV repetition occurs when it does or how it changes with word comprehension and production.
Further, although CV repetition is widely regarded as the hallmark of reduplicated babbling, vowel repetition has not been well documented. In two separate instances, however, Elbers (Reference Elbers1982) described repeated vowels interrupted by glottal closure during the period of repetitive babbling, and Kent (Reference Kent1984) described a long string of repeated vowels produced by an infant at 1 ; 0. Concurrent evidence of V and CV repetition during reduplicated babbling may suggest the occurrence of a broader developmental phenomenon than the emergence of CV repetition alone. Examining V and CV repetition and comparing repetition in speech development with reports of other repetitive behaviors that occur during the second half of the first year may help determine whether reduplicated babbling is part of a language-specific or broad developmental phenomenon.
Repetition in non-speech rhythmic movements
Reduplicated babbling has typically been regarded as an isolated characteristic of the vocal apparatus. However, as Kent (Reference Kent1984) has pointed out, reduplicated babbling may be ‘part of a general behavior pattern in which movements are organized in cyclic patterns’ (p. R891). Because speech is a motor behavior, repetition in non-speech motor behaviors may be relevant to understanding repetition in speech. Repetition in non-speech motor behavior occurs most notably in early rhythmic movements. Rhythmic movements, movements repeated at approximately one-second intervals, occur regularly during the first year, peaking between 0 ; 6 and 0 ; 8. In a longitudinal study of twenty infants, for example, all infants performed a variety of rhythmic movements (e.g. kicking, bouncing and hand banging). Earlier rhythmic movements occurred in association with heightened arousal (Thelen, Reference Thelen1979, Reference Thelen1981), but rhythmic arm movements between 0 ; 8 and 1 ; 0 were frequently associated with object exploration and inspection (Thelen, Reference Thelen1981). Infants frequently combined inspection with banging and shaking at 0 ; 9 (Fenson, Kagan, Kearsley & Zelazo, Reference Fenson, Kagan, Kearsley and Zelazo1976), regularly engaging in such rhythmic behaviors during the typical period of reduplicated babbling (Ejiri & Masataka, Reference Ejiri and Masataka2001; Iverson & Fagan, Reference Iverson and Fagan2004; Thelen, Reference Thelen1981).
Whether repetitive babbling, banging and shaking share a common function is unclear. Understanding how change in CV repetition compares with known patterns of change in rhythmic movements will help to address this question. By 1 ; 1, for example, around the time of symbolic word use, repetitive object exploration is typically replaced by more symbolic activities with objects (Fenson et al., Reference Fenson, Kagan, Kearsley and Zelazo1976; Thelen, Reference Thelen1979). Similarities in the timing of change in rhythmic movements and reduplicated babbling (Ejiri, Reference Ejiri1998; Locke, Bekken, McMinn-Larson & Wein, Reference Locke, Bekken, McMinn-Larson and Wein1995; Thelen, Reference Thelen1979) would support the argument that reduplicated babbling may be part of a general developmental phenomenon rather than a specific, speech-related behavior.
Fewer studies have investigated the implications of delayed onset of rhythmic movements than have investigated delayed reduplicated babbling. However, both delayed rhythmic arm movements and delayed reduplicated babbling often occur in conditions characterized by neuromotor delay (e.g. Down Syndrome; Cobo-Lewis, Oller, Lynch & Levine, Reference Cobo-Lewis, Oller, Lynch and Levine1996). Whereas the delayed appearance of rhythmic behaviors may be more likely to occur in cases of severe as compared with mild neuromotor impairment, there is little evidence to suggest a role for repetitive behaviors in motor development. Some have suggested that rhythmic behaviors strengthen synaptic connections and contribute to motor coordination and control (Kent, Reference Kent1984; MacNeilage et al., Reference MacNeilage, Davis and Matyear1997). However, the necessity of rhythmic behavior for motor development has not been established. In fact, rhythmic behaviors have been described as transitional behaviors that reflect increasing voluntary, functional motor control (Kent, Reference Kent and Stark1981; Thelen, Reference Thelen1979). If reduplicated babbling and rhythmic arm movements are functional, voluntary behaviors, perhaps they serve a common function in general development beyond that of motor control. Documenting repetitions per vocalization and considering potential functions of repetitive babbling and rhythmic movements within the context of general development rather than within speech or motor development alone may contribute to our understanding of both behaviors.
This longitudinal study investigated six parameters of infant vocalizations (i.e. number of sounds, CV syllables, supraglottal consonants, repetitions, duration and seconds per sound). These parameters document vocalization characteristics and describe relationships over time. For example, as repetitions per utterance decline, sounds and CV syllables may decline or remain high. Similarly, as motor coordination improves, seconds per sound may decline even as overall utterance length and duration increase. The primary purpose of this research was to investigate infant utterances between 0 ; 3 and the onset of first words, both over time and in relation to three milestones of language development: reduplicated babble onset, word comprehension and word production. A secondary purpose of this research was to collect new measures of repetition (i.e. number of repetitions per utterance, and V vs. CV repetition) to facilitate comparisons of change in reduplicated babbling with reported patterns of change in other repetitive behaviors (e.g. rhythmic banging and exploration) that occur during the same time period. Understanding how utterances change in relation to reduplicated babble onset will contribute to our understanding of the role of reduplicated babbling and repetition in speech development. Together, these goals address theoretical questions about the transition from early sounds to first words and processes underlying infant vocalizations.
METHOD
Participants
Participants were eighteen full-term, healthy infants (seven males, eleven females) with no history of developmental delay or hearing loss. Seven were first-born infants, nine were second-born, one was third-born and one was fourth-born. All infants were from monolingual, English-speaking, two-parent households. Parents were relatively homogeneous in terms of education (thirty-one college graduates, two graduates of two-year colleges and three high-school graduates) and race (thirty-four Caucasian, one Asian and one Asian Pacific-Islander).
Procedure
As part of a larger study of vocalization and gesture, infants and their primary caregivers were videotaped in their homes twice a month between ages 0 ; 2 and 1 ; 7. The focus of the present research was on vocalization data from five bimonthly visits (on monthly birth dates and midpoints between monthly birth dates) for each infant between 0 ; 3 and the onset of word production as described below. At each visit, infants were videotaped during two 15-minute naturalistic observation periods (during which parents were asked to continue their normal activities) separated by 18 minutes of semi-structured play with a parent. Semi-structured play consisted of play with rattles (4·5 minutes), play in an infant jump seat (5 minutes; 4 months to 24 pounds), face-to-face interaction (3 minutes) and unstructured play with the child's toys (5 minutes). During all activities, infants wore a cloth vest designed to house a small transmitter (Audio-technica ATW-T101) and microphone (Isomax EMW) positioned approximately 7 cm from the infant's mouth.
Developmental milestones
In addition to the videotaped sessions, parents were asked to collect a representative 5-minute sample of their child's vocalizations on audiotape the day before each visit. These recordings provided a representative sample of typical vocalizations in the event that an infant vocalized in a substantially different manner with parents than when researchers were present; however, parents never reported that this was the case. The audiotapes were also used to document developmental milestones not witnessed during home visits. Three developmental milestones were documented for use in analyses of vocalization change: reduplicated babble onset, word comprehension and word production. The onset of reduplicated babbling was determined by parent report of two vocalizations containing CV syllable repetition and evidence of syllable repetition on audio or videotape. Word comprehension was credited when parents reported comprehension of at least two words on the Vocabulary Checklist of the MacArthur Communicative Development Inventory: Words and Gestures (Fenson et al., Reference Fenson, Dale, Reznick, Thal, Bates, Hartung, Pethik and Reilly1993), administered twice a month from 0 ; 8 to 1 ; 4. Word production was determined by parent report of a word produced in two or more contexts and evidence of word production on audio or videotape. None of the parents reported that they were unable to capture a small sample of reduplicated babbling or word production when first noted to occur.
Data selection
Data analyses focused on the vocalization data collected for five of the eighteen infants at 3, 5, 7, 9 and 11 months; five infants at 3·5, 5·5, 7·5, 9·5 and 11·5 months; four infants at 4, 6, 8, 10 and 12 months; and four infants at 4·5, 6·5, 8·5, 10·5 and 12·5 months. These data collection points were planned to improve data sampling for multilevel modeling and to allow fine-grained representations of change within the developmental period from 3 months to 12·5 months. Infants were randomly assigned to one of the four groups. If the first word for a given child had not emerged by the final planned data point, one or two additional data points were included as needed for use in word analyses. In total, 106 sessions were analyzed: 90 planned sessions and 16 additional sessions.
Coding and data management
Vocalizations were defined as sounds produced by infants other than crying, laughing, squealing or vegetative noises (e.g. hiccoughs and grunting). Some studies have focused only on vocalizations judged in various ways to be canonical (e.g. excluding marginal syllables); however, relatively few infant vocalizations meet canonical standards. Oller, Eilers, Steffens, Lynch & Urbano (Reference Oller, Eilers, Steffens, Lynch and Urbano1994) found that only 0·11 to 0·31 of infant syllables produced between 6 and 12 months were canonical; 0·34 to 0·43 between 12 months and 18 months. Therefore, this study did not discriminate between marginal and canonical syllables.
Vocalization boundaries were determined by the presence of an audible or visible breath or by a period of silence of approximately 1 s. Perceived vocalization boundaries (i.e. vocalization onset and offset) were entered into an observational software program, the Observer Video Pro (Noldus Information Technologies), to permit reliable calculations of temporal duration.Footnote 2 Thirty vocalizations from each target visit were identified in the order described below.
Vocalizations were phonetically transcribed using broad phonetic transcription and standard International Phonetic Alphabet (IPA) notation. Although sounds produced in the first months of infancy may differ in timing and precision from adult-like forms, phonetic notation was used for two reasons: to incorporate a standard notation system, and to permit classification of perceptually equivalent productions. Phonetic notation was used for these reasons and not to equate very early infant sounds with mature productions; however, phonetic notation has been widely used to describe infant sounds produced during the second half of the first year (see Oller, Reference Oller2000). Transcription of videotaped vocalizations began with semi-structured play, after play with rattles concluded, and continued with the first and second naturalistic periods until thirty vocalizations were obtained. This order was chosen to ensure inclusion of vocalizations produced during semi-structured play and social interaction with a parent.
Data reduction
Transcribed vocalizations were categorized according to vocalization type and type of repetition. Vocalization type categories were: (a) single sound – V or C, and combined consonants (e.g. [hm]); (b) vowel combination; (c) sound repetition – V or C repetition; (d) single CV syllable vocalization; and (e) multi CV syllable vocalization. Vocalization types and examples are presented in Appendix A. As shown in Appendix A, CV syllable refers to four different CV syllable shapes: CV, VC, CVC and VCV (see also Kent et al., Reference Kent, Osberger, Netsell and Hustedde1987; Oller, Reference Oller2000). CVC and VCV vocalizations were relatively infrequent (approximately 5% of all CV syllable vocalizations were CVC forms, and approximately one-fourth were VCV).
Type of repetition was categorized as follows: (a) no repetition; (b) sound repetition (e.g. [a a]); (c) CV syllable repetition (e.g. [ba ba]); and (d) mixed repetition (i.e. more than one type of repetition within an utterance, for example [o o ba ba]). For the purpose of this investigation, repetitive sounds were defined as two or more perceptually equivalent sounds, and repetitive syllables were defined as two or more syllables with perceptually equivalent phonetic composition (Mitchell & Kent, Reference Mitchell and Kent1990). Finally, six additional parameters of vocalization were coded for each vocalization: number of sounds, number of CV syllables, number of S-G consonants (i.e. consonants other than [h] or glottal stops), number of repetitions (consecutive repetitions of a sound or CV syllable), temporal duration (i.e. overall utterance duration) and number of seconds per sound (utterance duration/number of sounds).
Data analysis
Data were analyzed using multilevel modeling techniques, which permit analyses of nested, hierarchical data. The data in this study contributed to a three-level hierarchical structure: infant utterances nested within a given visit; repeated visits nested within individual infants; and differences between individual infants. The hierarchical structure of the data allowed assessment of variation at each level of measurement and the formulation of individual growth trajectories. Multilevel models accommodate multiple waves of data in longitudinal designs, unequally spaced data-collection occasions and different data collection schedules (Singer & Willett, Reference Singer and Willett2003).
Reliability
Reliability was assessed for 20% of the vocalization data (21 sessions), using both intra-rater (10%) and inter-rater (10%) agreement. To assess intra-rater reliability the original coder re-coded 11 sessions (n=330 vocalizations) after a two- to five-month interval. To assess inter-rater reliability, a second trained coder who was unfamiliar with the goals of the study coded an additional 10 sessions (n=300 vocalizations). Reliability measures were calculated for agreement on vocalization occurrence (i.e. agreement that a vocalization occurred), vocalization type, type of repetition, number of sounds, number of repetitions and temporal duration.
Mean intra-rater agreement for vocalization occurrence was 0·97. Agreement for vocalization type was 0·91, Cohen's kappa=0·87. Intra-class correlation coefficients (ICC) for type of repetition, number of sounds, number of repetitions and temporal duration were 0·87, 0·97, 0·85 and 0·99, respectively. Mean inter-rater agreement for vocalization occurrence was 0·77. Inter-rater agreement for vocalization type was 0·85, Cohen's kappa=0·78. ICC for type of repetition, number of sounds, number of repetitions and temporal duration were 0·78, 0·96, 0·79 and 0·95, respectively. Infant vocalizations are particularly challenging and reliability results are comparable to results reported in other studies (e.g. Stark, Bernstein & Demorest, Reference Stark, Bernstein and Demorest1993).
Intra- and inter-rater reliability measures for number of repetitions were based on both sound and CV syllable repetitions. However, because an important and unique focus of this study was on sound repetition, an additional measure of reliability was obtained specifically for sound repetitions. For this measure, a third trained coder who was unfamiliar with the goals of the study listened to 104 randomly sampled vocalizations and recorded numbers of consecutive sound repetitions (i.e. 0, 1, 2, etc.). The ICC for number of sound repetitions was 0·90.
RESULTS
Results focus first on descriptive analyses of the three developmental milestones and six vocalization parameters included in this study, followed by correlations between the developmental milestones and vocalization parameters. Next, multilevel models of change in vocalization parameters are presented in relation to age and developmental milestones. Finally, V and CV repetitions are analyzed in relation to reduplicated babble onset.
Descriptive analyses
Developmental milestones
Reduplicated babble onset
Consistent with previous studies (e.g. Koopmans-van Beinum et al., Reference Koopmans-van Beinum, Clement and van den Dikkenberg-Pot2001; van der Stelt & Koopmans-van Beinum, Reference van der Stelt, Koopmans-van Beinum, Lindblom and Zetterstrom1986), the mean age of reduplicated babble onset was 7·1 months (SD=1·72, range=4·5–12 months). In fact, van der Stelt and Koopmans-van Beinum (Reference van der Stelt, Koopmans-van Beinum, Lindblom and Zetterstrom1986) obtained comparable results not only for mean age of reduplicated babble onset (31 weeks), but also for standard deviation (6·5 weeks), and range in age of onset (18–48 weeks).
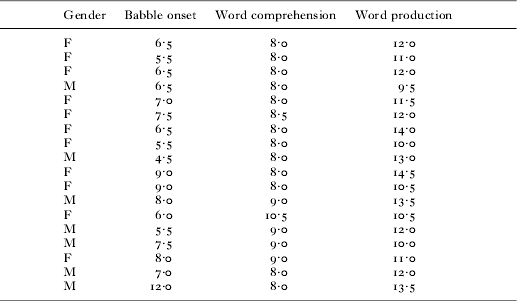
For most infants (n=15), reduplicated babble onset occurred before documented word comprehension or word production. For the remaining infants (n=3), onset occurred after word comprehension but before word production. Developmental milestones for each infant are shown in Table 1.
Infants' gender and age at reduplicated babble onset, word comprehension and word production

Word comprehension
The mean age of word comprehension was 8·4 months (SD=0·68, range=8–10·5 months). For all infants, word comprehension occurred before word production. There was considerable variation among the twelve infants credited with word comprehension when it was first measured at 8 months. Several infants were credited with three to seven words, but three infants were credited with more than twenty. Thus, there may have been a floor effect for this measure, in that, for infants credited with many words, comprehension of some words may have emerged earlier than 8 months.
Word production
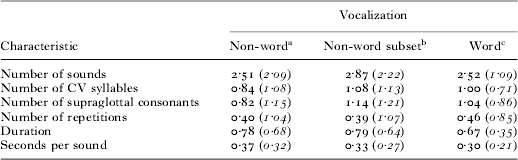
The mean age of word production was 11·8 months (SD=1·46, range=9·5–14·5 months). Of 3180 vocalizations, 52 (1·6%) were coded as words. Judgments of word status were based on contextual cues (e.g. child picked up a bottle and said, [ba ba]), phonetic similarity to the presumed target word and parent response. Of the 52 words, 12 were formed with vowels (e.g. [aI] for hi), 29 with one CV syllable, 10 with two CV syllables, and 1 with three syllables (i.e. [bababae] for bottle). Mean characteristics of word and non-word utterances are shown in Table 2. In Table 2, data for non-word vocalizations are presented in two ways: data for all non-word vocalizations (n=3128) and data for a subset of non-word vocalizations (n=968) produced during sessions in which words were produced or documented. Word and non-word vocalizations were typically brief and contained two or three sounds, approximately one CV syllable and SG consonant, and few repetitions.
Mean characteristics of non-word and word vocalizations

Notes: Mean and (standard deviation). an=3128 (all non-word vocalizations). bn=968 (non-word vocalizations produced in sessions in which word use was observed or reported). cn=52 (all word vocalizations).
Vocalization parameters
Number of sounds
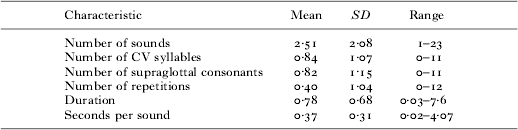
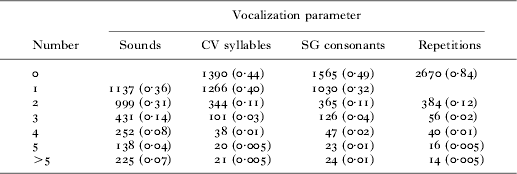
Overall, vocalizations contained few sounds. As shown in Table 3, which presents mean data for each vocalization parameter for all vocalizations, word and non-word combined, the mean number of sounds per utterance was 2·51. Eighty-one percent of all utterances contained three or fewer sounds, as shown in Table 4, which lists frequency and proportions of vocalizations by number of parameters per vocalization.
Mean vocalization characteristics

Note: N=3180.
Frequency and proportion of vocalizations by number of parameters per vocalization

Note: Frequency and (proportion). N=3180 vocalizations for each vocalization parameter column.
Number of CV syllables
The mean number of CV syllables per utterance was 0·84 (Table 3). Single CV syllable vocalizations were the most frequently occurring type of vocalization (39·6%); single vowels were second (27·8%). Only 5% of all vocalizations contained more than two CV syllables (Table 4).
For the group of infants as a whole, single CV syllable vocalizations consistently exceeded V vocalizations at 5 months and thereafter. Inspection of individual data indicated that for all but one infant, the age at which CV syllables first predominated ranged from 4·5 to 9 months and typically before the onset of reduplicated babbling (i.e. for thirteen of eighteen infants). For the remaining infant, syllables were predominant at 12 months, the age of reduplicated babble onset for that infant. Whereas before age at reduplicated babble onset, V vocalizations (M=21·3, SD=9·4) slightly outnumbered CV vocalizations (M=21·1, SD=9·7), after reduplicated babble onset CV vocalizations (M=49·3, SD=18·8) significantly exceeded V vocalizations (M=27·8, SD=10·7) (t (17)=5·13, p<0·001, d=1·41).
Number of supraglottal consonants
The mean number of supraglottal (SG) consonants per utterance was 0·82 (Table 3). Almost half of all utterances (49·2%) did not contain an SG consonant, and 32% contained only one (Table 4).
Number of repetitions
The mean number of repetitions (consecutive productions of a sound or CV syllable) per utterance was 0·40 (Table 3). Most vocalizations (84%) contained no repetition and only 4% contained more than two (Table 4).
Temporal duration
Overall, vocalizations were brief. Mean temporal duration per utterance was 0·78 s (Table 3). Most vocalizations (75%) were ⩽1 s in duration; only 4·8% were >2 s.
Seconds per sound
Seconds per sound, computed from utterance duration and number of sounds (i.e. duration/number of sounds), was designed to assess speed or efficiency of sound production. The mean rate was 0·37 s per sound (Table 3). Because seconds per sound is an average measure of production speed for sounds within an utterance, it does not provide separate information for consonants and vowels produced together in a given syllable or utterance.
Correlations between measures
Correlations between developmental milestones were not significant. That is, age of reduplicated babble onset was not significantly correlated with age of word comprehension (r=−0·10, p=0·69, 2-tailed) or word production (r=0·31, p=0·21, 2-tailed), and age of word comprehension was not correlated with age of word production (r=−0·23, p=0·35, 2-tailed) (N=18). There were no significant correlations between age at developmental milestones and mean parameters of vocalization.
Multilevel models of infant vocalization
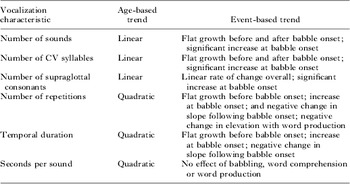
This set of analyses addressed the developmental course of measures of infant vocalization both in relation to age (continuous models) and in relation to the three developmental milestones described above (discontinuous models). Results of multilevel modeling for each vocalization parameter are summarized in Table 5, which describes change in relation to age (age-based trends) and in relation to developmental milestones (event-based trends). Due to the large number of analyses, illustrative figures will be provided for selected variables only. The modeling process, presented in detail in Appendix B, will be briefly summarized for each variable. Effects of gender were not significant in any of the models and are not presented, nor were interactions between time and developmental predictor variables.
Summary descriptions of change in vocalization characteristics based on age-based versus event-based analyses

Number of sounds
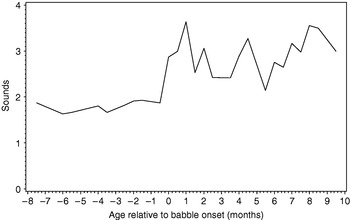
With regard to age, a plot of the mean number of sounds per utterance for each of the ages in this study (Figure 1) shows a linear trend in number of sounds per utterance over time. By contrast, a plot of the data centered on reduplicated babble onset (Figure 2) indicates relatively flat growth before and after babble onset with an increase in number of sounds at babble onset. In Figure 2, mean age of reduplicated babble onset is set to zero on the horizontal axis and negative and positive numbers represent number of months before and after reduplicated babble onset, respectively. This figure represents the observed data submitted to multilevel analyses.
Mean number of sounds per utterance across ages 3 to 16 months.

Mean number of sounds per utterance centered on babble onset (0). Negative values indicate number of months before babble onset; positive values indicate number of months after babble onset.

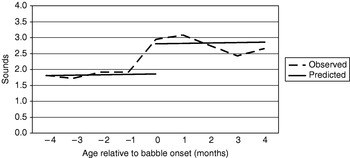
Continuous multilevel models of growth in number of sounds indicated a significant linear trend (linear rate of change=0·11, t=4·48, p<0·001) when analyses were based on age. By contrast, discontinuous event-based models which probed for evidence of discontinuity in the shape of change over time, indicated a non-significant linear slope overall with a significant increase in elevation in association with reduplicated babble onset (change in elevation=0·95, t=3·79, p<0·001). This discontinuous elevation model was a better fit to the data than the age-based linear model. Figure 3 allows a comparison of the observed values centered on reduplicated babble onset with values predicted by the discontinuous elevation model. Different pictures of change in number of sounds were generated by age- and event-based analyses. Change across ages was linear. However, the best model of change was a discontinuous model in which growth in number of sounds per utterance was relatively flat before reduplicated babble onset, increased significantly at babble onset (0·95 sounds per utterance), and then continued at the new level.
A comparison of observed and predicted values for mean number of sounds centered on babble onset (0). Predicted values based on the discontinuous elevation model.

Number of CV syllables
Continuous growth models indicated a significant linear rate of change (0·07, t=5·39, p<0·001) and a marginally significant quadratic rate of change with age. A deviance change test indicated that the linear model was a significant improvement over the quadratic model (deviance change=6·9, p=<0·01). Tests of discontinuity in elevation indicated a non-significant linear slope and a significant increase in number of CV syllables associated with reduplicated babble onset (increase in elevation=0·46, t=3·43, p<0·001). Thus, as for number of sounds, change with age was linear; however, the best model fit indicated little change before or after reduplicated babble onset with a significant jump in CV syllables per utterance (0·46) at the time of babble onset.
Number of supraglottal consonants
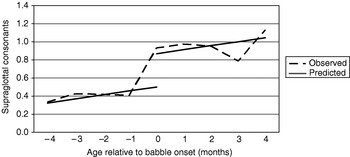
As was true for number of sounds and number of CV syllables, continuous age-based growth models indicated a significant linear trend in number of SG consonants over time (linear rate of change=0·08, t=6·34, p<0·001). However, the best-fitting model of change in SG consonants was a discontinuous elevation model (deviance change=6·8, df=1) that indicated significant linear growth before and after reduplicated babble onset (linear rate of change=0·05, t=2·47, p<0·05), with a significant jump in number of SG consonants (0·37) at the time of babble onset (change in elevation=0·37, t=2·65, p<0·01). Number of SG consonants was the only vocalization parameter for which discontinuous models showed significant linear growth before and after reduplicated babble onset. Figure 4 compares observed values centered on reduplicated babble onset with predicted values based on this discontinuous model.
A comparison of observed and predicted values for mean number of supraglottal consonants per utterance centered on babble onset (0). Predicted values based on the discontinuous elevation model.

Number of repetitions
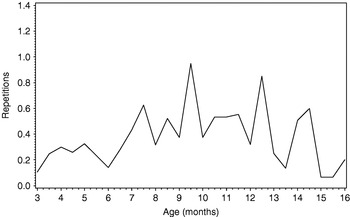
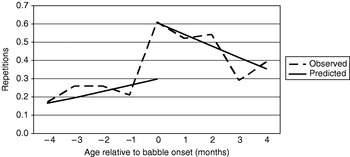
Whereas the three vocalization parameters discussed above show linear age-based trends, the three final vocalization parameters show quadratic age-based trends. An example is shown in Figure 5, a plot of quadratic change in number of repetitions across ages. As shown in this plot, number of repetitions per utterance increased until approximately 9·5 months and then declined. By contrast, a plot centered on reduplicated babble onset showed relatively flat growth (i.e. not statistically significant) before reduplicated babble onset, an increase in number of repetitions at babble onset and then a decrease following babble onset. An inspection of the plots of individual infants indicated that, for thirteen of eighteen infants, number of repetitions per utterance declined soon after the peak associated with reduplicated babble onset. This decline was evident within two to three months after reduplicated babble onset.
Mean number of repetitions per utterance across ages 3 to 16 months.

Multilevel models of repetition indicated significant linear and quadratic parameters of change over time (linear rate of change=0·18, t=3·34, p<0·01; quadratic rate of change=−0·01, t=−2·98, p<0·01). In subsequent tests of discontinuity in repetition, a discontinuous elevation and slope (E&S) model indicated both a significant change in elevation (0·31 repetitions per utterance) at reduplicated babble onset (change in elevation=0·31, t=2·96, p<0·01) and a significant negative change in slope after babble onset (change in slope=−0·06, t=−2·61, p<0·05). The E&S model was a better fit than the baseline quadratic model. Thus, change in number of repetitions per utterance was more adequately described by discontinuity in elevation and slope than by models of continuous age-based change. Figure 6 is a plot comparing observed values centered on reduplicated babble onset with values predicted by the E&S model.
A comparison of observed and predicted values for mean number of repetitions per utterance centered on babble onset (0). Predicted values based on the discontinuous elevation and slope model.

For number of repetitions and the other vocalization parameters, discontinuous models indicated the effects of word comprehension were not significant. However, for number of repetitions alone, tests of discontinuity indicated significant effects of word production. That is, tests of discontinuity in elevation with reduplicated babble onset and word production in the same model indicated two significant event-based changes in elevation: a significant increase in number of repetitions in association with reduplicated babble onset (change in elevation=0·26, t=2·37, p<0·05) and a significant decrease in number of repetitions in association with word production (change in elevation=−0·26, t=−2·33, p<0·05). Thus, number of repetitions per utterance declined significantly in association with word production. Nevertheless, based on parsimony and number of significant parameters, the E&S model that included only reduplicated babble onset, and not word production, was a better fit to the data than the model that included both developmental milestones. Note, however, that both of these models showed a significant decline in number of repetitions after reduplicated babble onset. Recall also that, in this set of models, number of repetitions followed a quadratic trend even in relation to age. Thus, repetitions peaked and significantly declined before the end of the first year in all three models.
Temporal duration
Temporal duration was the only vocalization parameter for which variance between infants (i.e. L3; see Appendix B) was significant. Therefore, little between-infant variance was found for five of the six parameters of vocalization. Similarities among infants may reflect a limited range of possible vocal variations, the number of vocalizations sampled and/or relative homogeneity within the sample of infants.
Age-based growth models of utterance duration revealed significant linear and quadratic parameters (linear rate of change=0·18, t=4·80, p<0·001; quadratic rate of change=−0·01, t=−4·64, p<0·001). Inspection of the observed data showed that mean utterance duration increased until approximately 9·5 months and then declined. As with number of repetitions per utterance, however, the best model fit was obtained with a discontinuous E&S model that indicated no significant change in utterance duration before reduplicated babble onset (linear rate of change=0·004, t=0·22, p=0·83), a significant increase in duration at babble onset of 0·40 s (change in elevation=0·35, t=4·17, p<0·001), and a negative change in slope following babble onset (rate of change in slope=−0·05, t=−2·06, p<0·05).
Seconds per sound
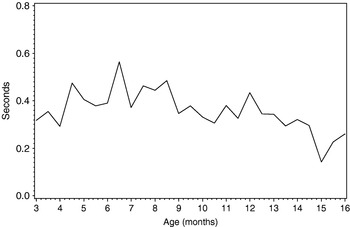
Finally, a plot of seconds per sound across ages (Figure 7) shows a quadratic trend, with seconds per sound increasing until approximately 6·5 months and then decreasing over time. Age-based models indicated a significant quadratic trend (linear rate of change=0·05, t=2·91, p<0·01; quadratic rate of change=−0·003, t=−3·43, p<0·001). By contrast, no tests of discontinuity in seconds per sound in relation to reduplicated babble onset were significant, as the decline in seconds per sound at 6·5 months, potentially associated with improved motor coordination, occurred before the mean age of reduplicated babble onset (7·1 months). Thus, in contrast to the other parameters of vocalization in this study, change in seconds per sound was best described by quadratic change in relation to age.
Mean number of seconds per sound across ages 3 to 16 months.

In summary, for the vocalization parameters included in this study, age-based and event-based analyses generated different pictures of change. Change in all vocalization parameters except seconds per sound was better described by discontinuous growth in relation to reduplicated babble onset, regardless of the age at which onset occurred. By contrast, age-based analyses showed continuous linear or quadratic trends over time. Thus, because age-based curves average change across ages without regard to developmental events, interpreting change in relation to age alone can obscure discontinuous patterns.
V and CV repetition
New measures of repetition in this study included both number of repetitions per utterance, as described in multilevel analyses, and investigations of single sound repetition (i.e. V or C repetition). Reduplicated babble onset is typically defined by CV repetition. In addition to CV repetition, however, infants in this study regularly repeated sounds. Sound repetitions occurred across all ages, beginning with the earliest ages observed. For example, sixteen of the eighteen infants produced at least one sound repetition during their earliest coded session. Nevertheless, very early sound repetitions were infrequent. For example, of the four infants who produced a sound repetition at 3 months, two infants produced only one such vocalization and the other two infants produced only two or three. Similarly, only three infants produced an SG syllable repetition during their earliest coded session. Thus, rare sound and CV syllable repetitions were noted prior to documented reduplicated babble onset as defined in this study.
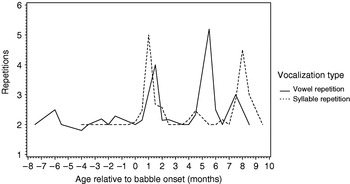
Most vocalizations were not characterized by repetition (i.e. 84%; see Table 4); however, of the vocalizations (16%) that did contain repetition – of any type – sound repetition and CV repetition occurred with approximately equal frequency: 238 vocalizations contained sound repetition and 231 contained CV repetition. Of the vocalizations that contained sound repetition, the overwhelming majority contained V repetitions (i.e. n=204, 85%). Thus, infants produced V repetitions almost as frequently as they produced CV repetitions. Moreover, at reduplicated babble onset, both V and CV repetition increased simultaneously, as shown in Figure 8, a plot of mean number of repetitions for both types of utterances centered on reduplicated babble onset.Footnote 3 Therefore, at reduplicated babble onset, which is typically characterized by the onset of CV repetition, infants in this study produced increased numbers of repetition of both types – V-repetition and CV-repetition.
Mean number of repetitions per utterance for V repetition and CV repetition utterances centered on babble onset (0).

Regarding frequency per session, the mean number of utterances that contained repetition per session was 4·81 (SD=3·76, range=0–17). Before reduplicated babble onset the mean number of repetitive utterances per session was 3·0 (SD=1·20, range=0–4); after babble onset the mean was almost twice as large, 5·84 (SD=2·22, range=0–17), a significant difference (t(17)=−5·62, p<0·001, d=1·6). Thus, reduplicated babble onset was characterized not only by an increase in number of repetitions per utterance, but also by an increase in the number of utterances that contained repetition.
DISCUSSION
The primary purpose of this research was to measure longitudinal change in six parameters of infant utterances, both over time and in relation to three milestones of language development, using multilevel models. The second purpose was to investigate previously unexplored characteristics of repetition to facilitate comparisons of change in reduplicated babbling with reported patterns of change in other forms of repetitive behavior. On one level, the results describe observable characteristics of infant utterances. At another level, however, analyzing change in relation to language milestones has addressed theoretical questions about processes underlying the transition from early sounds to first words, including the role of reduplicated babbling in this process.
Characteristics of infant utterances
An unanticipated outcome of this research was that most infant utterances were brief and structurally simple throughout the first year. The average utterance was less than a second in duration and contained fewer than three sounds and no repetition. Thus, contrary to some reports, infant utterances did not become increasingly long and complex over time. Instead, they grew modestly from single sounds to CV syllables. By the time of word onset, infants tended to produce one- and two-syllable utterances of short duration with few repetitions in word and non-word vocalizations.
In addition to reduplicated babble onset (which will be discussed below) three notable changes in vocalizations that occurred during the journey from early sounds to words included CV syllable production, faster timing and word use. First, although all infants produced some early CV syllables, single vowels were the most prominent form of vocalization during the early part of the first year and single CV syllables were most prominent in the later half (see also Kent, Reference Kent1984; Oller, Reference Oller2000; Stark, Reference Stark, Yeni-Komshian, Kavanagh and Ferguson1980). The change from V dominance to CV dominance typically occurred before the onset of reduplicated babbling. Because most infants established CV dominance before CV repetition, and always before spoken word use, single CV production is a likely precursor of repetitive babbling and word use.
The second change, faster timing, also occurred shortly before the mean age of reduplicated babble onset (i.e. 7·1 months). Seconds per sound peaked around 6·5 months and then declined, suggesting more efficient sound production. This change occurred around the time that canonical syllables are reported to occur. That is, canonical syllables typically emerge around 0 ; 6 and just before reduplicated babbling (Oller, Reference Oller2000). Whereas studies of canonical syllable production typically report syllables of <500 ms (Lynch, Oller, Steffens & Buder, Reference Lynch, Oller, Steffens and Buder1995; Oller, Reference Oller2000), the mean measure of seconds per sound in this study (370 ms) was somewhat large by comparison. However, in previous studies syllables have been defined to include single sounds and CV syllables (i.e. V and CV; Lynch et al., Reference Lynch, Oller, Steffens and Buder1995), but in the present study syllables were defined as containing at least two sounds (e.g. CV). Thus, measures of sound and syllable duration may be equivalent across studies when based on similar criteria.
Nevertheless, the trend toward decreasing sound and syllable duration before reduplicated babble onset documented both in this study and in studies based on spectrographic analyses suggests that reduplicated babbling follows rather than precedes growing efficiency in syllable production. Further, significant change in seconds per sound occurred only in relation to age in this study and not in relation to reduplicated babble onset. For this reason, and because most vocalizations in this study did not contain repetition, it seems unlikely that speech motor development depends on repetitive babbling. Thus, these results support the hypothesis that reduplicated babbling reflects growing age-based efficiency in motor control and that reduplicated babbling is not required for speech production.
The third notable change in vocalizations was the transition from non-words to words. In many ways, first words and non-words were similar – both were typically brief, non-repetitive and contained similar numbers of sounds. Words, however, were slightly more likely than non-words to contain an SG consonant. Although there were relatively few words in this study, the data are consistent with early studies showing that words are typically simple structures of one or two syllables (Vihman & Miller, Reference Vihman, Miller, Smith and Locke1988; Winitz & Irwin, Reference Winitz and Irwin1958). Winitz & Irwin, for example, found that 76% of words produced at 13 months contained one or two syllables. Similarly, 75% (n=39) of words in this study contained one or two syllables. These data extend previous reports of continuity in consonant use from babbling to first words (Oller & Eilers, Reference Oller and Eilers1982; Vihman et al., Reference Vihman, Ferguson and Elbert1986) by showing that first words resemble earlier vocalizations not only in that they make use of similar sounds but also similar numbers of sounds and CV syllables and similar patterns of repetition and duration.
Together, these data on characteristics of infant utterances suggest that infants build upon a foundation of previously established skills in producing increasing numbers of single CV syllables, adding sound and syllable repetition, and superimposing meaning on familiar one- and two-syllable structures. Furthermore, they suggest that in their prelinguistic vocalizations, infants do not explore far from the word-like utterances that will become the major linguistic product of the first year.
Change in relation to age and developmental milestones
All measures of vocalization changed in predictable ways in relation to age and language milestones. In relation to age, the linear increase in sounds, CV syllables and SG consonants was accompanied by a quadratic trend in number of repetitions, temporal duration and seconds per sound, increasing early in the first year and declining in the second half of the year. Measuring change in relation to age is a common and accepted practice, especially for establishing normative developmental trends. Moreover, significant developmental change in some measures occurs only in relation to age (e.g. seconds per sound). However, because age-based curves average growth across infants, they may obscure discontinuities associated with developmental events.
By contrast, modeling change in vocalizations in relation to early language milestones resulted in improved model fit and uncovered regularities in patterns of change before, during and after milestone achievement, especially with regard to reduplicated babble onset. These event-based analyses revealed both expected and unexpected patterns of change. For example, rather than the gradual change depicted across ages, event-based analyses revealed a sudden increase in all measures of vocalization, except seconds per sound, in association with reduplicated babble onset. The increase in most measures of vocalization in association with reduplicated babble onset might be expected considering the definition of reduplicated babbling. That is, with the onset of CV syllable repetition, numbers of sounds and syllables, as well as overall duration, should increase. Note, however, that this increase was abrupt and occurred in relation to reduplicated babble onset regardless of the age at which onset occurred. For the infant with reduplicated babble onset at 1 ; 0, for example, vocalization measures increased only with reduplicated babble onset and not during the lengthy interval before onset when long strings of sounds and variegated syllables might have been produced despite the absence of reduplicated babbling. The adequacy of event-based models was especially notable given that variation among infants in age of reduplicated babble onset was relatively wide (4·5–12 months) during a period of development when age is typically equated with rapid growth.
Event-based analyses indicated relatively flat growth before and after reduplicated babble onset for most measures, except SG consonants, which increased linearly both before and after an increase at babble onset. This linear increase in SG consonants, also evident in age-based analyses, reflected infants' increasing tendency to form CV syllables with SG consonants, although typically not in long strings but in single syllables. That is, whereas the post-babble trend in SG consonants was linear, numbers of sounds and CV syllables did not continue to increase. Thus, after reduplicated babble onset, infants typically produced neither long strings of reduplicated CV syllables nor increasingly long strings of sounds and syllables that did not contain repetition. This increase in numbers of SG consonants, rather than reduplicated babbling, has often been associated with later language development (e.g. Stoel-Gammon, Reference Stoel-Gammon1989).
A theoretical discussion of processes underlying infant vocalizations
Analyzing change in relation to language milestones addressed theoretical questions about the transition from early sounds to first words, including the role of repetitive babbling in this process. For example, whereas an increase in CV repetition at reduplicated babble onset was expected, the relatively prompt decline in repetition two to three months later was not. Thus, documenting the number of repetitions within infant utterances, a measure not typically included in studies of reduplicated babbling, has contributed new information about patterns of repetition and suggested new questions about the reason that repetition emerges at all and the timing of its emergence and subsequent decline.
The age-based peak in number of repetitions per utterance occurred at 9·5 months and declined shortly thereafter. Neither this pattern of increase and decline in number of repetitions, nor the timing of its occurrence in the first year, is unique to repetitive babbling. Studies of rhythmic movements and object manipulation have shown that both object-related rhythmic arm movements and noise-related forms of object exploration peak around the same time and decline toward the end of the first year. For example, Thelen (Reference Thelen1981) found that object-related rhythmic arm movements more than doubled from 0 ; 6 to 0 ; 9, and Palmer (Reference Palmer1989) found a peak in shaking noise-making rattles at 0 ; 9. Similarly, around the time of reduplicated babble onset, Locke et al. (Reference Locke, Bekken, McMinn-Larson and Wein1995) found a sharp increase and then decline in mean number of manual shakes per second – a measure not unlike the measure of number of repetitions in this study. Moreover, in the present study and others, instances of reduplicated babbling, and instances of repetitive object exploration (e.g. Zelazo & Kearsley, Reference Zelazo and Kearsley1980), tend to decline in favor of more symbolic behaviors toward the end of the first year. These parallels in the timing of peak periods of reduplicated babbling and noise-related exploration, and in the repetitive nature of both behaviors, lend support to the idea that banging and reduplicated babbling may share a common function; that function may be the exploration of sound.
Infants demonstrate a particular interest in exploring the sound-making characteristics of objects around 0 ; 9 (Palmer, Reference Palmer1989), and this interest in producing sound has been linked to repetitive babble onset. For example, at or immediately following reduplicated babble onset, infants often manipulated noise-making objects at a higher rate than silent objects (Ejiri, Reference Ejiri1998; Locke et al., Reference Locke, Bekken, McMinn-Larson and Wein1995). Further, Stark et al. (Reference Stark, Bernstein and Demorest1993) found that infants engaged in reduplicated babbling predominantly while also engaged in other forms of exploration (e.g. while shaking objects). Together these reports suggest that at reduplicated babble onset infants often engage in object exploration in order to produce and explore sound and that they may also engage in reduplicated babbling as part of this general interest in sound exploration.
Others have suggested that reduplicated babbling may be a form of sound play, typically in the sense of practicing speech sound production (see Locke, Reference Locke1993). Instead, the argument that reduplicated babbling is an exploratory behavior places repetitive babbling within the context of general cognitive development and global sound exploration, rather than assuming it is uniquely related to speech development. Exploration and repetition contribute to early cognitive development by providing infants with opportunities to acquire new information and develop associations between actions and consequences (Piaget, Reference Piaget1952). During this time of cognitive development for example, infants explore objects (Fenson et al., Reference Fenson, Kagan, Kearsley and Zelazo1976) and repeat sounds and syllables predominantly when there are auditory consequences to their actions (e.g. Kent et al., Reference Kent, Osberger, Netsell and Hustedde1987).
Whereas peak numbers of repetitive exploratory behaviors are reported to decline quickly with the acquisition of symbolic behaviors (Fenson et al., Reference Fenson, Kagan, Kearsley and Zelazo1976), in this study numbers of repetition declined significantly a few months after the peak at reduplicated babble onset. The significant decline in number of repetitions in association with the onset of symbolic word use, and the close (although not significant) association between mean age of reduplicated babble onset (7·1 months), word comprehension (8·3 months) and word production (11·8 months) may help to explain this decline in repetition. That is, as infants begin to comprehend and produce words, it is likely not only that they shape their utterances to match the sounds produced in their linguistic environment (Boysson-Bardies et al., Reference Boysson-Bardies, de Halle, Sagart and Durand1989), but also that they shape numbers of repetitions to match the words they target. Because first words typically contain one or two CV syllables (Vihman & Miller, Reference Vihman, Miller, Smith and Locke1988; Winitz & Irwin, Reference Winitz and Irwin1958), with the onset of word comprehension and word production longer strings of repetitive babbling are likely to decline, as they did in this study, in favor of one- and two-syllable forms.
The idea that reduplicated babbling represents an interest in sound exploration is compatible with previous reports of normal speech development following absent or atypical reduplicated babbling (Locke & Pearson, Reference Locke and Pearson1990; Stoel-Gammon, Reference Stoel-Gammon1989). That is, infants may attend to the language in their environment and develop symbolic word knowledge without producing repetitive sounds themselves. Moreover, because infants in this study demonstrated the ability to produce CV syllables at an early age, all infants had the physical ability to produce single syllables, and therefore to approximate single-syllable words, even before reduplicated babble onset. In fact, speech can develop even in the absence of any early opportunities to vocalize audibly (Locke & Pearson, Reference Locke and Pearson1990). Individual differences in the way sound–meaning and auditory–motor relationships are formed may be related to opportunity, cognitive variability, environmental factors (e.g. variations in exposure and caregiver response) and hearing status.
In keeping with the idea that reduplicated babbling represents a general cognitive interest in sound exploration, reduplicated babbling and speech development are typically delayed when auditory perception is severely compromised. Deaf infants, if they engage in reduplicated babbling at all, babble later than hearing infants, and they babble infrequently and with a limited repertoire of sounds (Koopmans-van Beinum et al., Reference Koopmans-van Beinum, Clement and van den Dikkenberg-Pot2001; Oller & Eilers, Reference Oller and Eilers1988). If reduplicated babbling were an automatic or innate behavior, deaf infants might be expected to babble at the typical age of babble onset despite the absence of hearing. Evidence indicates that they do not (Kent et al., Reference Kent, Osberger, Netsell and Hustedde1987). That some deaf infants engage in reduplicated babbling at all has been attributed to residual hearing or benefit from amplification.
Some have suggested that reduplicated babbling may rely at least in part on co-occurrence with rhythmic forms of behavior. For example, Ejiri & Masataka (Reference Ejiri and Masataka2001) suggested that the co-occurrence of vocal behavior and rhythmic activity contributes to articulatory development. However, increased manual rhythmic activity and reduplicated babbling tend to arise around the same time (Ejiri, Reference Ejiri1998; Locke et al., Reference Locke, Bekken, McMinn-Larson and Wein1995; Thelen, Reference Thelen1979). The close timing in onset of both behaviors suggests little opportunity for the developmental influence of one activity upon the other. Further, in previous studies, both rate of rhythmic manual activity and frequency of co-occurrence with vocalization were higher for infants who had already begun reduplicated babbling than they were for infants who had not (e.g. Ejiri, Reference Ejiri1998; Iverson & Fagan, Reference Iverson and Fagan2004; Locke et al., Reference Locke, Bekken, McMinn-Larson and Wein1995). These reports, together with evidence of rapid sound production before reduplicated babble onset, as well as evidence of normal speech development in the absence of reduplicated babbling, suggest that although reduplicated babbling and rhythmic movement share common properties, speech development is unlikely to require their co-occurrence.
In summary, looking at change in relation to language milestones and reconciling differences between age-based and event-based trajectories has led to new views of the development of infant vocalizations, the transition from reduplicated babbling to word production and processes that may underlie these transitions. Concurrent evidence of increased V and CV repetition at babble onset and, most notably, a subsequent, relatively prompt decline in both behaviors, has led to a proposal that reduplicated babbling represents the occurrence of a general developmental phenomenon evident in other repetitive behaviors during the second half of the first year: the exploration of sound. This is not to say that reduplicated babbling does not contribute to speech production, but rather that it does not arise in the context of speech development. Proposed relationships between reduplicated babbling and sound exploration and between reduplicated babbling and word comprehension and production now must be tested in research that incorporates alternative cognitive hypotheses, online measures of speed or accuracy in word comprehension and a larger group of infants.
APPENDIX A: VOCALIZATION TYPES

APPENDIX B
Two types of preliminary multilevel models were tested for each dependent measure: an unconditional means model, and several unconditional growth models (Singer & Willett, Reference Singer and Willett2003). These models provided useful information for determining proper model specification and served as a baseline for subsequent model comparisons.
Total variance was partitioned into three levels: variance between infants (Level-3; L3), within infants between sessions (Level-2; L2) and within infants within sessions (Level-1; L1). Unconditional means models were used to partition residual outcome variance without regard to time; unconditional growth models were used to partition variance after accounting for time-related trends (Singer & Willett, Reference Singer and Willett2003). Subsequent models included predictor variables in an attempt to account for additional variance. Predictor variables included gender, an L3 predictor, and several L2 predictor variables, including time (e.g. number of months before babble onset), age and developmental milestones. Effects of gender were not significant in any of the models.
Unconditional means model
Beginning with an unconditional means model, variance was represented at three levels.
(1) Level-1: durationijk=π0jk+eijk
Level-2: π0jk=β00k+r0jk
Level-3: β00k=γ000+u00k
Subscripts in this model and a subsequent model represent: particular vocalizations (i), in particular sessions (j), for particular infants (k). Thus at L1, durationijk refers to the duration of vocalizationi in sessionj for infantk. At L-1, durationijk is a function of the session mean (π0jk), and random deviation (eijk) of vocalizationijk's value from the session mean (i.e. a vocalization effect). At L2, π0jk is a function of the mean duration for infantk (β00k), and deviation (r0jk) of sessionjk's mean from the mean of infantk (i.e. a session effect). At L3, β00k is a function of the grand mean (γ000), and deviation (u00k) of infantk's mean from the grand mean (i.e. an infant effect).
If estimates of variance were significant at all three levels, all three levels were retained in subsequent models. Duration was the only vocalization parameter for which variance at L3 was significant. For number of sounds and the remaining four dependent variables, the estimated variance at L3 was not significant in either the 3-level unconditional means model or the 3-level unconditional growth model. Therefore, L3 was dropped and 2-level models were tested, with one exception. For number of CV syllables, although the estimated variance at L3 was not significant in the 3-level unconditional means model (z=0·71, p=0·24), it was marginally significant in the 3-level unconditional linear growth model (z=1·26, p=0·10). Therefore, L3 was retained in subsequent analyses for number of CV syllables. Two-level models included only L1 (variance within infants within sessions) and L2 (variance within infants between sessions). For number of sounds and each of the remaining dependent variables, approximately 10–20% of the variance was within infants between sessions (L2) and approximately 80% was within infants within sessions (L1).
Continuous models
Unconditional, continuous growth models of duration included the variable, time, at L2 with random effects at L3. The model shown below is a linear growth model.
(2) Level-1: durationijk=π0jk+eijk
Level-2: π0jk=β00k+β01jk (time)jk+r0jk
Level-3: β00k=γ000+u00k
β01k=γ010+u01k
The intercept at L1 (the individual growth model) is represented by π0jk and the L1 random component is represented by eijk. The L1 intercept becomes an outcome variable at L2; the linear slope at L2 is represented by β01jk. The intercept and slope at L2 become outcome variables at L3. Because significant variance remained, model fitting continued with the inclusion of additional predictor variables.
Discontinuous models
Discontinuous models probed for evidence of discontinuity in the shape of change over time. Three main types of discontinuity are: discontinuity in elevation (an abrupt vertical change in the value of the dependent variable), discontinuity in slope (a sharp change in the direction or angle of the slope) and discontinuity in both elevation and slope. Six variables associated with the developmental milestones were created to test discontinuous models: three variables to test discontinuity in elevation, and three variables to test discontinuity in slope. The three variables created to test discontinuity in elevation were: babble onset, created to test change in elevation associated with the emergence of reduplicated babbling; word comprehension, to test change in elevation associated with the emergence of word comprehension; and word production, to test change in elevation associated with word production. The three growth variables created to test discontinuity in slope were: post-babble, created to test change in slope after the onset of reduplicated babbling; post-comprehension, to assess change in slope after the onset of word comprehension; and post-production, to assess change in slope after the onset of word production.
Model adequacy and fit were determined by theoretical considerations (e.g. inclusion of developmental events) and measures of model fit. Goodness of fit was determined by deviance change tests (based on the difference between two nested models in measures of deviance) and fit indices based on parsimony, Akaike's Information Criterion (AIC) and the Bayesian Information Criterion (BIC).