INTRODUCTION
Polychaetes are important members of the macrofauna, found in nearly every marine habitat, from intertidal to the deepest sediments (Rouse & Pleijel, Reference Rouse and Pleijel2001). They are among the marine invertebrates with the greatest morphological diversity, which is most likely related to their occurrence in a wide variety of habitats (Pardo & Amaral, Reference Pardo and Amaral2006).
The Nereididae family is among the most diverse families of polychaetes, with over 540 described species in 43 genera (Hutchings et al., Reference Hutchings, Wilson, Glasby, Paxton, Watson Russell, Beesley, Ross and Glasby2000). They are more common in shallow waters, but occur in a wide range of environments from deep localities to estuaries, streams, temporary pools of rainwater and wet terrestrial environments (Wilson, Reference Wilson, Beesley, Ross and Glasby2000). There are 91 species of nereidids registered in Brazil, with 40 of these occurring in the north-east (Amaral et al., Reference Amaral, Nallin, Steiner, Forroni and Gomes Filho2012).
Population studies are essential to understand the processes that act on the structure and function of ecosystems. Dispersion, growth, birth and mortality are processes that structure populations and indicate the amount of matter and energy that pass across those populations within the food web. Studies of the population dynamics of polychaetes in Brazil have increased over the past decade, and the following species of the Nereididae have been studied: Laeonereis culveri (= acuta) (Webster, 1879) by Omena & Amaral (Reference Omena and Amaral2000) and Florêncio (Reference Florêncio2000) and Nereis oligohalina (Rioja, 1946) by Pagliosa & Lana (Reference Pagliosa and Lana2000).
Alitta succinea Leuckart, 1847 is the senior synonym for Nereis succinea Frey & Leuckart, 1847; Neanthes (Nereis) succinea Frey & Leuckart, 1847; Nectoneanthes oxypoda Imajima, 1972; Nereis alatopalpis Wesenberg-Lund, 1949 and Nectoneanthes alatopalpis Wu et al., 1985. This species is widely recorded in both northern and southern hemispheres, both in the Atlantic Ocean and in the Pacific Ocean (Villalobos-Guerrero, Reference Villalobos-Guerrero, Low Pfeng and Peters Recagno2012). Alitta succinea, previously was thought to be a native of the Atlantic coast of the Americas, (ISSG, 2007). However, it is now suspected that this species is native to the North Sea (Villalobos-Guerrero, Reference Villalobos-Guerrero, Low Pfeng and Peters Recagno2012). The introduction of this species occurs by ships' ballast water, due to its fouling on hulls of boats and also as the result of shellfish culture (Hewitt et al., Reference Hewitt, Campell, Thresher, Martin, Boyd, Cohen, Curril, Goman, Keough, Lewis, Lockett, Mays, McAurthur, O'Hara, Poore, Ross, Storey, Watson and Wilson2004; ISSG, 2007).
Alitta succinea is euryhaline in its salinity tolerance and occupies a variety of marine and estuarine intertidal to subtidal, infaunal and epifaunal habitats, including sand and mud bottoms, seagrass meadows, rocky benthic areas, mussel and oyster beds and dock pilings (Craig et al., Reference Craig, Thoney, Schlager and Hutchins2003; Pardo & Dauer, Reference Pardo and Dauer2003; Gillet et al., Reference Gillet, Surugiu, Vasile, Metais, Mouloud and Simo2011). The mature individuals leave their protective burrows at night and swim to the surface to spawn (Carpelan & Linsley, Reference Carpelan and Linsley1961).
Alitta succinea organisms tolerate a wide range of temperatures, although low temperatures directly affect the growth of the species because it suppresses feeding (Villalobos-Guerrero, Reference Villalobos-Guerrero, Low Pfeng and Peters Recagno2012).
In Brazil, there are records of Alitta succinea in the States of Pará, Piauí, Rio Grande do Norte, Sergipe and from Bahia to the Santa Catarina coast (Amaral et al., Reference Amaral, Rizzo and Arruda2005). This work provides the first record of occurrence of this species for the State of Pernambuco, Brazil.
The aim of this work was to study the dynamics of Alitta succinea population growth from the Pina Basin, a tropical estuary in north-eastern Brazil.
MATERIALS AND METHODS
Sampling sites and data collection
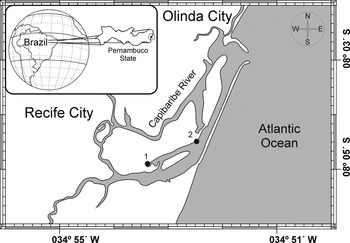
Samples were collected at two points (Figure 1) in the polyhaline region of the Pina Basin estuary (very polluted environment): lower intertidal (exposed to air at low tide regime) and shallow subtidal (permanently submerged), both on a consolidated substrate. The climate of the study area is classified according to Köppen's classification as Tropical Hot and Humid with autumn and winter rains. It is characterized by distinct periods of rainfall patterns, with a drought or dry season that occurs from September to February and a rainy season from March to August (Santos, Reference Santos, Bezerra, Costa and Feitosa2009).
Geographical location of the sampling sites of Alitta succinea specimens at Pina Basin, Pernambuco, Brazil.

The measurement of water salinity was performed using a refractometer (Ningbo Utech International) with precision 1‰ (REF201/211/201bp; China), and the water temperature was measured using a decimal thermometer (Incoterm), precision 1°C.
Every month, 15 samples were collected over the period from October 2009 to March 2011 during low tide. At the first point five samples were collected monthly in each zone (lower intertidal and shallow subtidal) and at the second point five samples were collected monthly from the shallow subtidal zone, because the consolidated substrate occurs only at these points in this zone. All collections were performed with the aid of a 0.01 m2 delimiter.
The samples were stored in plastic bags for later fixation, sorting and identification in the laboratory. The fixation of the samples was performed with 4% saline formaldehyde, and they were preserved with 70% alcohol.
Morphometric studies
Regressions were performed between several body measurements of Alitta succinea to find the isometric measure that produced the smallest error in relation to the total length and included the largest number of animals in the analysis of growth, because many animals lose body parts in the process of sample collecting and processing:
-
(1) Total length of entire individuals × 6th setiger width.
-
(2) Total length of entire individuals × 13th setiger width.
-
(3) Total length of entire individuals × length from the prostomium to the 25th setiger.
Population density
The monthly density variation was compared for each site using the Kruskal–Wallis and Dunn's a posteriori tests because the density data were heteroscedastic, even after transformation.
The comparison of densities between the two sites was performed using ANOVA, with the density data transformed into Log10 (x +1).
The parameters of temperature and salinity were correlated with the average density of A. succinea by the coefficient ‘r’ Pearson.
Analysis of growth (growth models)
A total of 2064 individuals of Alitta succinea were measured for growth analysis, and the measure used was the length of the prostomium to the 25th setiger.
Growth parameters were estimated from the length–frequency distribution data according to the following steps: first, separation of modes by the Bhattacharya method (Reference Bhattacharya1967) in the FISAT II software, v. 1.2.2 (Gayanilo et al., Reference Gayanilo, Sparre and Pauly2005) by size-class (intervals of 1 mm); second, identification of the growth increment through the ‘linking of means’ tool; and third, estimation of growth curves from these three different functions:
-
(1) von Bertalanffy (Beverton & Holt, Reference Beverton and Holt1957) (VBGF);
-
(2) Gompertz (1875, cited in Campana & Jones, Reference Campana, Jones, Stevenson and Campana1992) (GGF);
-
(3) Richards (Richards, Reference Richards1959) (RGF).
To evaluate the growth curve that best represents the data, Akaike Information Criteria (AIC) adapted after Akaike (Reference Akaike1974) was used, depending on the likelihood and the minimum number of parameters of the model using the following equation:
 $$AIC=2\log \left(\theta \right)+2K$$
where θ = a minimum likelihood and K = number of model parameters. Then was calculated the variation from the smallest value of AIC (Δ i ) and the importance of each model (W i ), defined as
 $$W_i=\exp \lpar - 0.5\Delta _i \rpar 100/\Sigma \Delta _i.$$
The upper and lower limits (95%) for the confidence intervals of each estimated growth parameter were established using likelihood and bootstrap analysis, both with 1000 interactions (Hood, Reference Hood2006).
The maximum longevity was estimated using the L max (maximum length) equal to 95% and 99% of L ∞ using the equation proposed by Caillet et al. (Reference Caillet, Smith, Mollet and Goldman2006).
The length–frequency data from various sites were compared using a G test (Zar, Reference Zar1999), which has a similar distribution to the χ2 distribution with the same number of degrees of freedom as the χ2 test.
The instantaneous mortality rate (Z) was calculated by a simple negative exponential model with the catch curve converted to the length method (Pauly et al., Reference Pauly, Moreau and Abad1995) in the FISAT II software (Gayanilo et al., Reference Gayanilo, Sparre and Pauly2005).
The growth performance index (ϕ′) defined by Pauly & Munro (Reference Pauly and Munro1984) was used to measure the growth performance between species.
To measure the recruitment pattern, the individuals that had up to 5 mm of length from the prostomium to the 25th setiger were considered recruits because these specimens composed the smaller size-class found throughout the sampling period.
RESULTS
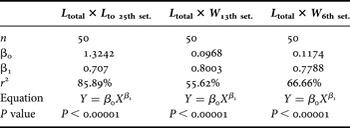
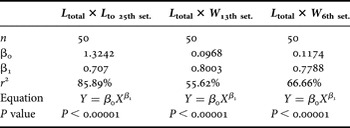
The relationship between the total length and the length to the 25th setiger showing the best fit with the highest coefficient of determination (Table 1). This measure was adopted for the study of growth and to estimate the length from the prostomium to the 25th setiger of juveniles that had less than 25 setigers.
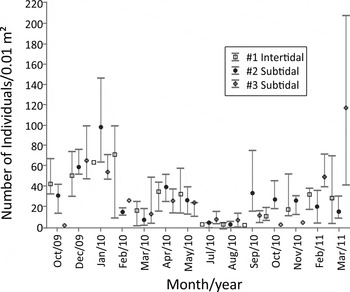
Median density (N = 5) of Alitta succinea at Pina Basin, Pernambuco, Brazil. Vertical bars denote the non-outlier range.

Meristics relationships of Alitta succinea collected in the Bacia do Pina estuary, Pernambuco, Brazil.

L, length; W, width; n, sample size; β0, β1, constant of model; r 2, coefficient of determination.
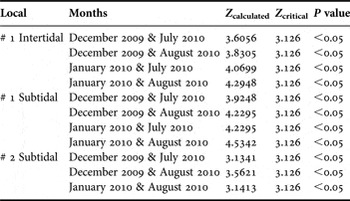
Alitta succinea occurred in all sampling months, with median densities between 1 and 120 individuals per 0.01 m− 2 (Figure 2). Differences between polychaete densities of the two sampling sites were not significant (F(2; 219)= 0.696; P = 0.5). Differences in A. succinea densities were statistically significant between dry season (December 2009 and January 2010) and rainy season (July and August 2010) (Table 2) for the two sampling sites, with the lowest average densities found during the last one (Figure 2).
Kruskal–Wallis/Dunn analysis showing the months in which there were significant differences between their respective densities (g.l.= 14.60).

The monthly variation of density was not significantly correlated with the temperature and salinity of the studied area (r = 0.330 and r = 0.351, respectively).
The sizes structures in the two sampling sites were not significantly different (G = 16.27, P = 0.64). For this reason, we used the frequency–length histogram with the sum of all samples for the growth analysis.
The resulting growth performance index (ϕ′) was 2.86.
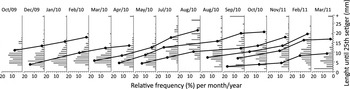
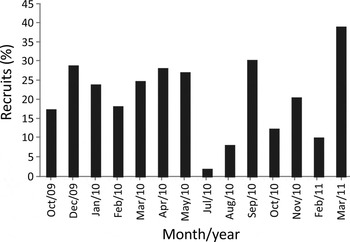
Using the Bhattacharya method for the analysis of modal progression, we identified eight cohorts varying from two to five modal groups per month; six of these cohorts are found both in the dry and in the wet season (Figure 3). The lowest recruitment values, 1.72% and 8.08% were found in July and August 2010, respectively, and the remaining months had numbers of recruits that were representative of the total population (Figure 4).
Absolute frequency and the modal groups, identified by Bhattacharya method and selected by the ‘Linking of means’ tool, of Alitta succinea during the period from October 2009 to March 2011 at Pina Basin, Pernambuco, Brazil.

Recruitment pattern of Alitta succinea during the period from October 2009 to March 2011 at Pina Basin, Pernambuco, Brazil.

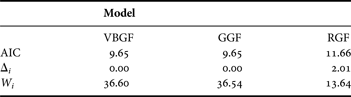
After estimating the growth parameters for the three proposed models (Table 3), the AIC was calculated. From this criterion, the von Bertalanffy and Gompertz models presented the best fits with the growth curve of A. succinea for the period studied (Table 4) because they showed the lowest values of AIC.
Growth parameters of three tested models: von Bertalanffy (VBGF), Gompertz (GGF) and Richards (RGF).

L ∞, asymptotic length; k, growth constant, on a daily basis; t0, age in the length; L t, 0; k′, a, b and m are model constants.
Analysis of the Akaike information criterion curves for von Bertalanffy (VBGF), Gompertz (GGF) and Richards (RGF).

Δ i , variation from the smallest value of AIC; W i , importance of each model.
The von Bertalanffy model was chosen to estimate the growth parameters because it estimated biological parameters closer to the observed values. For L ∞, k and t 0, the upper limits were 40.23, 3.24 and −0.03, and the lower limits were 7.20, 0.01 and −0.16, respectively.
The maximum calculated longevity, which was based on 95% and 99% of the value of L max, indicates that specimens of Alitta succinea have a lifespan of between 586 and 953 d (1.6–2.6 yr).
The instantaneous mortality rate (Z) was 1.53 yr−1.
DISCUSSION
The size estimation of polychaete worms is a fundamental question in studies of population ecology, secondary production and morphometric analysis. To determine the cohorts and age groups of the populations of invertebrates, the total length, biomass and some hard appendages (mandibles and teeth) are frequently measured. This type of study, which requires the analysis of large numbers of specimens representing all size-classes, is sometimes difficult because of the occurrence of mechanical breaks and autotomy during sampling and processing (Desrosiers et al., Reference Desrosiers, Vincent, Retiére and Boucher1988).
Several morphometric studies have been performed with other nereidid species to identify the measure that has the highest fit with total length. Omena & Amaral (Reference Omena and Amaral2001) concluded that, for Laeonereis culveri, measurement of the setiger width provides a better estimation of the body size than partial length measurements, and the width of the 6th setiger presented the greatest correlation coefficient. Martin & Bastida (Reference Martin and Bastida2006) found for the same species a greater correlation between the width of the first setiger and total length. Pagliosa & Lana (Reference Pagliosa and Lana2000) found similar results to this present study for Nereis oligohalina, with the greatest correlation between the length of the prostomium to the 25th setiger and the total length.
The monthly variation of Alitta succinea density, with lower densities in the rainy season, has not been characterized as a seasonal pattern because temporal replicates (two years of sampling) have been lacking. However, our results indicate that the increased rain common in months of the rainy season is associated with the recruitment pattern because the lowest numbers of recruits in the population occur in the months with higher rainfall, which is the predominant factor that affects the life cycle of the A. succinea population in the studied environment. In this environment, we did not find well-defined seasons as in other locations further from the equator, and there is a division of the annual dry season (low rainfall) and rainy season (higher rainfall).
Laeonereis culveri had the highest density in the summer months on a beach in south-eastern Brazil (São Paulo), and the authors suggested that the longer photoperiod, higher average temperatures and greater food availability may have influenced the change in population density (Omena & Amaral, Reference Omena and Amaral2000). Based on analysis of the Laeonereis culveri population from Rio de la Plata, Martin & Bastida (Reference Martin and Bastida2006) suggested that large population densities coincide with the period of highest recruitment rate (when a large number of juveniles are incorporated into the population). However, this pattern cannot be applied to the Alitta succinea population in this present study because recruitment occurs throughout the whole year and is reduced only in the rainy months, which corroborates the idea presented above, suggesting that rainfall is an important external factor controlling the population of this species in the Pina Basin region.
Besides the correlations between rainfall, low densities and low recruitment of A. succinea, the processes that may be influencing the population are not yet clear, which may be top-down or bottom-up. The population characteristics (rapid growth and continuous breeding) and the studied environment (the subtidal margin, where food is generally not a limiting resource) did not produce very high densities suggesting that top-down factors may control the population, such as predation or perturbation caused by harvesting of the bivalve Mytella charruana Orbigny, 1842, abundant in the same area and which A. succinea lives associated with. On the other hand, the less proportion of recruits during the rainy season suggests the existence of a bottom-up control of the polychaete population, probably due to a higher mortality during a larval stage or just after the recruitment. The abundance of Alitta succinea in the Danube–Black Sea Canal seems to be influenced especially by the recruitment of juveniles and by the development of clusters of bivalve molluscs, a bottom-up control (Gillet et al., Reference Gillet, Surugiu, Vasile, Metais, Mouloud and Simo2011).
The identification of eight cohorts with overlap between them and high recruit percentages indicate that the A. succinea recruitment period is continuous, which could be due to the stability of the water temperature in tropical environments because they have little oscillation independent of season, unlike that which occurs in temperate environments. This fact may explain the big difference in number of cohorts when compared to results reached by Gillet et al. (Reference Gillet, Surugiu, Vasile, Metais, Mouloud and Simo2011)—only three cohorts per year, with no overlap between them for an Alitta succinea population from a temperate environment that suffers a wide variation in water temperature, between 1 and 28.5°C.
Most nereidids exhibit continuous recruitment, as in Nereis diversicolor Müller, 1776 (Gillet, Reference Gillet1990), Laeonereis culveri (Florêncio, Reference Florêncio2000; Omena & Amaral, Reference Omena and Amaral2000), Nereis oligohalina (Pagliosa & Lana, Reference Pagliosa and Lana2000). The smallest numbers of recruits, found in July and August 2010, coincided with the wettest months of the rainy season.
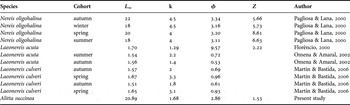
The growth parameters of the von Bertalanffy's model are appropriate for the dataset obtained from the study area. However, the estuary suffers a strong human impact due to scraping of the substrate to collect bivalves, leading to depletion of A. succinea specimens of greater lengths. Thus, the parameters are found for a population that is suffering from a strong anthropogenic impact. The value of k for A. succinea is considered low compared to that found by Pagliosa & Lana (Reference Pagliosa and Lana2000) (Table 5) for Nereis oligohalina. The low k value is most likely due to the depletion of larger specimens (more than 15 mm from the prostomium to the 25th setiger).
Growth parameters obtained and calculated from four different studies for comparison with the present work.

L ∞, maximum length; k, growth constant; ϕ, growth performance index; Z, instantaneous mortality.
The mortality rate found was relatively low compared to other studies, even with the negative impact of bivalve harvesting, demonstrating that this activity does not affect the entire population, resulting in a fast recovery.
According to Pauly & Munro (Reference Pauly and Munro1984), closely related species have similar values of ϕ′, and each taxon must have a particular distribution of values that are different from other taxa and can be expressed by the average value. Comparing the ϕ′ value found in this study with those of other species estimated from their respective growth parameters, we found that A. succinea has a value closer to the estimated values for Nereis oligohalina (Pagliosa & Lana, Reference Pagliosa and Lana2000) than the values from the species Laeonereis culveri (Florêncio, Reference Florêncio2000; Omena & Amaral, Reference Omena and Amaral2000; Martin & Bastida, Reference Martin and Bastida2006). This result is observed because, among these compared species, A. succinea belongs to a genus that is phylogenetically more related to Nereis, thus corroborating the initial assumption of Pauly & Munro (Reference Pauly and Munro1984).
The growth and longevity rates identified for the A. succinea population are consistent with those of other species with an r-demographic strategy, among which we found individuals with shorter life spans and high growth rates. Additionally, due to this strategy, many offspring are produced; consequently, their numbers are nearly uniform during all months of the year, except for the two wettest months of the rainy season (July and August), when there is a reduction in the recruitment rate.
Finally, we note that, although the studied population suffers anthropogenic impacts, this study represents well the life cycle of Alitta succinea. This species is highly representative of estuarine fauna, both locally and in several other places around the world, and it easily adapts to degraded and anthropogenic environments; therefore it could serve as a bioindicator species for tropical polluted estuaries.
ACKNOWLEDGEMENT
We thank Cinthya Simone Gomes dos Santos for help with the identification of the earliest specimens.
FINANCIAL SUPPORT
This research was partially supported by Fundação de Amparo à Ciência e Tecnologia do Estado de Pernambuco—FACEPE (Grant number BIC-0586-2.05/10).