




No CrossRef data available.
Article contents
A single nucleotide polymorphism map of the mitochondrial genome of the parasitic nematode Cooperia oncophora
Published online by Cambridge University Press: 16 April 2004
Abstract
The 13 636 bp mitochondrial (mt) genome sequence of the trichostrongylid nematode Cooperia oncophora was determined.Sequence data have been deposited in the EMBL/GenBank Data libraries under Accession number AY265417. The single nucleotide polymorphisms have been deposited in the dbSNP Database (http://www.ncbi.nlm.nih.gov/SNP) under ID numbers ss8485731-ss8486156. Like the mt genomes of other nematodes it is AT rich (76·75%) and cytidine is the least common nucleoside in the coding strand. There are 2 ribosomal RNA (rrn) genes, 22 transfer RNA (trn) genes and 12 protein coding genes. The relatively short AT-rich region (304 bp) and the lack of a non-coding region between two of the NADH dehydrogenase genes, nad3 and nad5, makes the mt genome of C. oncophora one of the smallest known to date, having only 525 bp of non-coding regions in total. The majority of the C. oncophora protein encoded genes are predicted to end in an abbreviated stop codon like T or TA. In total, 426 single nucleotide polymorphisms (SNP) were mapped on the mt genome of C. oncophora, which is an average of 1 polymorphism per 32 bp. The most common SNPs in the mt genome of C. oncophora were G/A (59·2%) and C/T (28·4%) transitions. Synonymous substitutions (86·4%) were favoured over non-synonymous substitutions. However, the degree of sequence conservation between individual protein genes of different parasitic nematode species did not always correspond to the relative number of non-synonymous SNPs. The mt genome sequence of C. oncophora presents the first mt genome of a member of the Trichostrongyloidea and will be of importance in refining phylogenetic relationships between nematodes. The, still limited, SNP map presented here provides a basis for obtaining insight into the genetic diversity present in the different protein coding genes, trn, rrn and non-coding regions. A more detailed study of the more variable regions will be of use in determining the population genetic structure of C. oncophora. Ultimately this knowledge will add to the understanding of the host–parasite relationship.
Keywords
Information
- Type
- Research Article
- Information
- Copyright
- © 2004 Cambridge University Press
INTRODUCTION
Cooperia oncophora, an economically important parasitic nematode of cattle, belongs to the superfamily of Trichostrongyloidea. Studies of population structures at the genetic level of several strongylid species have given insight into host–parasite relations (Blouin et al. 1995). Mitochondrial (mt) DNA, in particular, is very informative in studying aspects like population history, population size and population subdivision (Blouin et al. 1992; Tarrant et al. 1992; Dame, Blouin & Courtney, 1993) owing to its strict maternal inheritance, high mutation rate and absence of recombination (Gyllensten, Wharton & Wilson, 1985; Anderson et al. 1995).
The metazoan mt genome is circular and varies in size between 14 and 18 kb (Wolstenholme, 1992; Boore, 1999). For parasitic nematodes the mt genome usually encodes 12 proteins (atp6, cob, cox1-3 and nad1-4, 4L, 5-6) which are the components of the respiratory chain enzyme complexes (Okimoto et al. 1992; Keddie, Higazi & Unnasch, 1998; Hu, Chilton & Gasser, 2002), with the exception of Trichinella spiralis which, in addition, encodes a putative atp8 gene (Lavrov & Brown, 2001). Additionally the mt genome codes for 22 transfer RNAs (trn) and 2 ribosomal subunit RNAs (rrn). It generally contains at least 1 non-coding region which is assumed to have a function in the regulation of transcription and control of DNA replication of the mt genome (Clayton, 1982). Mt genomes have been sequenced from Caenorhabditis elegans, Ascaris suum (Okimoto et al. 1992), Onchocerca volvulus (Keddie et al. 1998), Trichinella spiralis (Lavrov & Brown, 2001), Ancylostoma duodenale and Necator americanus (Hu et al. 2002). The mt genome of C. oncophora presents the first member of the Trichostrongyloidea and its study can contribute to a further understanding of nematode evolution.
One of the aspects making mtDNA a good marker for studying population structures is the higher rate of evolution in mt genomes compared to the nuclear genome, probably caused by frequent exposure of mtDNA to reactive oxygen metabolites (Wolstenholme, 1992; Boore, 1999; Wallace, 1999). Therefore, the mt genome of C. oncophora was chosen as a target for identifying molecular markers since the higher rate of base substitution facilitates the characterization of single nucleotide polymorphisms (SNPs). To identify regions apparently enriched in variable positions an approach was taken whereby each position on the mt genome was determined from at least 3 different individuals. The generated data will provide a better view of the genetic diversity present in C. oncophora populations and ultimately contribute to dissecting the genetic population structure.
MATERIALS AND METHODS
Parasites and DNA isolation
Adult parasites were obtained from the intestine of female Holstein Friesian calves 28 days after infection (p.i.) with 100000 infective C. oncophora larvae (L3). Before infection random samples of larvae were microscopically verified as being C. oncophora. Contamination with heterologous species of trichostrongylids was ruled out because samples of larvae were differentiated to the generic level by microscopical examination (MAFF, 1986). DNA used as template in the PCR was obtained from a pool of worms and individual C. oncophora adults that were also carefully checked on the basis of generally accepted morphological criteria (MAFF, 1986). Total DNA was isolated by proteinase K digestion and phenol extraction as described previously (Roos et al. 1990). To confirm that the isolated DNA was from C. oncophora a Cooperia-specific COX1 PCR was performed using the primers COX1FN 5′TAATGCCTAGTATAAT(C/T)GGTGGTTT′3 and COX1RN 5′CCCAGCTAAAACAGGTAAAGATAAT′3.
Long template PCR amplification
The complete mt DNA was amplified from 5 ng of total genomic DNA isolated from pooled (20 mg) adult worms by means of two overlapping long PCR reactions. COX1FN in combination with NAD6R 5′TTTAAATACAACTTTACTCCTGCTCTT′3 covered a ~6 kb region. The second combination of COX1RN and NAD6F 5′CATATTTGGTTTTCTTACTTTATTTG′3 yielded a ~8 kb product. The primers COX1FN and COX1RN are based on the sequence of the partial cox1 gene from C. oncophora (Accession numbers: AY229868-AY229873). The NAD6F and R primers are based on the nad6 gene sequence of Ascaris suum and Caenorhabditis elegans (Okimoto et al. 1992). The Expand Long Template PCR system (Roche, Mannheim, Germany) was used for amplification of the two fragments. Cycling conditions were according to the manufacturer's protocol with modifications to annealing temperature. In short, 2 min initial denaturation at 92 °C followed by 10 cycles of 30 s denaturation at 92 °C, 30 s annealing at 55–50 °C lowering each cycle with 0·5 °C and 12 min extension at 68 °C, followed by 30 cycles of 30 s denaturation at 92 °C, 30 s annealing at 50–45 °C and 12 min at 68 °C with an additional cycle elongation of 20 s for each cycle and a final cycle of 7 min at 68 °C. The amplicons were digested with MboI and TaqI to produce overlapping clones. The restriction fragments were directly cloned into a compatible digested (BglII or NarI) pUC-PCR vector (de Vries, 1998). A total of 38 clones, ranging in size from 100–2000 bp, were sequenced on both strands with universal M13 sequencing primers. Since the mt sequence was amplified from a large pool of worms (>5000 individuals), it can be assumed that each clone contained a sequence from a different individual. The AT-rich parts of the mt genome were difficult to clone. Therefore, these parts were amplified and sequenced directly from individual worms. Also the parts of the mt genome that were covered by less than 3 clones were amplified and sequenced directly from individual worms, up to a minimum of 3 sequences for each region. In total an additional 35 fragments, ranging in size from 309–846 bp, covering the parts with gaps and insufficient number of clones were obtained by long PCR reactions performed on single worms. Each individual worm was used only once. Primers for additional PCR reactions were designed on the sequences derived from the C. oncophora mitochondrial clones. Long PCR was performed according to the manufacturer's instructions (see above). Depending on the predicted length of the sequence the elongation time and annealing temperature were adjusted. The complete mt genome was sequenced at least 3 times on both strands.
Sequence analysis
Clones and amplicons were purified using the GFX™ purification kit (Amersham Biosciences). Samples were sequenced by BaseClear B.V. (Leiden, The Netherlands) using terminator chemistry (Perkin Elmer) and an Applied Biosystems 3100 genetic analyser. The LaserGene 5.03 package (DNAStar Inc., Madison, WI, USA) was used for all sequence analyses. The SeqMan program was used for sequence assembly and identification of the SNPs. All SNPs were sequenced on both strands and manually checked by inspection of the trace files. Alignment with the C. elegans mt DNA sequence and BLAST analysis were used for identification of the genes. EditSeq was used to translate the protein coding genes using standard genetic codes with the modifications ATA (Met), AGA and AGG (Ser) and TGA (Trp) specific for the nematode mt genetic code (Okimoto et al. 1992; Jukes & Osawa, 1993). Determination of the AT content and codon usage was also done with the EditSeq program. MegAlign was used for alignment of the C. oncophora amino acid sequences with those of Ancylostoma duodenale, A. suum, C. elegans, Necator americanus, Onchocerca volvulus and Trichinella spiralis. Pairwise alignments were performed by the ClustalW slow/accurate method (Thompson, Higgins & Gibson, 1994), calculation of percentage identity between pairs was based on the shortest sequence, with default parameters. The aligned sequences were imported into ClustalX (Thompson et al. 1997) and unrooted phenograms were constructed by the Neighbour-Joining (NJ) algorithm using 1000 bootstrap replicates. Phenograms were drawn using NJplot (Perriere & Gouy, 1996). GeneQuest was used to scan non-coding regions for repeats. The mt sequences from the other nematodes were downloaded from Genbank, Accession numbers; A. duodenale: AJ417718 and N. americanus: AJ417719 (Hu et al. 2002), A. suum: X54253 and C. elegans: X54252 (Okimoto et al. 1992), O. volvulus: AF015193 (Keddie et al. 1998) and T. spiralis AF293969 (Lavrov & Brown, 2001). The partial nad4 sequences from Haemonchus placei AF070825-AF070786, Haemonchus contortus AF070785-AF070746, Teladorsagia circumcincta AF070916-AF070877 and Mazamastrongylus odocoilei AF070876-AF070837 (Blouin et al. 1995).
RESULTS
General characteristics
In total 73 fragments (47161 bp total length, 3·5-fold coverage) were sequenced on both strands and assembled in a single contig. Similar to other nematode mt genomes, the mt genome of C. oncophora is AT rich (76·25%) and has an unequal nucleotide composition in the coding strand (29·8% A, 46·94% T, 15·94% G and 6·43% C). The mt genome contains the genes (Table 1) for 12 proteins (3 subunits of cytochrome c oxidase, cox1, cox2 and cox3; 1 subunit of cytochrome c-ubiquinol oxidoreductase, cob; 7 subunits of NADH dehydrogenase, nad1, nad2, nad3, nad4, nad4L, nad5 and nad6; and 1 subunit of the ATP synthase, atp6); 22 tRNAs (trns) and the small and large subunit ribosomal RNAs, rrnS and rrnL. As in other nematodes, possibly with the exception of T. spiralis (Lavrov & Brown, 2001), an atp8 gene is absent in C. oncophora. The relative order of the genes in the mt genome of C. oncophora (Fig. 1) is identical to that in A. duodenale, C. elegans and N. americanus (Okimoto et al. 1992; Hu et al. 2002). Whereas in A. suum the AT-rich region is located between the trnS (UCN) and trnN genes and in O. volvulus and T. spiralis also a number of trns and protein coding genes are located differently (Okimoto et al. 1992; Keddie et al. 1998; Lavrov & Brown, 2001). After correction for the different location of the genes and AT-rich region of O. volvulus and A. suum the percentage identity is the highest with A. duodenale (79·8%), followed by N. americanus (78·4%), C. elegans (75·6%), A. suum (72·0%) and O. volvulus (56·7%) (Table 1).

Fig. 1. Schematic representation of the mitochondrial genome of Cooperia oncophora. Transcription of the genes is predicted to be all in the same direction (from left to right). AT represents the AT-rich non-coding region. The Long Non-coding (LNC) region is shaded, the length of the other 9 non-coding regions is given below. The trn genes are represented by their one letter amino acid code at the top.
Table 1. Sequence pair distances in percentage identity from the amino acid sequences of the 12 protein coding genes and the nucleotide sequences of the 2 rrn genes, AT-rich non-coding region and the complete mt genome (Comparison of C. oncophora (Co) with A. duodenale (Ad), A. suum (As), C. elegans (Ce), N. americanus (Na), O. volvulus (Ov) and T. spiralis (Ts). The protein coding genes are listed from most conserved between C. oncophora and the other nematodes (except O. volvulus and T. spiralis) to least conserved. The ratio synonymous/non-synonymous SNPs for the protein coding genes of C. oncophora is given.)

Protein genes and codon usage
The genes of the mt genome of C. oncophora are arranged in an extremely economic fashion with a complete absence of intergenic sequences between many gene pairs (Fig. 1). Only 11 intergenic regions were found, the lowest number of intergenic regions identified in a nematode mt genome to date.
Eight out of the 12 protein genes terminate with abbreviated translation stop codons, illustrating the optimal use of sequence (6 times T and 2 times TA, see Table 2). Alternative initiation codons such as ATT, ATA and TTG have been described for other nematode mt genomes (Okimoto et al. 1992; Keddie et al. 1998; Hu et al. 2002). The ATT initiation codon, coding for isoleucine, is used 7 times as a start codon, ATA is used as the start codon for the cob gene and the remaining 4 genes, cox3, nad1, nad2 and nad4, employ a TTG codon (Table 2).
Table 2. Nucleotide position, AT content (%), for the genes and 2 non-coding regions (AT-rich and Long Non-coding (LNC) region between nad4 and cox1) of the Cooperia oncophora mt genome (The translation initiation and termination codons and the number of amino acids (aa) of the inferred protein coding genes are given. To assist localization of the 9 short non-coding regions, positions preceded by a non-coding region are shown in bold.)

Table 1 shows the percentage identities for the inferred amino acid sequences of the protein genes from C. oncophora compared with A. duodenale, A. suum, C. elegans, N. americanus, O. volvulus and T. spiralis. Except for cox1, T. spiralis has the lowest similarity scores when compared with C. oncophora. The highest identity scores were found for the three cytochrome c oxidase subunits and the lowest identities were found for the nad2 and nad6 proteins. For O. volvulus and T. spiralis, this pattern is slightly different with, for instance, relatively well-conserved nad1 and cob genes and a poorly conserved atp6 gene. Fig. 2A presents an unrooted phenogram of the combined amino acid sequences encoded by the mt genome of different nematodes as derived from Neighbour-Joining (NJ) analysis. The tree clearly indicates the relative large phylogenetic distance of O. volvulus and T. spiralis to the other displayed nematodes. The AT bias and the preference of a G over a C in the coding strand has been established for other nematode mt genomes and is, of course, strongly reflected in the codon usage of C. oncophora mt protein coding genes (Table 3). The 10 most used codons (Phe (TTT), Leu (TTA), Ile (ATT), Tyr (TAT), Leu (TTG), Asn (ATT), Met (ATA), Val (GTT), Ser (AGT), Gly (GGT)) are all AT rich, and 7 contained a thymidine in the 3rd position. None of the most frequently used codons contained a cytidine. In contrast, the least used codons (Pro (CCC), Ala (GCC), Arg (CGA and CGG), Asp (GAC), Ile (ATC), Leu (CTA and CTC), Cys (TGC), Gly (GGC), Thr (ACC)) mostly contain a cytidine at the 1st or 3rd position. Only 2 codons were never used, (Ser (TCC) and Arg (CGC)).

Fig. 2. Neighbour-Joining (NJ) trees derived from mitochondrial data for 7 nematode species. (A) Data derived from the amino acid sequence of the 12 protein coding genes. (B) Data derived from the nucleotide sequences of the rrn genes. Bootstrap values are given at the branches.
Table 3. Frequencies (%) of amino acid (aa) codon usage in Cooperia oncophora mt genes (Codons that contained a polymorphic site (2·39%) are not included in the table.)

tRNA-rRNA genes
Phylogenetic analysis of the C. oncophora rrn genes with those of other nematodes resulted in the same order of conservation as observed for the protein-coding genes (Fig. 2B). The overall nucleotide sequences of the trns, which were between 52 and 61 bp, and the predicted secondary structure of the C. oncophora tRNAs were similar to those of other nematodes. General features of the trns, like a missing variable loop and TΨC arm, which are replaced by the TV replacement loop, were found for 20 of the trns. The overall secondary structure of 7 bp in the stem structure of the amino-acyl arm is also seen for C. oncophora. Mismatches in the amino-acyl arm stem structure were seen for 16 of the 22 trns and most are situated at the base of the stem concerning mostly T/G pairs. All 22 trns have a 5 bp anticodon arm stem combined with a 7 nt loop. As described for other nematodes the anticodon is preceded by a pyrimidine followed by a thymidine and the anticodon is followed by a purine. In only 8 cases a single mismatch in the anticodon stem was found. The consensus structure for the 20 trns having a dihydrouridine (DHU) arm consists of a 4 bp stem structure and a loop varying from 4–10 nt. In 16 out of 20 trns mismatches in the DHU stem were found, overall these are in the first or last bp and all but one were T/G pairs. The 2 trns that differed in basic structure, trnS (AGN) and trnS (UCN), lack the DHU arm and instead have a variable loop of 4 (UCN) or 6 (AGN) nt. The 2 trnSs also contain a TΨC arm which has a stem structure of 3 bp and a variable loop of 4 nt (AGN) and 5 nt (UCN).
Non-coding regions
The two longest non-coding regions, between trnA and trnP and between nad4 and cox1, are believed to be involved in regulation of transcription and control of DNA replication (Clayton, 1991; Okimoto et al. 1992). The location of the 304 bp non-coding AT-rich region (85·53% AT) between the trnA and trnP genes corresponds to its location in C. elegans, N. americanus and A. duodenale (Okimoto et al. 1992; Hu et al. 2002). The six 43 bp direct repeats present in the AT-rich region of C. elegans or any other direct repeat could not be detected in C. oncophora. Instead, 2 stretches of 8 consecutive AT dinucleotides are present. The second AT stretch has an overlap with an upstream inverted repeat of 18 bp separated by 1 G. Within the second longest non-coding region (69 bp) between the cox1 and nad4 genes (not present in O. volvulus) a hairpin structure could be formed (Fig. 3). The region is shorter as in the 4 other nematodes (Okimoto et al. 1992; Keddie et al. 1998; Hu et al. 2002) and the AT content is lower (78·26%). The other 9 intergenic regions of the C. oncophora mt genome vary in size from 4 to 23 bp. Secondary structures or repeated sequences could not be identified within these regions.

Fig. 3. Potential hairpin structure found within the long non-coding region between the cox1 and nad4 genes of Cooperia oncophora.
Single nucleotide polymorphisms
The mt genome of C. elegans appears to have a two orders of magnitude higher substitution rate, 9·7×10−8 (±2·4×10−8) per site per generation than previously estimated (Denver et al. 2000). Furthermore the mt genome has a lack of recombination and is strictly maternally inherited. Consequently sequences derived from the mt genome are an excellent target for identifying molecular markers which can be used for defining the population structure. For this reason variable positions were directly determined by sequencing fragments derived from multiple individuals rather than sequencing the complete mt genome from a single worm. Each position in the mt genome was sequenced from a minimum of 3 and maximum of 12 different individuals. Table 4 shows the 426 SNPs (1 polymorphism per 32 bp) detected in the 13636 bp mt genome of C. oncophora. No deletions or insertions were identified. A total of 58 SNPs (13·6%) give rise to amino acid substitutions. The nad4L gene contains the most SNPs, 1 polymorphism per 23·4 bp and nad6 gene the least, 1 per 43·8 bp. The degree of conservation of the individual genes in between the different nematode species (Table 1) is not very well reflected in the distribution of non-synonymous SNPs. For instance, one of the most conserved protein sequences like atp6 has 10 non-synonymous SNPs out of a total of 25 whereas the less well-conserved nad4 has only 1 out of 30.
Table 4. Single nucleotide polymorphisms (426) identified and mapped in the mitochondrial genome of Cooperia oncophora (For protein coding genes positions are given in bp starting at the first position of their translation initiation codon. For the trns, rrns and non-coding regions the nucleotides were numbered in the same direction as the protein coding genes. The incidence of nucleotides at each variable position is given in parenthesis after the nucleotide position where they occur and reflect the nucleotide sequence provided in the heading of each column (i.e. 75 (1/3) in the C/T column indicates that a position 75 one individual harboured a C while 3 other individuals harboured a T at the specific position). The bold position numbers indicate that the substitution is non-synonymous. The initiation (ini) and termination (ter) coordinates refer to the nucleotide positions in the complete mt genome sequence. The frequency given in parenthesis after the gene or region indicates the average occurrence of SNPs for that specific part of the mt genome.)

A bias for nucleotide transitions (G/A or T/C) over transversions in mtDNA was very distinct in the mt genome of C. oncophora. From all SNP positions, 59·2% were harbouring G/A transitions, 28·4% T/C transitions, 7·5% A/T transversions and 4·9% consisted of G/T, C/G and A/C transversions. There is only one case in which 3 different nucleotides were seen (A, C or T) in the same position. Most of the SNPs are synonymous third codon position changes (80·7%). Of the 267 SNPs found in the third codon position only 4 are non-synonymous. First and second codon positions are mainly non-synonymous (54 out of 67). The 12 synonymous first position changes are in Leu or Ser codons.
The number of SNPs found within the trn sequences is lower than average (1 polymorphism per 60 bp was identified instead of the 1/32 bp for the complete mt genome). This fits with the observation that trn sequences are better conserved than the other sequences. In general, within non-coding regions more variation is seen which is also the case in most non-coding regions of the C. oncophora mt genome. For instance, in the region between nad4L-trnW, which is 15 bp in length, 5 SNPs were discovered. The 13 bp region between trnK-trnL covered 3 SNPs. The one exception is the region between the nad4 and cox1 genes (69 bp), which is a relatively long non-coding region without a single SNP, suggesting that this region is indeed of importance for the integrity of the mt genome.
DISCUSSION
The 13636 bp mtDNA sequence of C. oncophora is the first reported from a trichostrongylid nematode and fits in size between those of N. americanus (13604 bp) and A. duodenale (13721 bp), the two smallest known mt genomes of nematodes (Hu et al. 2002). Although the fast evolution of mtDNA makes it often less useful for determining the phylogenetic relationships between closely related species, aspects like gene-order changes are often highly informative in reconstructing the phylogeny regarding branchpoints deeper in the tree. Here, the relative order of genes, the degree of conservation in pairwise comparisons of individual genes and the analysis of combined protein sequences or rrnS gene sequence consistently confirm the close relationship between C. oncophora, A. duodenale and N. Americanus (all Strongylida). Moreover, the Strongylida in the NJ tree form a clade with the Rhabditida (C. elegans) in the NJ tree as has been shown previously (Blaxter et al. 1998). The size reduction of the mt genome of C. oncophora in comparison to C. elegans and A. suum is mainly due to a short AT-rich region (304 bp). The hypervariability of the AT-rich region is clearly reflected by percentage nucleotide identity between the other nematodes and C. oncophora. Considering the AT content (85·53%) a percentage identity between 50 and 56% is insignificant. The hairpin structure which can be formed in the second longest non-coding region between the cox1 and nad4 gene did, in contrast to the hairpin structure in C. elegans and A. suum, not contain a stretch of Ts which is assumed to be involved in initiating second (L) strand synthesis (Okimoto et al. 1992).
The extremely efficient use of mtDNA as reflected in the utilization of abbreviated stop codons has already been described for the other nematodes. Most likely a TAA stop codon is created post-transcriptionally after polyadenylation, as is the case in other organisms (Anderson et al. 1981; Ojala, Montoya & Attardi, 1981). For A. duodenale, N. americanus, A. suum and O. volvulus abbreviated stop codons were found in genes preceding a trn in contrast with C. elegans where the genes terminating in T or TA were followed by a protein coding gene (Okimoto et al. 1992; Keddie et al. 1998; Hu et al. 2002). In C. oncophora T and TA stop codons are directly followed by either a trn or protein coding gene. No distinction could be made between the genes following a T or TA stop codon.
The SNP map of the complete mt genome of C. oncophora presented herein is the first of any parasitic nematode. An SNP map will be of use for studies on C. oncophora population genetics. The current SNP map covers every nucleotide in a range varying from 3 to 12 individuals. This automatically implies that only SNPs that have been established at a high frequency in the population had a high change to be detected. Many of the singleton polymorphic sites reported here will have been selected by chance and do not necessarily represent polymorphisms with high frequencies. On the other hand, the SNP map does already provide a considerable set of parsimony informative positions as well as non-synonymous substitutions that may be the subject of selection. With the help of this map hypervariable regions may be selected which can be searched more intensively for additional informative positions that can be used in determining population structures. As new technologies to score SNPs in a semi-automated way are being developed, it is the aim to implement a high throughput method for marker-assisted screening of potential selection in populations of C. oncophora during infection of the host.
Genetic variation within mitochondrial nad4 sequences from different trichostrongylids (Haemonchus placei, Haemonchus contortus, Teladorsagia circumcincta, Mazamastrongylus odocoilei) has proven to be extremely useful in determining the genetic population structure. The data derived from the mt sequences illustrated that host mobility has a large effect on the genetic structure of the different nematode species (Blouin et al. 1995). Comparing the partial nad4 sequences used for delineation of the population genetic structure with the corresponding sequence in C. oncophora revealed that of the 13 SNPs within C. oncophora 9 were found at the same position in T. circumcincta, 6 in M. odocoilei, 5 in H. contortus, and 4 in H. placei. Regarding this high similarity of several genes from C. oncophora with the mt genes of other nematodes and the occurrence of SNPs within these nematodes at the same position as compared to C. oncophora, the presented SNP map will be helpful in determining SNPs in the mt genomes of related nematodes.
Harm Ploeger is gratefully acknowledged for supporting this study and critically reading the manuscript. The authors wish to thank Professor Dr A. W. C. A. Cornelissen for his helpful suggestions. This research was supported by the Technology Foundation STW, applied science division of NWO and the technology programme of Ministry of Economic Affairs (UDG 4889).
References
REFERENCES
ANDERSON, S.,
BANKIER, A. T.,
BARRELL, B. G.,
DE BRUIJN, M. H.,
COULSON, A. R.,
DROUIN, J.,
EPERON, I. C.,
NIERLICH, D. P.,
ROE, B. A.,
SANGER, F.,
SCHREIER, P. H.,
SMITH, A. J.,
STADEN, R. &
YOUNG, I. G.
(1981).
Sequence and organization of the human mitochondrial genome.
Nature, London
290, 457–465.CrossRefGoogle Scholar
ANDERSON, T. J.,
KOMUNIECKI, R.,
KOMUNIECKI, P. R. &
JAENIKE, J.
(1995).
Are mitochondria inherited paternally in Ascaris?
International Journal for Parasitology
25, 1001–1004.Google Scholar
BLAXTER, M. L.,
DE LEY, P.,
GAREY, J. R.,
LIU, L. X.,
SCHELDEMAN, P.,
VIERSTRAETE, A.,
VANFLETEREN, J. R.,
MACKEY, L. Y.,
DORRIS, M.,
FRISSE, L. M.,
VIDA, J. T. &
THOMAS, W. K.
(1998).
A molecular evolutionary framework for the phylum Nematoda.
Nature, London
392, 71–75.CrossRefGoogle Scholar
BLOUIN, M. S.,
DAME, J. B.,
TARRANT, C. A. &
COURTNEY, C. H.
(1992).
Unusual population genetics of a parasitic nematode; mtDNA variation within and among populations.
Evolution
46, 470–476.CrossRefGoogle Scholar
BLOUIN, M. S.,
YOWELL, C. A.,
COURTNEY, C. H. &
DAME, J. B.
(1995).
Host movement and the genetic structure of populations of parasitic nematodes.
Genetics
141, 1007–1014.Google Scholar
BOORE, J. L.
(1999).
Animal mitochondrial genomes.
Nucleic Acids Research
27, 1767–1780.CrossRefGoogle Scholar
CLAYTON, D. A.
(1982).
Replication of animal mitochondrial DNA.
Cell
28, 693–705.CrossRefGoogle Scholar
CLAYTON, D. A.
(1991).
Replication and transcription of vertebrate mitochondrial DNA.
Annual Review of Cell Biology
7, 453–478.CrossRefGoogle Scholar
DAME, J. B.,
BLOUIN, M. S. &
COURTNEY, C. H.
(1993).
Genetic structure of populations of Ostertagia ostertagi.
Veterinary Parasitology
46, 55–62.CrossRefGoogle Scholar
DE VRIES, E.
(1998).
pUCPCR1. A vector for direct cloning of PCR products in a double Xcm1 restriction site offering compatible single 3′-overhanging T residues.
Molecular Biotechnology
10, 273–274.CrossRefGoogle Scholar
DENVER, D. R.,
MORRIS, K.,
LYNCH, M.,
VASSILIEVA, L. L. &
THOMAS, W. K.
(2000).
High direct estimate of the mutation rate in the mitochondrial genome of Caenorhabditis elegans.
Science
289, 2342–2344.CrossRefGoogle Scholar
GYLLENSTEN, U.,
WHARTON, D. &
WILSON, A. C.
(1985).
Maternal inheritance of mitochondrial DNA during backcrossing of two species of mice.
Journal of Heredity
76, 321–324.CrossRefGoogle Scholar
HU, M.,
CHILTON, N. B. &
GASSER, R. B.
(2002).
The mitochondrial genomes of the human hookworms, Ancylostoma duodenale and Necator americanus (Nematoda: Secernentea).
International Journal for Parasitology
32, 145–158.CrossRefGoogle Scholar
JUKES, T. H. &
OSAWA, S.
(1993).
Evolutionary changes in the genetic code.
Comparative Biochemistry and Physiology, B
106, 489–494.CrossRefGoogle Scholar
KEDDIE, E. M.,
HIGAZI, T. &
UNNASCH, T. R.
(1998).
The mitochondrial genome of Onchocerca volvulus: sequence, structure and phylogenetic analysis.
Molecular and Biochemical Parasitology
95, 111–127.CrossRefGoogle Scholar
LAVROV, D. V. &
BROWN, W. M.
(2001).
Trichinella spiralis mtDNA: a nematode mitochondrial genome that encodes a putative ATP8 and normally structured tRNAS and has a gene arrangement relatable to those of coelomate metazoans.
Genetics
157, 621–637.Google Scholar
MAFF (1986).
Manual of Veterinary Parasitological Laboratory Techniques. (
Technical Bulletin No. 18, HMSO, London.)
OJALA, D.,
MONTOYA, J. &
ATTARDI, G.
(1981).
tRNA punctuation model of RNA processing in human mitochondria.
Nature, London
290, 470–474.CrossRefGoogle Scholar
OKIMOTO, R.,
MACFARLANE, J. L.,
CLARY, D. O. &
WOLSTENHOLME, D. R.
(1992).
The mitochondrial genomes of two nematodes, Caenorhabditis elegans and Ascaris suum.
Genetics
130, 471–498.Google Scholar
PERRIERE, G. &
GOUY, M.
(1996).
WWW-query: an on-line retrieval system for biological sequence banks.
Biochimie
78, 364–369.CrossRefGoogle Scholar
ROOS, M. H.,
BOERSEMA, J. H.,
BORGSTEEDE, F. H. M.,
CORNELISSEN, J.,
TAYLOR, M. &
RUITENBERG, E. J.
(1990).
Molecular analysis of selection for benzimidazole resistance in the sheep parasite Haemonchus contortus.
Molecular and Biochemical Parasitology
43, 77–88.CrossRefGoogle Scholar
TARRANT, C. A.,
BLOUIN, M. S.,
YOWELL, C. A. &
DAME, J. B.
(1992).
Suitability of mitochondrial DNA for assaying interindividual genetic variation in small helminths.
Journal of Parasitology
78, 374–378.CrossRefGoogle Scholar
THOMPSON, J. D.,
GIBSON, T. J.,
PLEWNIAK, F.,
JEANMOUGIN, F. &
HIGGINS, D. G.
(1997).
The CLUSTAL_X windows interface: flexible strategies for multiple sequence alignment aided by quality analysis tools.
Nucleic Acids Research
25, 4876–4882.CrossRefGoogle Scholar
THOMPSON, J. D.,
HIGGINS, D. G. &
GIBSON, T. J.
(1994).
CLUSTAL W: improving the sensitivity of progressive multiple sequence alignment through sequence weighting, position-specific gap penalties and weight matrix choice.
Nucleic Acids Research
22, 4673–4680.CrossRefGoogle Scholar
WALLACE, D. C.
(1999).
Mitochondrial diseases in man and mouse.
Science
283, 1482–1488.CrossRefGoogle Scholar
WOLSTENHOLME, D. R.
(1992).
Animal mitochondrial DNA: structure and evolution.
International Review of Cytology
141, 173–216.CrossRefGoogle Scholar

Fig. 1. Schematic representation of the mitochondrial genome of Cooperia oncophora. Transcription of the genes is predicted to be all in the same direction (from left to right). AT represents the AT-rich non-coding region. The Long Non-coding (LNC) region is shaded, the length of the other 9 non-coding regions is given below. The trn genes are represented by their one letter amino acid code at the top.

Table 1. Sequence pair distances in percentage identity from the amino acid sequences of the 12 protein coding genes and the nucleotide sequences of the 2 rrn genes, AT-rich non-coding region and the complete mt genome
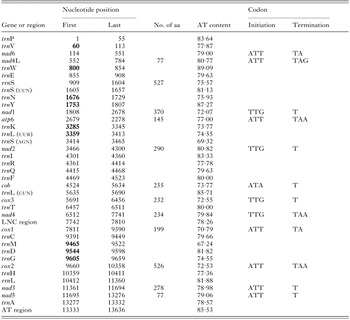
Table 2. Nucleotide position, AT content (%), for the genes and 2 non-coding regions (AT-rich and Long Non-coding (LNC) region between nad4 and cox1) of the Cooperia oncophora mt genome

Fig. 2. Neighbour-Joining (NJ) trees derived from mitochondrial data for 7 nematode species. (A) Data derived from the amino acid sequence of the 12 protein coding genes. (B) Data derived from the nucleotide sequences of the rrn genes. Bootstrap values are given at the branches.

Table 3. Frequencies (%) of amino acid (aa) codon usage in Cooperia oncophora mt genes

Fig. 3. Potential hairpin structure found within the long non-coding region between the cox1 and nad4 genes of Cooperia oncophora.
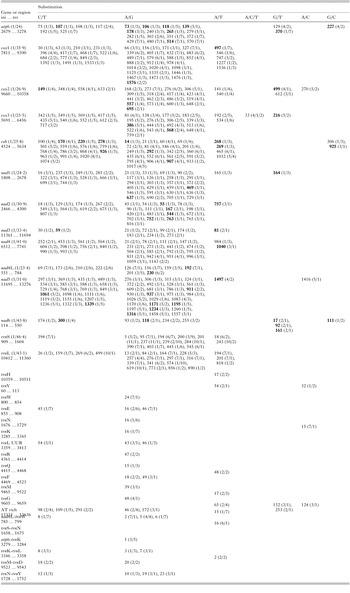
Table 4. Single nucleotide polymorphisms (426) identified and mapped in the mitochondrial genome of Cooperia oncophora
 You have
Access
- 24
- Cited by