INTRODUCTION
The wide variation of spatial and temporal thermal attributes among habitats can cause stress in plants, particularly when plants are moved into environments that are different from those in which they evolved (Nilsen and Orcutt, Reference Nilsen and Orcutt1996). As Wien (Reference Wien and Wien1997) pointed, for Capsicum species other than C. annuum, little is known on their optimum temperatures and suggests that for species like C. frutescens, C. chinense and C. baccatum the optimum temperature may probably be higher than for C. annuum (21–23 °C) since these are species selected from environments with a higher mean temperature.
In high temperature environments, plants show a reduction of CO2 assimilation rates due to a disproportionate increase in respiration rates (Nilsen and Orcutt, Reference Nilsen and Orcutt1996). Assimilation rates were not affected by high (35 °C day/25 °C night) or low temperatures (25 °C day/18 °C night) in C. annuum (Aloni et al., Reference Aloni, Pashkar and Karni1991). However, in 14C labeled plants, it was found that the total quantity of the isotope was affected, obtaining smaller amounts in plants exposed to high temperatures, which might indicate an increase in respiratory rates (Aloni et al., Reference Aloni, Pashkar and Karni1991). On the other hand, Bhatt and Srivinasa Rao (Reference Bhatt and Srivinasa Rao1993) reported reductions of 10 to 30% in CO2 assimilation rates in C. annuum cultivated at 27/17 °C (day/night) compared with plants cultivated at 27/22 °C.
With regard to the effects of temperature on flowering and fruit production, abnormally large and deformed ovaries have been reported in flowers of C. annuum cultivated at 8 °C (Rylski, Reference Rylski1973). Prior to 1990 there were reports of flower abscission in the genus Capsicum due to high temperature, excess water and shade, but the mechanisms by which these unfavorable conditions caused flower abscission and small fruits were not understood (Wien et al., Reference Wien, Tripp, Hernandez, Turner and Green1989). In uncontrolled greenhouse conditions, flower and fruit production varies significantly between cultivars exposed to high temperatures (38/16 °C). Under these conditions, a high percentage of aborted flowers and a progressive reduction in fruit weight and seed production were reported. However, seed size and germination percentage were not affected (Kham and Passam, Reference Kham and Passam1992). Aloni et al. (Reference Aloni, Karni, Zaidman, Riov, Huberman and Goren1994) concluded that the relationship between the percentage of flower loss and increase in temperature varies for different cultivars of C. annuum because it is regulated by ethylene production in each cultivar. Furthermore, Huberman et al. (Reference Huberman, Riov, Aloni and Goren1997) suggest that at high temperature, low levels of auxin and reduced capacity for transporting this hormone to reproductive organs are responsible for flower and fruit abscission. Other studies have suggested that high temperatures reduced pollen viability in C. annuum (Aloni et al., Reference Aloni, Peet, Pharr and Karni2001; Erickson and Markhart, Reference Erickson and Markhart2002), due to a reduction in the metabolic processes of sugar breakdown (Aloni et al., Reference Aloni, Peet, Pharr and Karni2001). There has been little work done to evaluate CO2 assimilation rates under different climatic conditions and its relationship to growth and flower and fruit production dynamics under different field conditions for this genus. It has been suggested that natural environmental variation should be evaluated since there is evidence that acclimation includes complex responses related to dynamic aspects of the environment (Walters, Reference Walters2005). The lack of information relating yield and biomass production under different temperature regimes may be limiting the understanding of processes that influence yield.
C. chinense had been the most commonly cultivated species of the genus Capsicum in the Amazon basin and the Northeast of South America (Pickersgill, Reference Pickersgill1971). Bosland and Votava (Reference Bosland and Votava2000) describe similar results for other tropical regions and the Caribbean. In this thirty-year period it would appear that C. chinense has spread over the entire Amazon basin and the Caribbean. Seeds of different cultivars of C. chinense are frequently exchanged between different regions. This is a common practice in Venezuela; therefore, the question arises: Does the capacity for acclimation within a variety of C. chinense make its cultivation possible in places under different temperature conditions? The purposes of this research were: (1) to evaluate leaf gas exchange responses along a thermal gradient determined by altitudinal differences (2) elucidate how changes in mean temperature control differences in assimilate allocation between plant organs and dynamics of fruit and flower production and how it affects yield dynamics in sweet pepper.
MATERIALS AND METHODS
Characteristics of the research sites
The study was performed at three sites in the state of Mérida, Venezuela (8° 20′ N – 71° W) along a gradient of altitude from 140–1855 m
-
Tabay: Santos Marquina County, 1855 m with a mean annual temperature of 19 °C, and mean maximum and minimum temperatures of 26 and 14 °C, respectively.
-
San Juan de Lagunillas: Sucre County, 1100 m with a mean annual temperature of 24 °C, and mean maximum and minimum temperatures of 28 and 19 °C, respectively.
-
El Vigía: Alberto Adriani county, 140 m with a mean annual temperature of 28 °C, with mean maximum and minimum temperatures of 32 and 24 °C (Data from El Vigia Airport, Venezuelan Air Force).
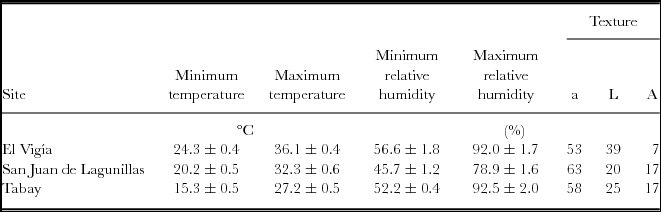
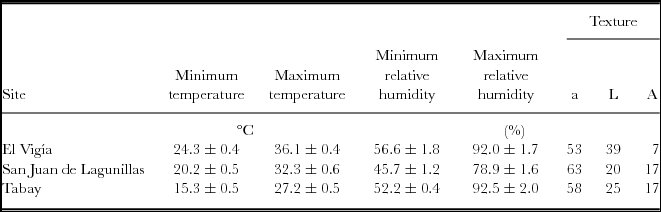
Mean temperatures during the experiments were 20.8, 26.4 and 30.3 °C for Tabay, San Juan de Lagunillas and El Vigia, respectively. Edapho-microclimatic measurements are summarized on Table 1. San Juan de Lagunillas had the lowest mean relative humidity (45.7%). Highest mean relative air humidity was found in El Vigía and Tabay (92%). Soils in the three test sites corresponded to sandy loams.
Mean maximum and minimum temperature and relative humidity during the experimental period. Percentages of sand (a) silt (L) and clay (A) for the top 20 cm of soils in El Vigia, (140 m), San Juan de Lagunillas (1100 m) and Tabay (1855 m). Means ± standard error.
Cultivar and experimental conditions
The variety used is known as Pepón, which is used extensively in Venezuela. Seeds were planted in previously disinfected beds. Approximately 100 seedlings were transplanted to the field between 45 and 50 days after planting. Planting distance was 1 × 1 m with 10 plants per row. Fertilizer was applied approximately 25 days after transplanting (dat) at a rate of 40 kg ha−1 of N in the form of diamonic phosphate. At 60, 100 and 130 dat the equivalent of 16, 12, 26 and 1 kg ha−1 of N, P, K and Mg of a commercial formula of 12–11–18–3 plus microelements was applied. Plants were irrigated if necessary in order to maintain favorable soil water conditions.
Leaf gas exchange measurements
Gas exchange measurements (CO2 assimilation (A), transpiration (E) and leaf conductance (gs) were done at approximately 60–70, 110–120 and 140–150 dat. Four plants from the central row were selected at each site. Measurements were made on completely developed leaves from the upper section of each plant to avoid problems arising from shade and reduction in gas exchange rates due to leaf age. Measurements were made every two hours using a portable photosynthesis measurement system in an open mode (LCA-4, ADC, Hoddesdon, England). Photosynthetic photon flux density (PPFD) was measured with a quantum sensor incorporated in the leaf chamber. Leaf and air temperatures were measured with chromel–alumel thermocouples (36 gauge) and relative humidity with a digital hygrometer (Extech Instruments, model 407445). These microclimatic variables were used to determine leaf-air water vapor pressure deficit (VPD). Total daily assimilation (A tot) was obtained by integrating daily CO2 assimilation curves. Leaf respiration rates were measured during nighttime hours beginning two and a half hours after nightfall.
Growth, flower and fruit production dynamics
Plants were harvested on 50, 73, 96, 114, 196 dat in the three locations. Three adjacent plants were selected at each harvest following the IBNAT methodology (IBSNAT, 1990). Dry weight per plant of all components (leaf, stem and root) was obtained after drying at 70 °C. Total dry weight and relative growth rate (RGR) were estimated according to Hunt (Reference Hunt1978). The accumulative dry fruit weight was estimated for each harvest from the dry fruit/fresh weight per plant relationship obtained for the cultivar Pepón.
Twenty plants were selected at each site and a weekly record was kept on the number of open flowers, fruits and fruit weight, similar to the procedure followed by Jaimez and Rada (Reference Jaimez and Rada2006). Differences in these parameters were analysed with ANOVA; Tukey's procedure was used to compare the effects of temperature. The level of statistical significance was set at p < 0.05.
RESULTS
Microclimate and gas exchange
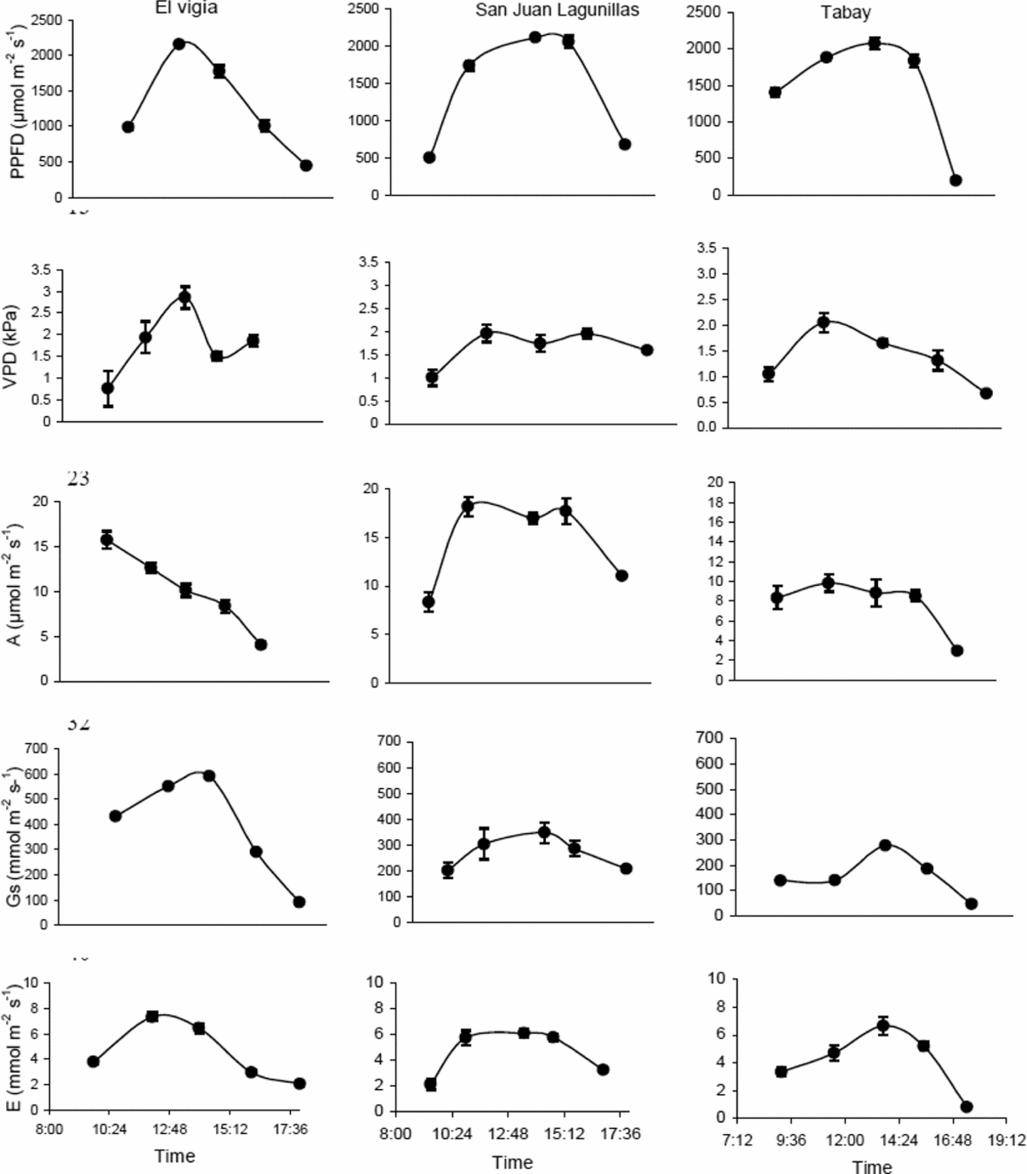
The highest VPD in El Vigía was 2.85 kPa, with a minimum of about 0.75 kPa in early morning hours, with PPFD below 1000 μmol m−2 s−1, and 1.87 and 1.92 kPa in the late afternoon (between 17.00 and 18.00). The daily pattern for both gs and E followed variations in PPFD (Figure 1). Maximum values for E were between 6 and 7 mmol m−2 s−1. Maximum A occurred in the morning (12–15.5 μmol m−2 s−1) and did not coincide with the maximum PPFD values. Lowest VPD occurred in the morning in San Juan de Lagunillas. Maximum VPD was 2.4 kPa when PPFD was close to 2000 μmol m−2 s−1. Leaf conductance and E patterns were similar to those of El Vigía and followed variations in PPFD. Highest E varied between 4.5 and 6.0 mmol m−2 s−1. Means for A varied between 17 and 18 μmol m−2 s−1 and coincided with highest PPFD (Figure 1). Lowest VPD (below 2 kPa), were found in Tabay, the site with the lowest mean temperature, with minimum values between 0.5 and 0.75 kPa in the morning and late afternoon. Mean maximum A were also the lowest of the three sites not exceeding 11 μmol m−2 s−1, coinciding with maximum values for PPFD and gs. E followed a similar pattern to variations in gs, with the greatest values varying between 3 and 6 mmol m−2 s−1 (Figure 1).
Daily photosynthetic photon flux density (PPFD), leaf-air vapor pressure difference (VPD), leaf conductance (gs), CO2 assimilation (A) and transpiration (E) rates for C. chinense in three sites with different day/night mean temperatures: El Vigia (35/24), San Juan de Lagunillas (32/20) and Tabay (26/15). Means of 12 measurements for each point ± standard error. Measurements taken 65 dat.
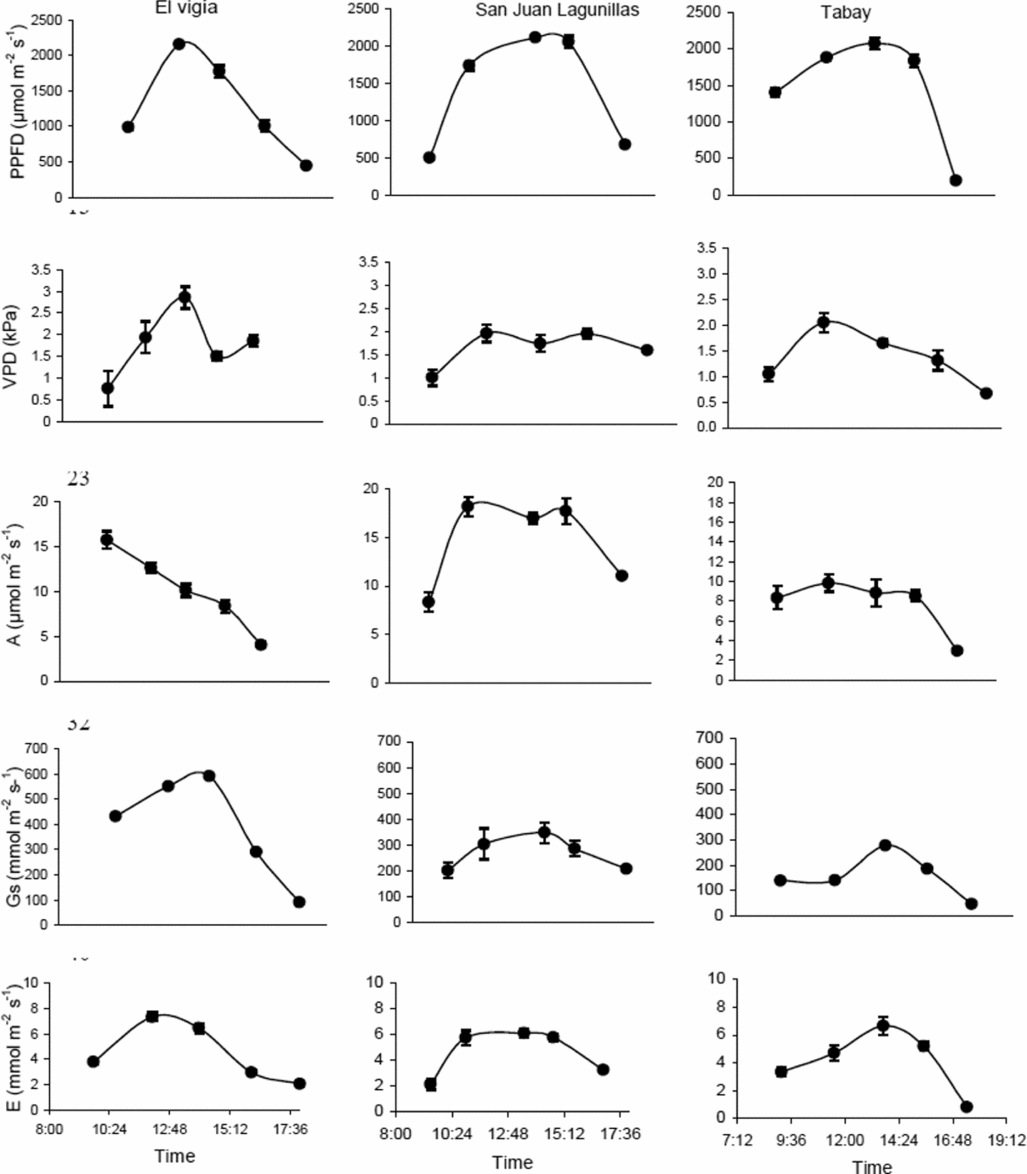
Highest mean daily CO2 assimilation rate was found for plants in San Juan de Lagunillas compared to El Vigía and Tabay, which showed 18 and 42% lower rates, respectively. This trend was also observed in A tot, although the percentage decrease in plants from El Vigía and Tabay were only 11 and 20% lower than San Juan de Lagunillas (Table 2). During the day, the plants in El Vigía had the highest mean gs (271.5 mmol m−2 s−1), while those in Tabay had the lowest (Table 2).
Mean CO2 assimilation (A), leaf conductance (gs), maximum CO2 assimilation (Amax), total daily CO2 assimilation (Atot,), total night leaf respiration (NLRtot) and the ratio CO2 assimilation/night leaf respiration (Atotal/NLR) for C. chinense chinense in El Vigia, (140 m), San Juan de Lagunillas (1100 m) and Tabay (1855 m). Means ± standard error.
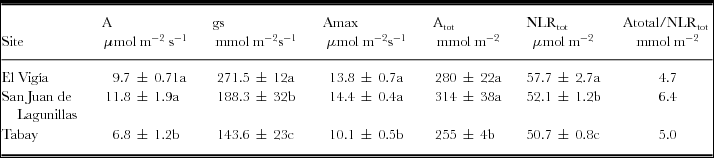
Means followed by different letters in the same column are significantly different (p < 0.05) by Tukey's Test.
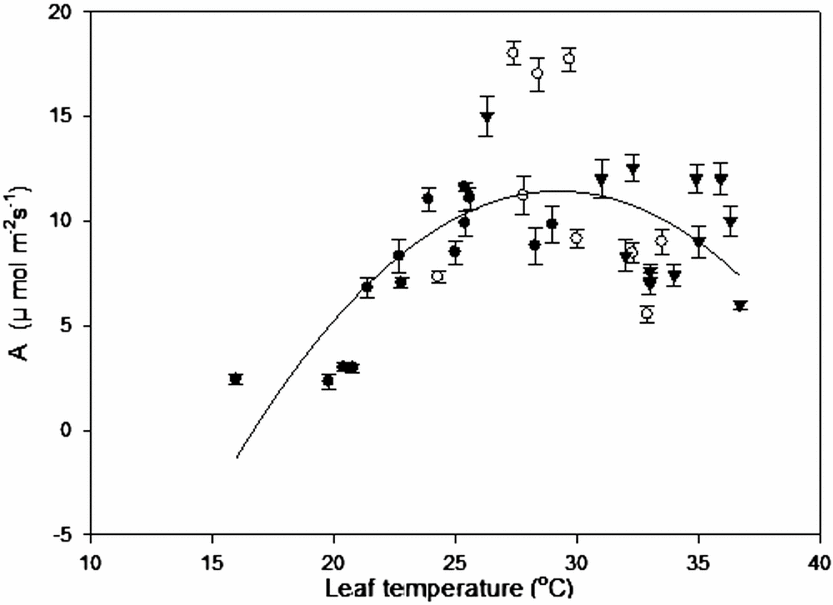
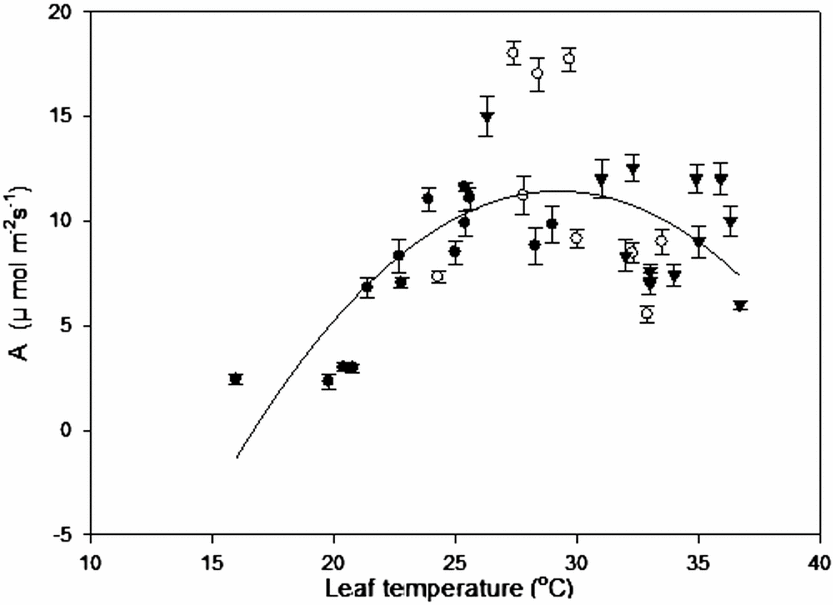
Leaf temperature-CO2 assimilation relation with field data from all sites, where microclimatic parameters simultaneously interact and possibly influence the rate of A, give us an idea of this species’ behaviour (Figure 2). Leaf temperatures above 36 °C reduced A by approximately 50% with respect to the highest rates. Furthermore, temperatures below 18 °C with low radiation produced assimilation rates lower than 4 μmol m−2 s−1. Optimum temperature estimated from these measurements was 29.3 °C.
Leaf temperature-CO2 assimilation curve for C. chinense. The temperature range was established for plants grown at different altitudes: ● (Tabay, 1855 m), ○ (San Juan de Lagunillas, 1100 m) and ▼ (El Vigia, 140 m) under field conditions.
Night respiration
Plants exposed to higher mean temperatures tended to have a slightly higher total night respiration rate (NLRtot) (57.7 mmol m−2 s−1) compared to the other two sites. The lowest Atot/NLRtot ratio (4.7) was found for El Vigia, while the highest was obtained for San Juan de Lagunillas (6.4) (Table 2).
Growth, flowering and fruit production dynamics
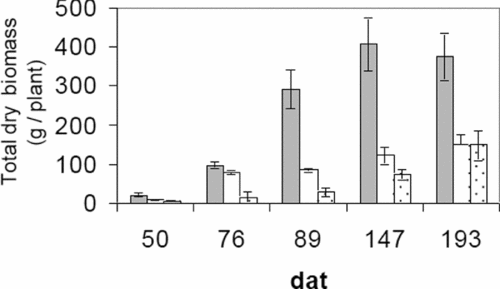
Plants cultivated in El Vigía showed a higher accumulation of total dry biomass (400 g/plant) with regard to the other two locations (approximately 100 g/plant) from 89 dat on. The smallest growth was experienced by plants cultivated in Tabay with the exception of 193 dat which were similar to San Juan (Figure 3).
Total dry biomass (fruits included) of C. chinense grown at 140 m (■), 1100 m (□) and 1855 m (░). Vertical bars indicate a standard error from the mean.
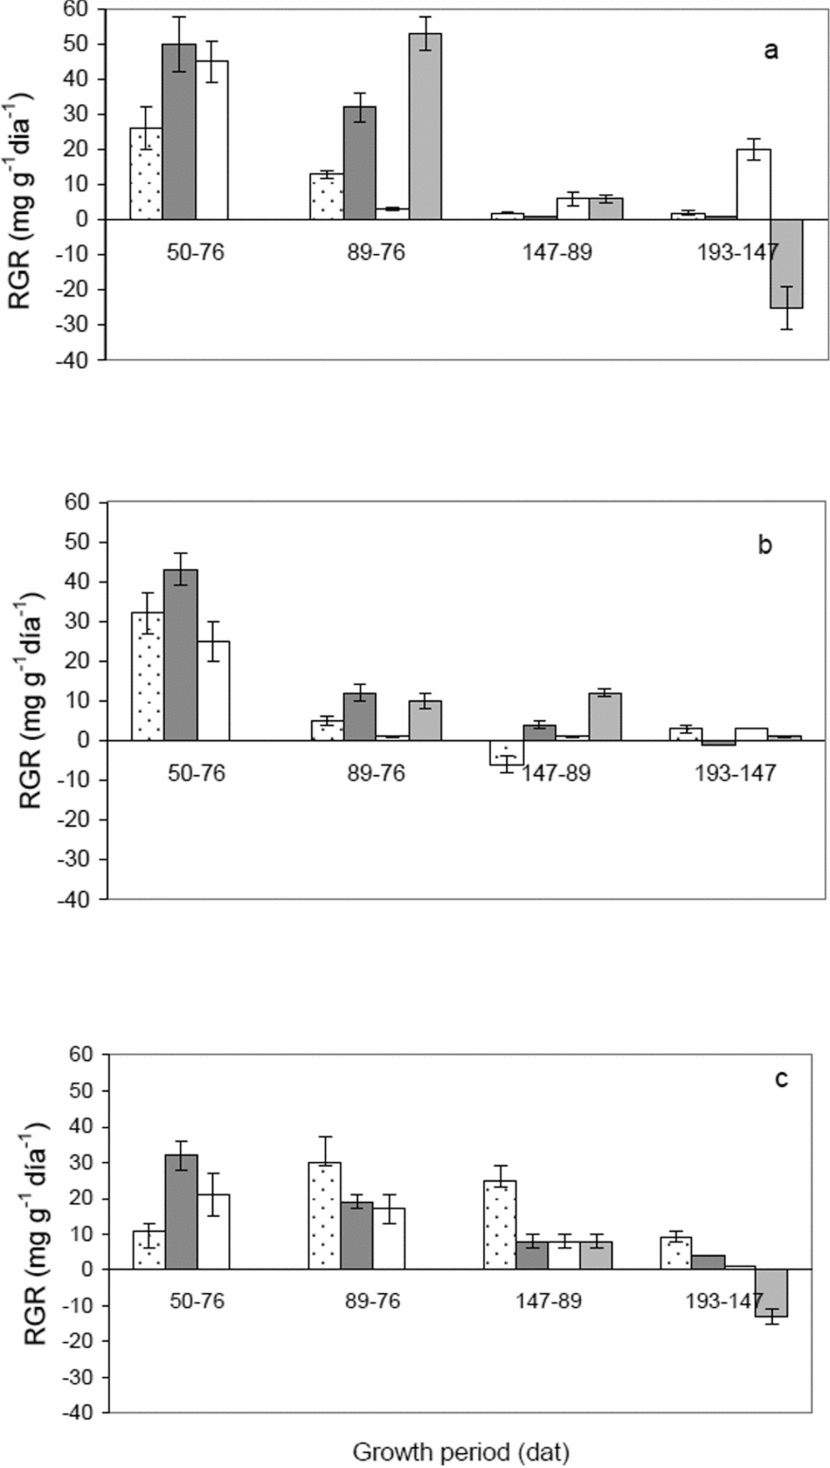
The RGR of leaves, stems and roots for plants in El Vigía were higher during the 50–76 dat stage and then constantly decreased until the end of the study (Figure 4a). In general, San Juan de Lagunillas showed a similar decreasing trend in RGR from the first stages until the end (Figure 4b). In Tabay, stems and roots presented the largest RGR 50–76 dat, and then decreased progressively as the crop cycle advanced. Different from the other two sites, leaves reached the highest RGR at 147 dat, before declining to practically null rates (Figure 4c). In relation to the fruit production phase, the 76–89 dat period showed the largest RGR for plants in El Vigia, much higher compared to the other stages within this location or compared to the other sites. For plants in San Juan, the 76–89 and 89–147 dat periods were similar with regard to fruit RGR (approximately 10 mg g −1 d−1), indicating longer periods of constant allocation of assimilates to fruit production. Distribution of assimilates to fruits observed from their RGR was lowest in Tabay, below 10 mg g−1 d−1.
Relative growth rate of leaves (░)), stem+branches (■), roots (□) and fruits (■) of C. chinense grown at 140 m (a), 1100 m (b) and 1855 m (c). Vertical bars indicate a standard error from the mean.

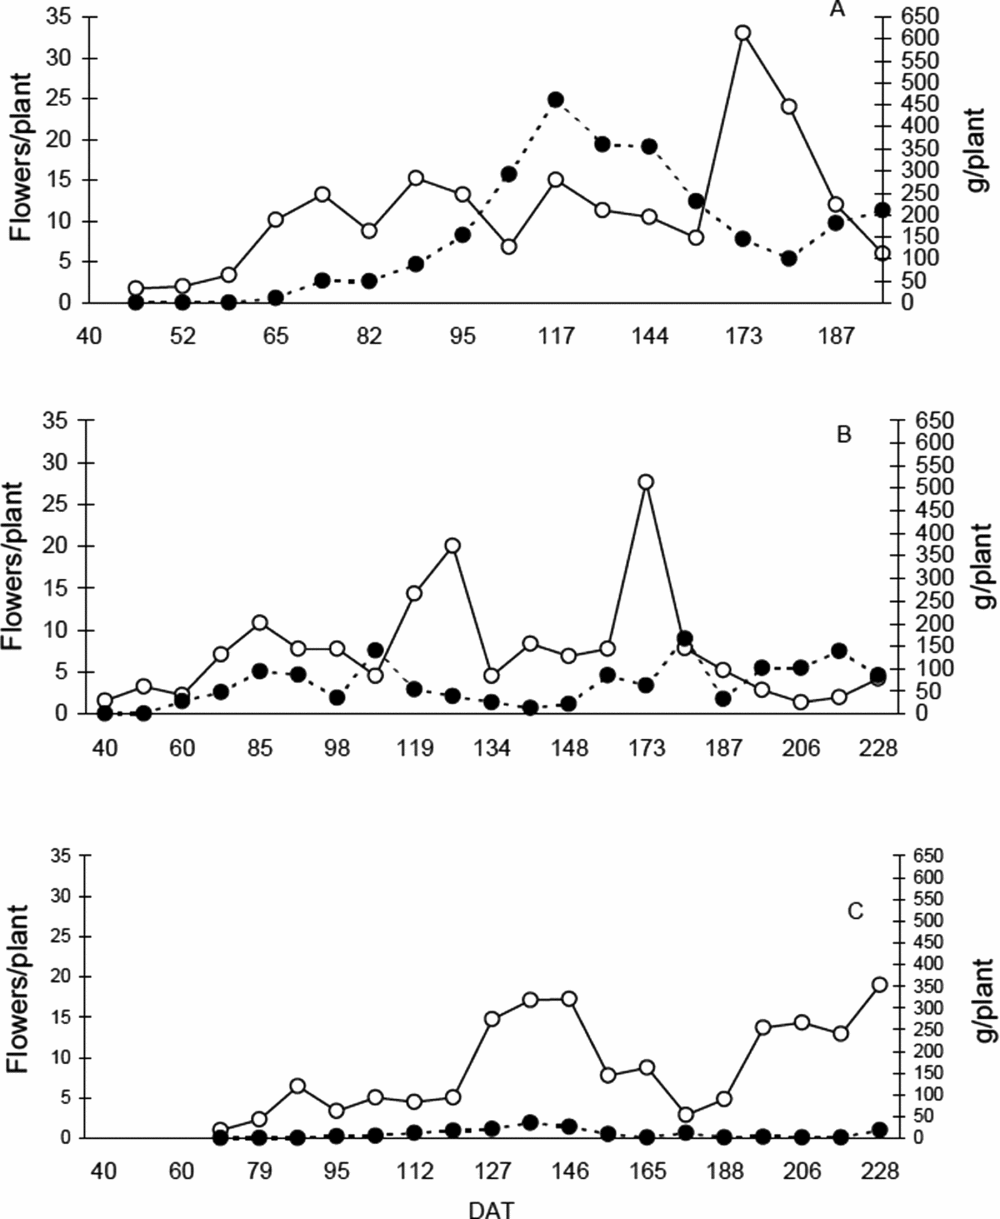
There were differences in flowering initiation and fruit production between the three sites. Both processes started later in Tabay in relation to the other sites (72 and 95 dat) compared to San Juan (40 and 60 dat) and El Vigía (46 and 65 dat) (Figure 5). Fifty percent of flowering occurred 81, 40 and 48 dat in Tabay, San Juan de Lagunillas and El Vigía, respectively. Fifty percent of plants had harvestable fruits in Tabay, San Juan de Lagunillas and El Vigía at 116, 71 and 72 dat, respectively.
Flower (○) and fruit production (●) dynamics for C. chinense in (A) El Vigia, 140 m (B) San Juan de Lagunillas, 1100 m and (C) Tabay, 1855 m. Each point represents a mean of 20 plants.

Initial maximum flowering occurred between 136 and 146 dat in Tabay, and the second maximum at 228 dat. On both occasions, there were about 18 flowers per plant. For the other sites, initial maximum flower production was lower than subsequent ones. Maximum flowering was very short in San Juan de Lagunillas, occurring 126 and 173 dat with 20 and 27 flowers per plant. Maximum flowering was not well defined in El Vigía and there was a longer period of continuous production with 13–15 flowers per plant from 74–95 dat. A second maximum occurred at 173 dat with 33 flowers per plant (Figure 5).
Fruit production never exceeded 38 g per plant in Tabay. Highest production was recorded at 136 dat. Production peaks were reached at 112 and 180 dat, with 136 and 166 g per plant, respectively in San Juan de Lagunillas. Alternating cycles of high and low production in El Vigia were not as evident as in San Juan de Lagunillas, with a peak production at 117 dat with 460 g per plant. In the two latter sites, there was a period between 63 and 68 days between peaks.
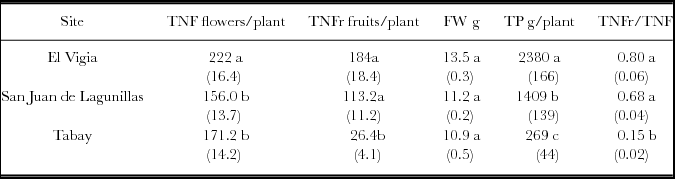
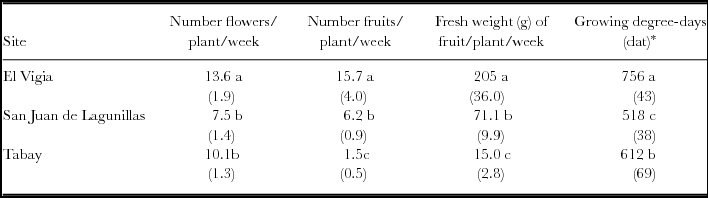
The total number of flowers (TNF) in the three sites was different. The higher number was obtained in El Vigia. The most obvious differences were in the total number of fruits (TNFr), with very low production in Tabay evidenced by the low TNFr/TNF ratio: only 15% of the flowers developed into harvestable fruit. Values of 68 and 80% were found for San Juan de Lagunillas and El Vigía, respectively (Table 3). Fruit weight increased proportionally with increasing mean temperature, and total production rose accordingly. Total yield in El Vigía was 41 and 89% higher than in San Juan de Lagunillas and Tabay, respectively. Average weekly number of fruit and fresh weight harvested increased with increasing mean temperature. However, a higher significant average number of flowers was obtained weekly in El Vigia (average 28 °C) (Table 4). Higher quantity of accumulated degree-days where 50% of the plants had flowers were also obtained in El Vigia (Table 4).
Total number of flowers per plant (TNF), and fruits (TNFr), individual fruit weight (FW), total production per plant (TP) for C. chinense in El Vigia, (140 m), San Juan de Lagunillas (1100 m) and Tabay (1855 m). Values between parentheses correspond to standard error from the mean.
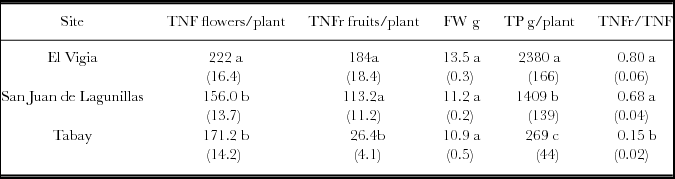
Means followed by different letters in the same column are significantly different (p < 0.05) by Tukey's Test.
Average flower and fruit number, fresh weight of harvested fruit and accumulated growing degree-days at 50% of plant with flowers for C. chinense in El Vigia, (140 m), San Juan de Lagunillas (1100 m) and Tabay (1855 m). Values between parentheses correspond to standard error of the mean.
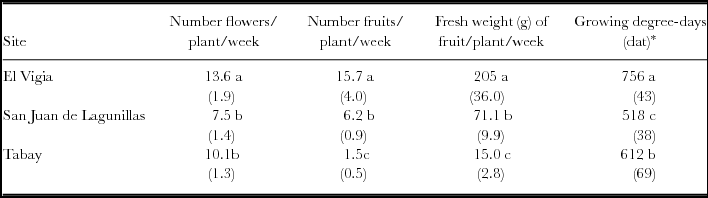
Means followed by different letters in the same column are significantly different (p < 0.05) by Tukey's Test. *Values between parentheses in last column correspond to days after transplant.
DISCUSSION
Microclimatic variations along thermal gradient and leaf gas exchange
CO2 assimilation dynamics in C. chinense changes with altitude in tropical environments. A in C. chinense decreases as mean temperature drops. Significantly lower A values were found at 1855 m which resulted in lower A tot. It would seem that higher A rates are obtained with leaf temperatures that do not exceed 31 °C. Maximum rates at 140 m occur in early morning hours, while in regions between 1100 and 1855 m A rates remain constant during the day. Such response may be related to leaf temperature. At lower altitudes, higher leaf temperatures (above 35 °C) are reached more quickly and should negatively influence the photosynthetic process. The cultivar Pepón has a wide optimum range, from approximately 27–31 °C under field conditions, outside of this range reductions in A rates occur. It is likely that many cultivars of C. chinense used in Venezuelan agriculture have similar characteristics, since they are generally grown at altitudes below 1300 m. The cultivar Pepón does not seem to have the capacity for acclimation and it is thus a mistake to introduce seeds into areas where the mean temperature varies between 15–19 °C resulting in a reduction in 50% of the assimilation rate from the optimum temperature for CO2 assimilation. Aloni et al. (Reference Aloni, Pashkar and Karni1991) found no difference in CO2 assimilation rates in C. annuum exposed to different mean temperatures. Increased night leaf respiration with higher temperatures has been reported for various species (Nilsen and Orcutt, Reference Nilsen and Orcutt1996). Our results support this statement, higher night temperatures at 140 m suggest that investment of CO2 assimilates for maintenance is greater. This does not necessarily mean that, although the relationship A tot/NLR decreases at higher temperatures, average fruit production is reduced as will be presented ahead.
Assimilate allocation, flowering and fruit production
Total dry biomass shows that the140 m site is undoubtedly the best agro-ecological region for the cultivar Pepón and maybe for other cultivars of Capsicum chinense. Wardlaw (Reference Wardlaw1990) has reported that low temperatures affect and produce changes in the distribution of assimilates among the different organs and described a high accumulation of soluble sugars and starch. Lower growth rates associated to low temperatures have also been reported for C. annuum cultivated at night temperatures between 14 and 17 °C in relation to those cultivated between 21°–25 °C (Bhatt and Srivinasa, Reference Bhatt and Srivinasa Rao1993; Mercado et al., Reference Mercado, Reid, Valpuesta and Quesada1997; Nilwik, Reference Nilwik1981). Our results show the adverse effect of low temperatures on the growth of C. chinense. During the first 147 days in tropical highland areas (1855 m) C. chinense maintained lower growth. At 193 dat is where overall growth is similar to plants growing at 1100 m. However, fruit production remained extremely low and was not a strong sink.
An increase in RGR is a good indication of a greater transport of carbohydrates toward a certain organ. The RGR of fruits is much higher in plants cultivated at 140 m in comparison to the other sites. RGR of stems are higher for the three sites during the first 76 dat. This is an indication of a very competitive sink strength with regard to leaves and roots, and probably a storage of carbohydrates for the growth of fruits that later become the biggest competitive organ for photoassimilates. However, under lower temperatures (1855 m), after 76 dat, the RGR pattern differs, fundamentally due to the great quantity of flowers and very small fruits, which were aborted. Plants at this altitude have a larger quantity of assimilates allocated to leaf growth until 193 dat. This pattern, only observed at 1855 m, evidences the adverse effect of low temperatures causing premature fall of small fruits and determining the change in the allocation patterns of assimilates towards leaves.
Temperature influences the patterns of assimilate allocation and it is substantially modified when fruits are aborted. The fact that the existing competition for available carbohydrates where fruits are an important drain in the genus Capsicum (Aloni et al., Reference Aloni, Pashkar and Karni1991; Wubs et al., Reference Wubs, Ma, Hemerik and Heuvelink2009), changes the distribution of assimilates and, in this case, leaves become the sink of greater importance. The change in distribution of assimilates under low temperature may probably be associated to a greater concentration of nonstructural carbohydrates and soluble proteins, as has been reported for C. annuum (Mercado et al., Reference Mercado, Reid, Valpuesta and Quesada1997). The contrary happens when plants are grown at higher temperatures (23–28 °C) where a greater demand, determined by a larger quantity of fruits, influence in a smaller quantity of proteins and non-soluble carbohydrates allocated to leaves. Pollock et al. (Reference Pollock, Lioyd, Stoddart and Thomas1983) have reported similar results in Lolium temulentum and Spinacia oleacea (Martindale and Leegood, Reference Martindale and Leegood1997).
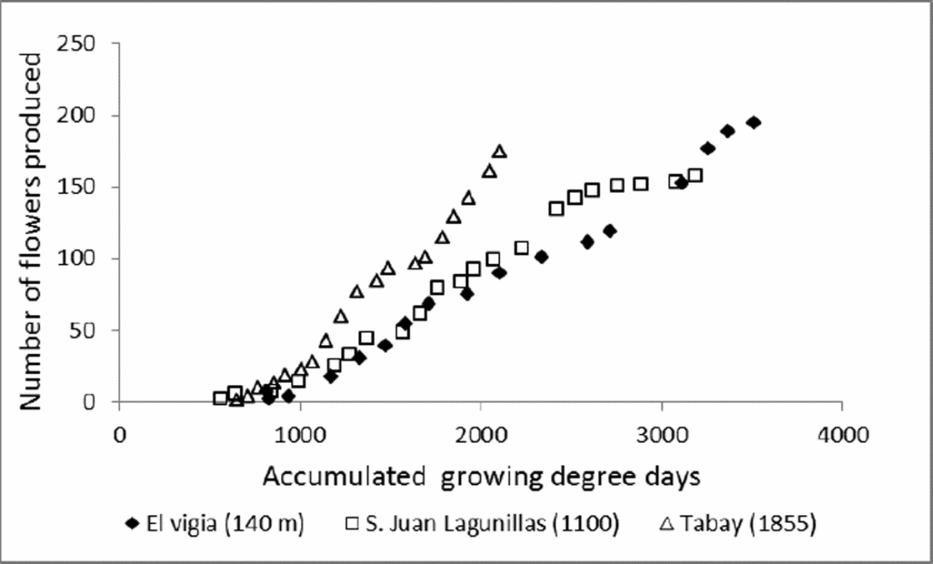
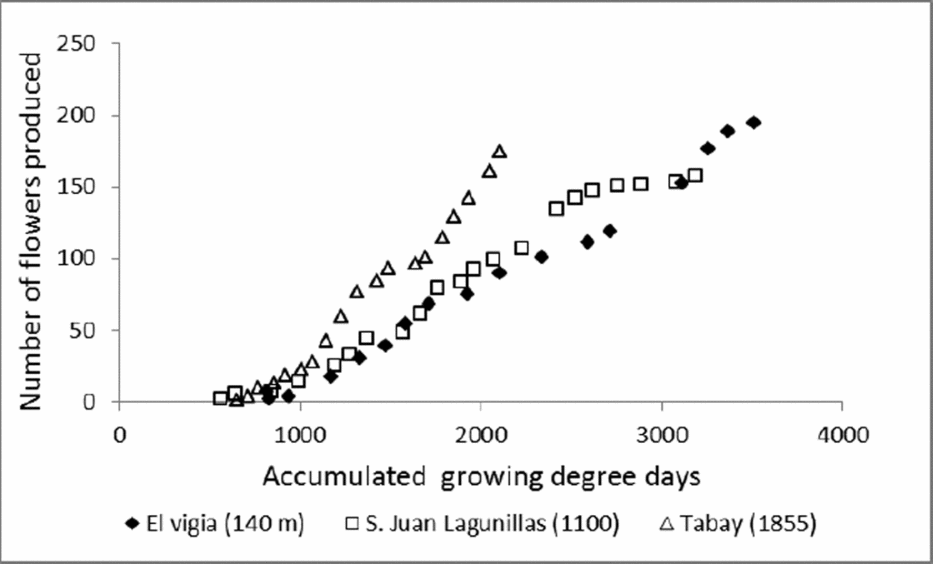
Climatic conditions of the test sites also influenced flowering dynamics. The period between maximum flowerings was longer with mean temperatures around 20 °C. This may be due to lower growth rates associated with lower mean A rates. The maximum flowering period was also longer, which might imply a stage in which a greater quantity of assimilates were allocated to flower production. However, the number of flowers produced weekly and the TNF was similar to plants grown at altitudes of 1100 m (average temperatures of 24 °C). A greater number of flowers with less amounts of accumulated degree-days were produced in plants grown at 1855 m (Figure 6), which results in a high reproductive investment lost by the abortion of small fruits.
Accumulated growing degree-days in relation with number of flowers produced in C. chinense grown at different altitudes: El Vigia (140 m), San Juan de Lagunillas (1100 m) and Tabay (1855 m).
Maximum flowering occurred over periods of a week in both San Juan de Lagunillas and El Vigia, which might indicate that environmental gradients involve differences in reproductive time and differences in allocation of resources (Boggs, Reference Boggs, Bazzaz and Grace1997). In our study, this could mean greater resources for seed growth and/or resource allocation that would make it possible to withstand environmental stress.
It would seem that flowering and fruit production patterns in C. chinense is regulated, on one hand by prevailing climatic conditions and on the other by characteristics of the cultivars. For example, Jaimez et al. (Reference Jaimez, Vielma, Rada and Garcia-Nuñez2000) found that the period between maximum flowering for other cultivars of C. chinense in San Juan de Lagunillas were 9 to 10 weeks, while for the cultivar pepón it occurred roughly every five weeks. Pepón also differed in the moment it achieved maximum flowering.
An increase in temperature (between 27–31 °C) leads to an increase in the number of flowers; below this temperature, it remains unchanged. However, fruit production does not remain the same. In places with mean temperatures of 19 °C, production is drastically reduced due to a great number of aborted flowers and small fruits. It has been shown in our results that high temperatures (34–36 °C) do not critically influence flower or small fruit loss. High temperatures cause greater flower abscission in C. annum, but this is related to biochemical changes rather than to effects influencing pollination and fertilization (Usman et al., Reference Usman, Mamat, Mohd, Aishad and Anuar1999). The differences in cultivars with regard to abscission are related to ethylene production by the cultivars (Aloni et al., Reference Aloni, Karni, Zaidman, Riov, Huberman and Goren1994). We might argue, as Wien does (Reference Wien and Wien1997), that C. chinense cultivars are better acclimated to higher temperatures because of their place of origin. However, it is possible that the processes of domestication resulting from the cultivars planted in different climatic zones has changed assimilate allocation and patterns of flowering and fruit production.
Climatic conditions at 1855 m produced a loss of approximately 85% of flowers and small fruits. There are various possible explanations. In the first place, the cultivar pepón, presumably originating in regions below 500 m in eastern Venezuela, has not adapted to low temperatures. This would presuppose that cultivars of C. chinense have found optimum niches of adaptation during the years of domestication at lower altitudes. That is to say that the movement of cultivars has been a process involving gradual adaptation to new environments, and that, over time, the plants have developed adaptation mechanisms. Mercado et al. (Reference Mercado, Reid, Valpuesta and Quesada1997) found that plants of C. annuum cultivated with night temperatures that ranged from 10–15 °C showed a greater tolerance for night temperatures of 4 °C (with visible signs of damage) than plants cultivated under 20 °C night temperatures. Therefore, C. annuum shows a certain acclimation to low temperatures, although the authors give no data for growth or production. Other facts that help explain abortions are that low temperatures produce parthenocarpic fruits due to negative effects on pollination and fertilization. These fruits fall easily in early growth stages (Rylski, Reference Rylski1973; Rylski and Spigelman, Reference Rylski and Spigelman1986). A greater number of flowers per node (3) were obtained in the field, whereas usually both San Juan de Lagunillas and El Vigía plants showed two flowers per node, which is normal for C. chinense. This may be an adaptation strategy, similar to that reported for species that tend to allocate a greater quantity of assimilates to reproduction, in this case flowers, but which exceed the possibilities of the plant to ensure fertilization and maturity of fruit, due to environmental limitations – in this case, temperature. This strategy might represent a short-term physiological loss, but it could be an evolutionary gain in the long term (Bazzaz, Reference Bazzaz, Bazzaz and Grace1997). It would seem that temperatures below 20 °C affect fruit production in C. chinense and its cultivation is not advised where night temperatures drop below 15 °C.
Acknowledgements
The authors would like to thank Mr. Américo Ocando and Mr. Ramón Diaz, the owners of the land where the experiments took place, for their logistic support. We are grateful to the personnel of the Experimental Station in San Juan de Lagunillas (IIAP) for their assistance. This research was financed by CDCHTA of Universidad de Los Andes, Mérida, Venezuela (Project FO-685-08-01B).