



Introduction
Marine biogeographical regions within the Southern Ocean often reflect the complex geologic and evolutionary history of the Antarctic continent (Beu et al. Reference Beu, Griffin and Maxwell1997, Brandt Reference Brandt2005, Clarke & Crame Reference Clarke and Crame2010, Kaiser et al. Reference Kaiser, Brandão, Brix, Barnes, Bowden, Ingels, Leese, Schiaparelli, Arango, Badhe, Bax, Blazewicz-Paszkowycz, Brandt, Brenke, Catarino, David, De Ridder, Dubois, Ellingsen, Glover, Griffiths, Gutt, Halanych, Havermans, Held, Janussen, Lörz, Pearce, Pierrat, Riehl, Rose, Sands, Soler-Membrives, Schüller, Strugnell, Vanreusel, Veit-Köhler, Wilson and Yasuhara2013). Biotic and abiotic characteristics to define many of these areas remain largely unclear as a result of patchy sampling and poor taxonomic resolution, particularly among deep sea faunas (Griffiths Reference Griffiths2010, De Broyer et al. Reference De Broyer, Danis and Allcock2011). Recently, more frequent sampling opportunities with the goal of examining these communities before broad-scale impacts by climate forcings (Barnes et al. Reference Barnes, Griffiths and Kaiser2009) has led to a greater understanding of biodiversity at regional hotspots (Downey et al. Reference Downey, Griffiths, Linse and Janussen2012, Grange & Smith Reference Grange and Smith2013). Further evaluation of species distribution patterns within poorly sampled areas of the Southern Ocean is necessary to fill in these knowledge gaps.
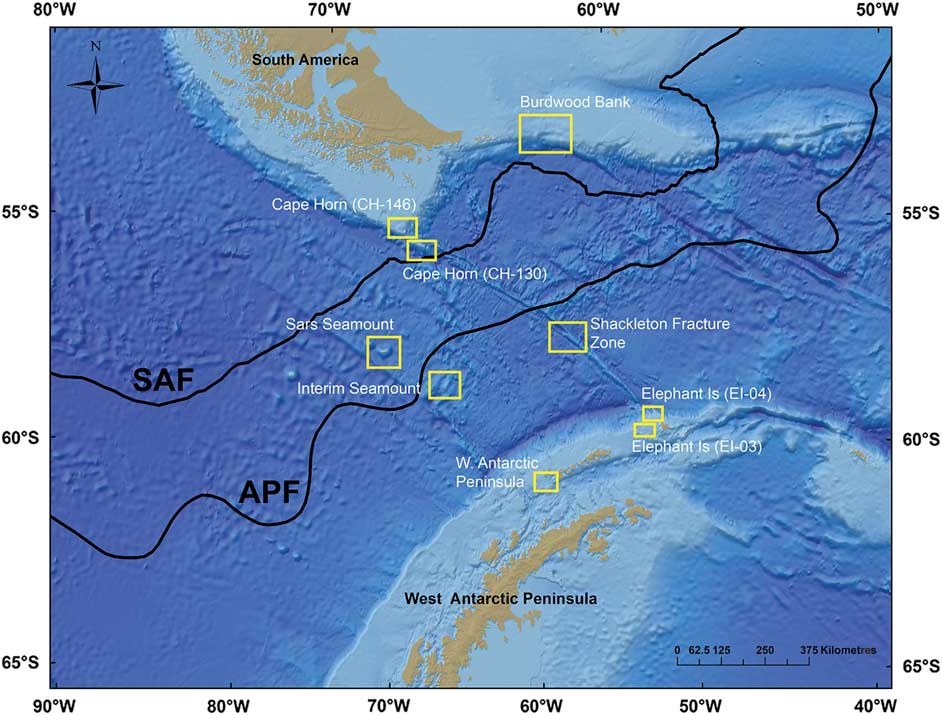
The Drake Passage creates relatively sharp oceanographic boundaries between sub-polar and polar seas (Fig. 1). Correspondingly, this area has been observed to have equally sharp boundaries in faunal distributions giving rise to complex patterns in benthic community structure (Kaiser et al. Reference Kaiser, Griffiths, Barnes, Brandão, Brandt and O’Brien2011) and population connectivity (Hunter & Halanych Reference Hunter and Halanych2008). The Antarctic Circumpolar Current (ACC) and deep waters are bathymetrically constrained resulting in well-defined water masses (Whitworth 1980, Orsi et al. Reference Orsi1995). Multiple water masses including sub-Antarctic Mode Waters (SAMW), Antarctic Intermediate Waters (AAIW) and Circumpolar Deep Waters (CDW) are formed along frontal boundaries. Seasonal variability and turbulence along water mass boundaries may give rise to overlapping patterns in benthic community composition.
Map of the Drake Passage region and adjacent shelf areas. Sampling areas are shown in the yellow boxes. The Antarctic Polar Front (APF) and sub-Antarctic Front (SAF) boundaries are shown from Orsi et al. (Reference Orsi1995).
Biogeographical patterns have been observed among faunal assemblages delineated by sub-Antarctic (i.e. waters between the Antarctic Polar Front (APF) and sub-Antarctic Front (SAF)) and Antarctic (i.e. areas south of the APF) faunas (Ekman Reference Ekman1953). The Magellan region in particular has been found to have strong biogeographical and evolutionary affinities with sub-Antarctic islands and the western Antarctic Peninsula shelf (Page & Linse Reference Page and Linse2002, Stankovic et al. Reference Stankovic, Spalik, Kamler, Borsuk and Weglenski2002, Figuerola et al. Reference Figuerola, Gordon, Polonio, Cristobo and Avila2014). Abyssal and bathyal faunas have also been identified as having similar patterns in adjacent deep ocean basins (Vinogradova Reference Vinogradova1997, Zezina Reference Zezina1997, O’Loughlin et al. Reference O’Loughlin, Paulay, Davey and Michonneau2011). For the greater part of the 20th century, these findings reinforced a putative biogeographical barrier between Antarctic faunas and those of adjacent shelf and deep sea areas. However, more recently, application of molecular techniques (Allcock & Strugnell Reference Allcock and Strugnell2012) and biogeographical databases indicate overlap among regions across many taxa (Griffiths et al. Reference Griffiths, Barnes and Linse2009).
Southern Ocean seamounts
Where oceanographic frontal zones cross oceanic rises, biogeographical regions can overlap, potentially leading to increased local and regional diversity (Watling et al. Reference Watling, Guinotte, Clark and Smith2013). Seamounts are numerous but poorly sampled submarine topographical features throughout the Southern Ocean (Thresher et al. Reference Thresher, Adkins, Fallon, Gowlett-Holmes, Althaus and Williams2011, Waller et al. Reference Waller, Scanlon and Robinson2011). Of the few that have been studied, many exhibit spatially distinct faunal assemblages (Gutt et al. Reference Gutt, Fricke, Teixidó, Potthoff and Arntz2006, Bowden et al. Reference Bowden, Schiaparelli, Clark and Rickard2011, Thresher et al. Reference Thresher, Adkins, Fallon, Gowlett-Holmes, Althaus and Williams2011) and complex vertical zonation patterns (Thresher et al. Reference Thresher, Althaus, Adkins, Gowlett-Holmes, Alderslade, Dowdney, Cho, Gagnon, Staples, McEnnulty and Williams2014). Furthermore, seamounts are hypothesized to act as stepping stones for bridging evolutionary distant populations (Rowden et al. Reference Rowden, Dower, Schlacher, Consalvey and Clark2010). In the Drake Passage, seamounts may act as stepping stones for dispersal at depth across an oceanographic expanse. Understanding stepping stone dynamics among seamounts in the Southern Ocean and Drake Passage may provide insight to new population connectivity pathways linking Antarctic communities to those of adjacent shelf areas.
Cold-water corals in the Drake Passage
Understanding patterns of diversity within and among coral communities in the deep sea is of particular interest because of their role in creating habitat heterogeneity and enhancing biodiversity (Buhl‐Mortensen et al. Reference Buhl‐Mortensen, Vanreusel, Gooday, Levin, Priede, Buhl‐Mortensen, Gheerardyn, King and Raes2010). Preliminary assessments indicate that temperature and substrate type strongly influence the distribution of cold-water coral, which comprise an important part of benthic diversity in the Drake Passage region (Waller et al. Reference Waller, Scanlon and Robinson2011). Diverse assemblages of cup corals (order: Scleractinia), lace corals (family: Stylasteridae) and soft corals (sub-class: Alcyonacea) have recently been observed in abundance at many locations and depths including Burdwood Bank, the deep Cape Horn shelf and the western Antarctic Peninsula (Häussermann & Försterra Reference Häussermann and Försterra2007, Waller et al. Reference Waller, Scanlon and Robinson2011, Waller & Robinson Reference Waller and Robinson2012, Margolin et al. Reference Margolin, Robinson, Burke, Waller, Scanlon, Roberts, Auro and van de Flierdt2014). Photographic and video surveys using high-resolution cameras, rather than destructive trawls, are shown to be more effective for understanding the contribution of these organisms to the benthic community composition (Williams et al. Reference Williams, Althaus and Schlacher2015). Unresolved taxonomic and phylogenetic relationships, particularly among the relatively species-rich octocorals, combined with under-sampling biases have further hindered biogeographical conclusions about cold-water coral diversity in the region.
Goals
The purpose of this paper is to explore benthic community structure among megafaunal assemblages across bathyal and abyssal depths within the Drake Passage. How abundance and diversity of the megabenthos changes across Drake Passage latitudes and over depth will be evaluated. Community structure and species distributions will be examined along with environmental and physical gradients to enhance existing knowledge to the extent of historically defined biogeographical regions and environmental drivers in this poorly sampled area.
Methods
Data for this study were collected over a series of two cruises in the Drake Passage aboard the RV Nathaniel B. Palmer in April–May 2008 (NBP08-05) and May–June 2011 (NBP11-03). These cruises employed an array of photographic vehicles including a semi-autonomous camera sled (TowCam) and an independent drop-camera system to opportunistically image benthic communities along complex topography that did not permit towed operations. TowCam image scoring provided a set of quantitative data on biological community structure and underlying substrate while the higher resolution drop-camera systems facilitated further identification of megafaunal species.
Study area
Benthic communities were examined at nine sites across the Drake Passage: Burdwood Bank, Shackleton Fracture Zone, Elephant Island, western Antarctic Peninsula shelf, Sars Seamount, Interim Seamount and Cape Horn (Fig. 1, Table I). All locations in this analysis were surveyed with TowCam in 2011 with the exception of the Elephant Island sites, which were sampled in 2008. Permission for sampling and collections in territorial waters were obtained from the Chilean Navy Hydrographic and Oceanographic Service and Argentinian Ministry of Foreign Relations.
TowCam survey metadata by site. Sites are arranged by increasing latitude from north to south.

Burdwood Bank is a shallow (~300–400 m) shelf area along the north-western boundary of the Scotia Sea. The Cape Horn sites lie at the southernmost point of the South American continental shelf. The Shackleton Fracture Zone is a transform fault ridge on the boundary between the Antarctic and Scotia tectonic plates running NW–SE across the Drake Passage. This submarine feature intersects both the deep Cape Horn shelf and Elephant Island regions at its northern and southern termini, respectively. Interim and Sars seamounts are isolated topographical rises (peaks < 1000 m depth) in the central Drake Passage. The western Antarctic Peninsula shelf and South Shetland Arc regions are the southern boundaries of the Drake Passage and ACC flow. The Bransfield Strait and deep underlying channel separates the South Shetland Islands from the west Antarctic Peninsula shelf proper. Elephant Island lies at the far north-eastern end of the South Shetland Arc.
Sampling methods
TowCam surveys at each site provided a suitable volume of images to quantitatively compare benthic communities between sites (Fig. 2). In 2008, TowCam was equipped with a DSPL DigiSeaCam (Nikon CoolPix995 3.3 megapixel camera), strobe lighting system (Benthos 383), an on-board CTD (SBE25, Sea-Bird Electronics), laser scale and Niskin sampling bottles. In 2011, TowCam was upgraded with a higher resolution Nikon D90 12.3 megapixel camera. In both instances, the vehicle was towed across the sea floor at ~0.25 kt for between 1–5 km. Cameras triggered automatically every 10 seconds yielding ~1000–2000 images per 1–2 km tow. One TowCam transect was conducted at each site.
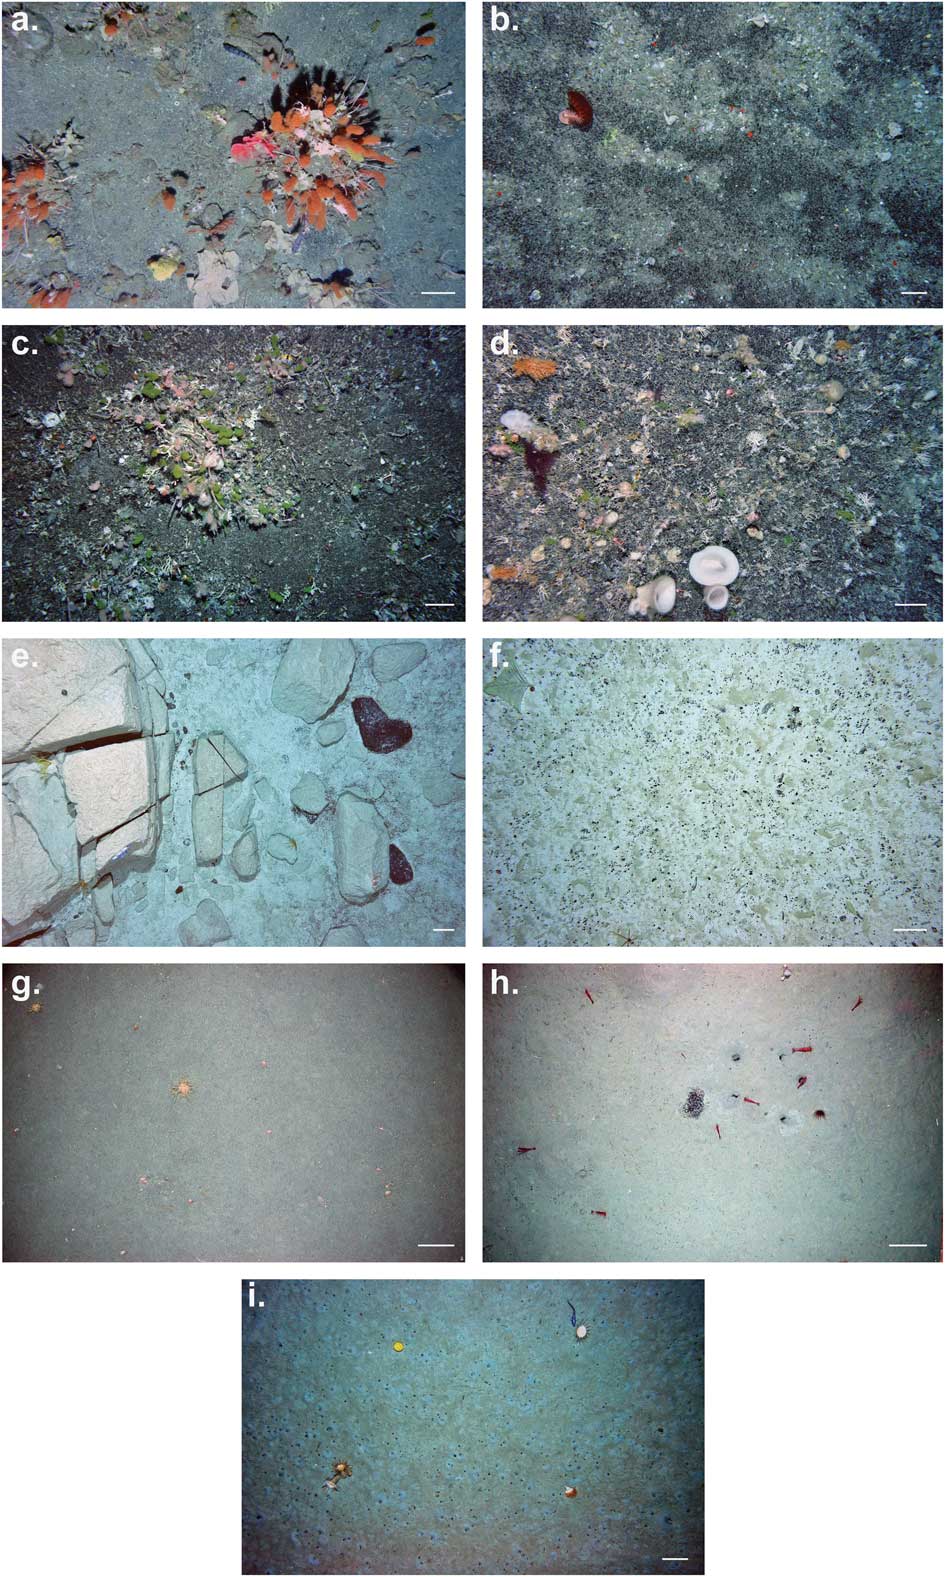
Sea floor images from deep sea environments across the Drake Passage. a. Burdwood Bank (325 m) coral gardens. b. Cape Horn (CH-146), 442 m. c. Cape Horn (CH-130), 967 m. d. Sars Seamount peak, 503 m. e. Shackleton Fracture Zone, 2252 m. f. Interim Seamount, 3058 m. g. Elephant Island (EI-03), 400 m. h. Elephant Island (EI-04), 1905 m. i. Western Antarctic Peninsula shelf (WAP), 584 m. Scale bars are equivalent to ~22 cm.
For obtaining more detailed qualitative data, a drop-camera unit was equipped with an additional high-resolution Nikon D90 camera, strobes and laser scale (15 cm), and was deployed to the sea floor by wire. The unit was triggered upon reaching the sea floor by a 3 m weighted line connected to a magnetic contact switch. Several series of images were taken at each site by conducting short hops across the sea floor.
Epibenthic trawls (e.g. 5.5 m Otter Trawl) were conducted at each camera survey location to acquire representative biological voucher specimens to aid in species identification. To identify water column characteristics at each site, full depth profiles were taken immediately adjacent to all sampling locations in deep water (> 3000 m) using a Sea-Bird 991plus CTD unit and bottle rosette system.
Image preparation
Images were initially sorted for quality by removing blurry, overexposed or otherwise obstructed frames. TowCam altimetry metadata were used to exclude images taken at > 5.5 m and < 3 m off the bottom to maintain consistency of scale for biological identification. The area of the sea floor within each image was calculated by measuring the relative distance between the laser scalers and the photo frame dimensions using ImageJ processing software. This yielded individual frames ~10 m2 in area for most tows (Table I). All images were colour-corrected using Adobe Photoshop CS6. Because images typically overlapped by three to four sequential photographs (roughly 30–40 seconds apart), sub-sampling was conducted by extracting one photo per minute of bottom time (by recorded time-stamp) over the interval where the sea floor was in sight. To maximize sampling effort at each site, the greatest number of viable photos were used in each transect. This process resulted in a set of spatially independent non-overlapping samples for biological scoring.
Image analysis
Benthic megafauna (defined here as organisms large enough to be visible in sea bed photographs, typically ≥5 cm), were enumerated and identified to the lowest taxonomic level possible. Sample specimens collected from trawls and dredges on-site were used to validate photographic identification. Where physical specimens could not be found, further taxonomic expertise was consulted (see acknowledgements). Every effort was made to assign individuals to a corresponding Latin binomial. If a positive named identification could not be made, organisms were assigned a morphospecies identifier based on the lowest confirmed taxonomic level. All morphospecies identifiers were held consistent throughout the dataset. No organism was identified to the species level based solely on observations within images. To maintain consistency among morphospecies identification criteria, hard to distinguish groups (e.g. small ophiuroids, stylasterid hydrocorals, brachiopods), where individual morphospecies could not be differentiated, were omitted from diversity analyses. Summary statistics of observed taxa at all locations are reported in the supplemental material found at http://dx.doi.org/10.1017/S0954102017000256 (Tables S1–S9). Qualitative substrate characteristics were scored within each photo to assess dominant habitat types and overall environmental heterogeneity. Sediment composition was (coarse, fine or rocky (i.e. gravel, cobble, boulder)) and texture (e.g. soft, coarse, type of sort) were approximated within photo frames. Microhabitats created by physical and biological processes (e.g. sediment ripples, biogenic rubble, infauna burrows) were also noted.
Statistical analyses
Biological data were initially compiled into a database in Microsoft Excel and analysed using PRIMER v6.0 (Clarke & Gorley Reference Clarke and Gorley2006). Species accumulation curves were constructed for each sampling location using sea floor photographs area (Fig. S1 found at http://dx.doi.org/10.1017/S0954102017000256). For all TowCam transects, representative biodiversity values were calculated using Shannon diversity (H’), Pielou’s Evenness (J’), Hurlbert’s Es(100) rarefaction richness and mean megafaunal density (individuals per m2) using abundance data in PRIMER. To examine community-level similarities between sites, several multivariate tests were conducted in PRIMER using a Bray–Curtis resemblance matrix of morphospecies abundance values. Multiple one-way analysis of similarity (ANOSIM) tests were conducted between sites using individual photos as replicate samples (Table S10 found at http://dx.doi.org/10.1017/S0954102017000256). Species abundance data were square root transformed to down-weight the influence of extremely abundant taxa. Non-metric multidimensional scaling (nMDS) ordinations were constructed from site-pooled resemblance matrix to visualize multivariate spatial relationships between benthic communities. Finally, cluster analyses based on group averaged linkages were used to examine levels of morphospecies similarities between sites and regions. Similarity profile (SIMPROF) tests were examined on both cluster and nMDS plots to explore significant biological structuring in the dataset.
Results
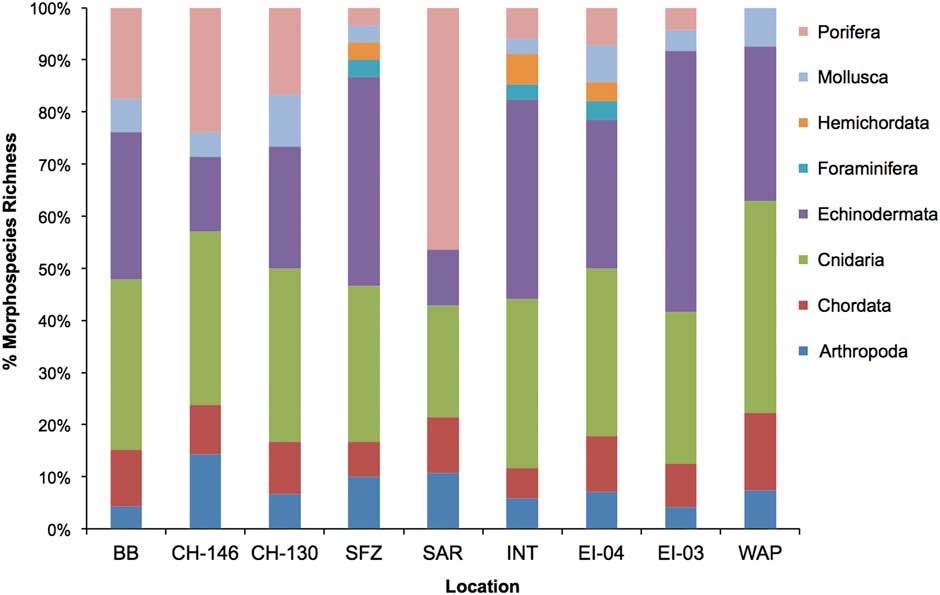
In all, 1003 images were scored covering 12 970.7 m2 of sea floor. The resulting 21 943 individuals were identified to 200 resolvable morphospecies within eight phyla. Across all sites cnidarians, echinoderms and poriferans were the dominant phyla by percent species representation in each community (Fig. 3). Species accumulation curve analysis indicated curves were asymptotic or near-asymptotic for all locations with the exception of Burdwood Bank, Shackleton Fracture Zone and Interim Seamount (Fig. S1). Asymptotic curves at sites indicate a relatively well-sampled megafaunal population.
Sea floor community composition by phyla at all sites. Data are shown as percent total morphospecies richness. Data are displayed latitudinally from north (left) to south (right). Site abbreviations are as shown in Table I.
Environmental data
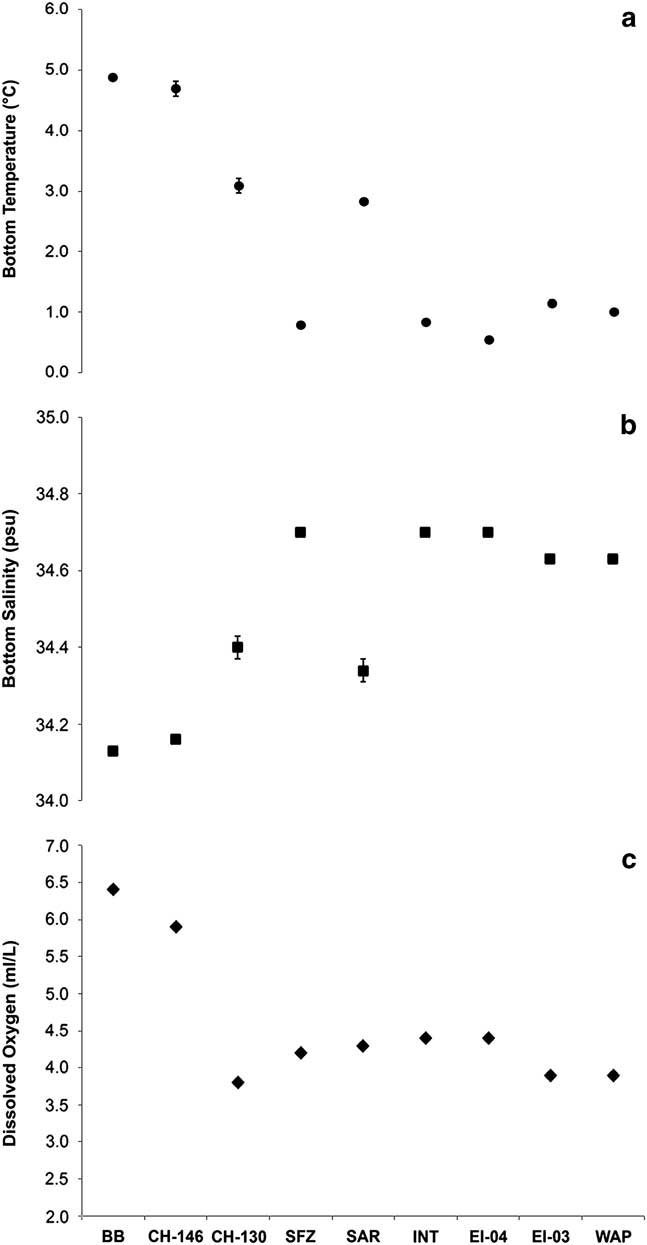
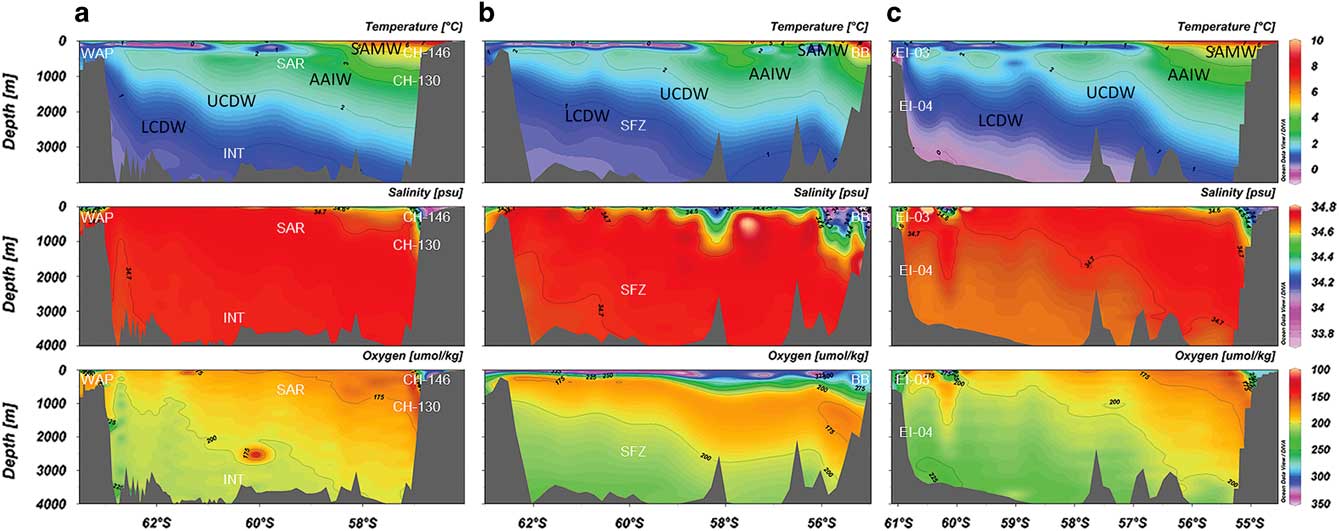
Sea floor temperature, salinity and dissolved oxygen profiles at each sampling location were largely consistent with major deep Southern Ocean water masses and Antarctic/Weddell Sea shelf-derived waters (Fig. 4 and Table S11 found at http://dx.doi.org/10.1017/S0954102017000256). Burdwood Bank and Cape Horn CH-146 (~300–500 m) temperature, salinity and dissolved oxygen concentration sea floor profiles were consistent with SAMW. The more southerly and deeper Cape Horn CH-130 (~1100 m) and Sars Seamount (~500–530 m) sampling locations were bathed in AAIW. Two mid-passage bathyal sites, Shackleton Fracture Zone (~2200 m) and Interim Seamount (~3000 m), were consistent with Lower Circumpolar Deep Waters (LCDW). On the western Antarctic Peninsula shelf, the EI-03 and WAP sites were most consistent with Antarctic and Weddell Sea shelf-derived waters. Elephant Island EI-04 appeared to be bathed in LCDW based on dissolved oxygen and salinity profiles but, compared to Elephant Island EI-03, experienced cooler temperatures (~0.5°C) due to mixing with cold, newly formed bottom waters moving down the lower shelf slope.
Sea floor temperature, b. salinity and c. dissolved oxygen concentration at sampling stations across the Drake Passage. Dissolved oxygen concentrations were determined from downcast water column CTD profiles at each sample site area. Data are displayed latitudinally from north (left) to south (right). Error bars represent ± 1 s.e. Site abbreviations are as shown in Table I.
Burdwood Bank
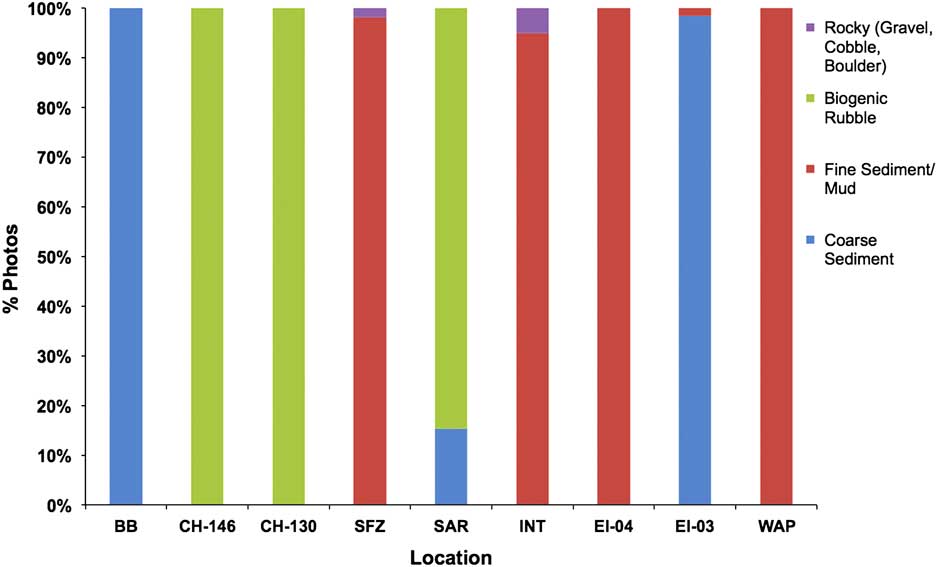
The Burdwood Bank camera transect was conducted on the western edge of Burdwood Bank at ~325 m depth (Table I). The bottom topography was relatively flat and composed of coarse sediments with occasional exposed gravel, cobbles and boulders (Fig. 5). Ophiuroid spp. 1 (probably both Ophiura sp. and Ophiacantha sp.) were observed to be the single most abundant morphospecies (~30% total abundance). Octocorals as a whole were the second most abundant group. Primnoid octocorals showed the highest morphospecies richness (75% of all coral spp.) within this group. Many coral species were observed colonizing low-profile relief, such as cobbles and boulders, often forming dense gardens (Fig. 2a). Astrotoma cf. agassizi Lyman brittle stars were also abundant on many octocoral coral colonies, particularly primnoid whips and fans. Asteroids were also quite species-rich but not as abundant as other echinoid representatives (primarily Austrocidaris and Sterechinus sp. urchins).
Dominant substrate type observed within TowCam images (shown as % of total images) from each site. Data are displayed latitudinally from north (left) to south (right). Site abbreviations are as shown in Table I.
Cape Horn
The Cape Horn survey areas were located at the southernmost extent of the South American continental shelf (Fig. 1). Substrates at each Cape Horn site were dominated by gravel and ferromanganese-coated stylasterid coral rubble. Consequently, stylasterid coral rubble provided the substrate on which many encrusting organisms and coral colonies were attached. Since it is difficult to differentiate between live and dead stylasterid corals, only presence or absence was noted.
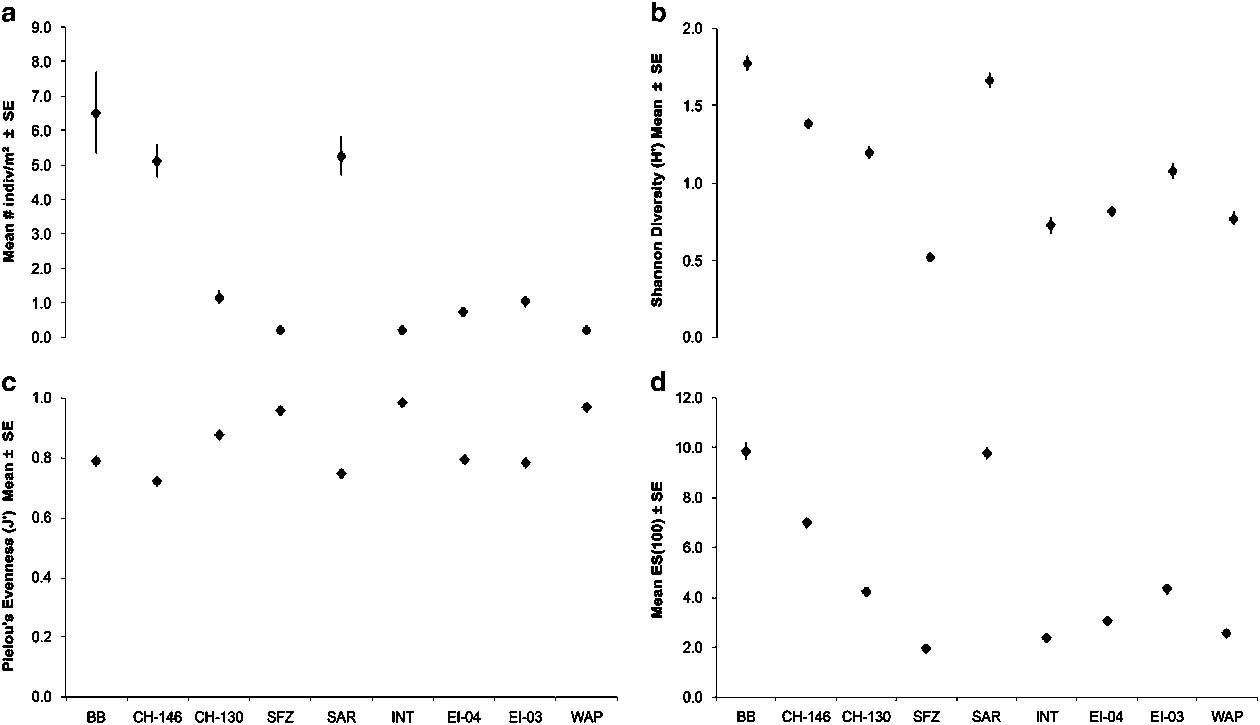
A substantial decrease in bottom temperature and dissolved oxygen concentration was observed, indicating a transition from SAMW at CH-146 to AAIW at CH-130 (Fig. 4). The shallower CH-146 had overall lower species-richness but higher megafaunal abundance (Fig. 6a & d). Several sponge and coral morphospecies in particular were observed to be similar between the Burdwood Bank, Sars Seamount and Cape Horn sampling locations. An unidentified red encrusting stoloniferous octocoral was the most abundant organism present (~49% total abundance) at CH-146, followed by small encrusting sponges and primnoid whip corals (Fig. 2b). The cup coral Balanophyllia malouinensis (Squires) was found to occur in several dense but highly patchy clusters throughout the length of the transect. At the deeper CH-130 site, both scleractinian cup corals and primnoid octocorals were most abundant amounting to > 50% of all individuals. The scleractinian coral Flabellum curvatum Moseley was most abundant (25% total abundance) followed by several bottlebrush-morphology primnoids (Primnoid bottlebrush sp. 1, Thouarella sp. 1 and 2) and whip corals (Fig. 2c). Echinoids (Austrocidaris sp. and Ctenocidaris sp.) were also frequently observed. At both sites, large branching corals were absent, with most colonies < 10 cm tall.
Patterns of benthic megafaunal diversity at all TowCam sites across the Drake Passage. a. Mean megafaunal density (individual m-2), b. Shannon Diversity (H’), c. Pielou’s evenness (J’) and d. Hurlbert Es(100) rarefaction. Data are displayed latitudinally from north (left) to south (right). Error bars represent ± 1 s.e. Site abbreviations are as shown in Table I.
Sars Seamount
As the topography of Sars Seamount is complex, the transect crossed the long axis of the flat peak of the seamount. The sea floor was blanketed by stylasterid and sponge rubble substrate. Live sponges and stylasterid hydrocorals were observed in abundance encrusting on underlying rubble (Fig. 2d). The community was rich in sponge morphospecies (46% of all observed morphospecies) compared to all other sites (Fig. 3). Both encrusting (sponge morphospecies 5) and large structure-forming sponges were common. Numerous fishes, shrimp and galatheid crabs inhabited spaces among the biogenic substrate matrix. Large lithodid crabs (cf. Paralomis sp.) were frequently observed among sponge and sylasterid coral gardens.
Interim Seamount
In contrast to Sars Seamount, Interim Seamount showed a more complex topographical profile that did not have a clearly defined flat peak. Thus, the tow was conducted west of the Interim Seamount rise at ~3000 m depth. The sea floor was composed of fine sediment with sparsely scattered gravel fragments (Fig. 2f). Well developed tracks and faecal casts from holothurians and hemichordates were frequently observed. Small (~5 cm) sediment-dwelling actinians (three distinct morphospecies) dominated much of the epifauna (~45% total abundance), followed by irregular echinoids and holothurians (Fig. 3). The highest morphospecies richness among all phyla was attributed to the echinoderms (38.2% of all species), specifically elasipodid holothurians (38.5% of all echinoderm species). Coral species were represented by Anthomastus sp. octocorals, antipatharians (Schizopathes sp.) and sea pens (Umbellula sp.).
Shackleton Fracture Zone
The sea floor west of the Shackleton Fracture Zone ridge was composed of predominately soft sediments with occasional instances of gravel patches and rocky outcrops (Fig. 2e). Similar to Interim Seamount, the sea floor community was dominated by actinian epifauna, ophiuroids and small crustaceans. Where hard substrate was available (often satisfied by cobble or occasional dropstones), cup corals and small encrusting hexactinellid sponges were present. On larger outcrops and low-profile ledges octocorals, predominately Anthomastus sp. and primnoid octocorals, were observed along with crinoids and brisingid stars. Further south along the fracture zone ridge extensive stylasterid reefs were also observed at shallower depths (~700 m).
Elephant Island
Both EI-03 and EI-04 transects were conducted on the shelf and slope west of Elephant Island (Fig. 1). The deeper EI-04 site revealed an exclusively fine, soft sediment bottom with numerous biogenic burrows. Occasional dropstones or bits of exposed rock were sparse but often wholly encrusted with epifauna. In contrast, the shallower EI-03 (~450 m) was relatively coarse sediment substrate mixed with shell material resulting in a sandy texture.
At the deeper EI-04 site the Antarctic shrimp Notocrangon antarcticus (Pfeffer) was most abundant occurring in densities >34 individuals 100 m-2. Small unidentified cup corals, anemones and cladorhizid sponges were observed on gravel and cobble-sized rocks and dropstones (Fig. 2h). Note that ophiuroid abundances at both Elephant Island locations represent minimum values because individuals were often partially buried and could not always be differentiated from overlying sediments.
Among the most abundant taxa at the shallower EI-03 location were corals, ophiuroids and echinoids. The Antarctic epifaunal scleractinian Flabellum impensum Squires was particularly abundant (29% of all individuals) and was observed in densities 15-times higher than the WAP site further south. Primnoid bottlebrush corals, possibly Thouarella antarctica Valenciennes, were often observed on hard substrates (i.e. cobble- and boulder-sized rocks) (Fig. 2g). The predatory asteroid Labidiaster annulatus Sladen were abundant near cobble and boulder outcroppings. Bayergorgia vermidoma Williams & Lopez-González, an endemic plexaurid octocoral with known distribution throughout the Magellan region and northern western Antarctic Peninsula, was also present at EI-03 but in substantially lower densities than in the South American shelf sites.
Western Antarctic Peninsula shelf
Similar to the sea floor environment around the deeper Elephant Island stations, the WAP site was exclusively composed of fine substrate with numerous biogenic burrows. Communities were composed of primarily soft-sediment-dwelling anemones, corals and echinoids (Fig. 2i). Poor photo resolution and integrity of collected physical specimens precluded species or generic identification of many actinian spp. with the exception of the abundant Hormathia sp. 1 (3.4 individuals 100 m-2). The scleractinian coral F. impensum was among the most abundant morphospecies observed (>2 individuals 100 m-2), but in substantially lower densities than at EI-03 (30.8 individuals 100 m-2). Among the mobile fauna, irregular urchins (Amphipneustes spp.) were also notably abundant.
Patterns in megafaunal abundance and diversity
Megafaunal density was highest at Burdwood Bank and declined precipitously with increasing depth at CH-146 and CH-130 (Fig. 6a and Table S12 found at http://dx.doi.org/10.1017/S0954102017000256). Further offshore, abundances at Sars Seamount were similar to those of the adjacent shelf area at CH-146. In sites south of the APF (including the deep Shackleton Fracture Zone region), low megafaunal densities (<~1 individual m-2) characteristic of deep sea bathyal and abyssal environments were common. Similar to the observed patterns in abundance, Shannon diversity (H’) was highest at Burdwood Bank and Sars Seamount (Fig. 6b & d). H’ diversity was lowest at Shackleton Fracture Zone and values gradually increased toward sites further south (Fig. 6b). Evenness (J’) index values were consistently high across all sites (> ~0.7) but highest among the deep Shackleton Fracture Zone and Interim Seamount sites (Fig. 6c). On both the western Antarctic Peninsula and South American shelf sites evenness values were similar despite greater differences among H’ diversity and Es(100) rarefaction indices (Fig. 6c).
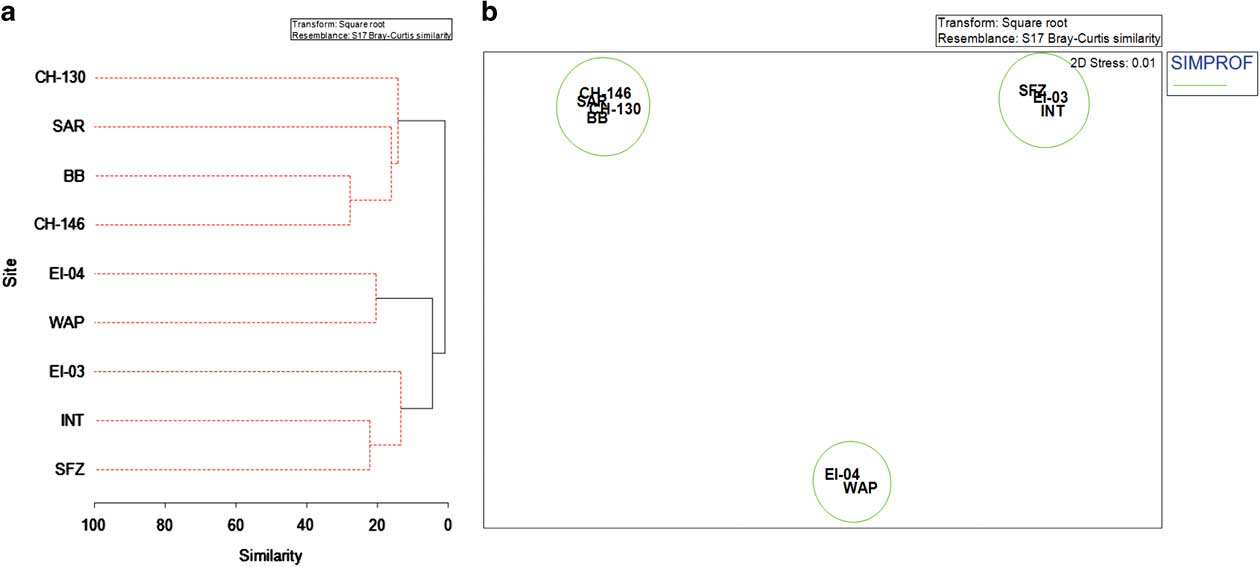
Benthic assemblages at each site were found to be significantly different from one another by pairwise ANOSIM tests based on species abundance (Global R=0.72, P<0.001) (Table S10). Hierarchical cluster analysis revealed a separation of clusters between northern and central Drake Passage sites versus southern and western Antarctic Peninsula locations (Fig. 7a). Secondary clustering within the latter group was divided between deep sites at Interim Seamount-Shackleton Fracture Zone-EI-04 and the shallower sites EI-03 and WAP on the western Antarctic Peninsula shelf. There was a higher percentage of similarity among northern and shallower sites on the South American margin and Sars Seamount than deeper and more southern sites in the central Drake Passage and on the western Antarctic Peninsula shelf. The SIMPROF analysis of clusters tested the significance level of clusters compared with the dataset as a whole. Clusters were significant only at the inter-region level. The nMDS ordinations reflected a divergence among sites similar to that of the hierarchical clustering analysis showing three distinct and significant groupings: South American shelf and Sars Seamount, Interim Seamount-Shackleton Fracture Zone-Elephant Island (deep), and western Antarctic Peninsula shelf-Elephant Island (shallow) (Fig. 7b). This divergence parallels large changes in temperature, salinity and dissolved oxygen with depth and latitude.
Multivariate analysis of benthic communities. a. Dendrogram of a cluster analysis for TowCam sampling locations based on species abundance. SIMPROF test results are shown with solid lines indicating significant groupings. b. Non-metric multidimensional scaling (nMDS) plot of site-pooled species abundance based on a Bray–Curtis similarity index. Significant SIMPROF groups from Fig. 7a have been overlaid. Site abbreviations are as shown in Table I.
Discussion
In this study, we expand upon existing work (Waller et al. Reference Waller, Scanlon and Robinson2011) by identifying three distinct biogeographical zones of interest in the Drake Passage: the Magellan-Sars Seamount zone, the western Antarctic Peninsula shelf zone and the lower bathyal–abyssal transition zone. In general, sites were observed to contain greater biogeographical similarities within-zone than among other zones in the region. These zones of interest correspond with temperature, salinity and dissolved oxygen profiles associated with major deep Southern Ocean water masses. The Magellan-Sars Seamount zone is identified by the presence of both SAMW and AAIW. Two deeper sites at Interim Seamount and along the Shackleton Fracture Zone were firmly within LCDW. Finally, the western Antarctic Peninsula shelf was divided bathymetrically with the two shallower shelf locations WAP and EI-04 located within AAIW but the deeper location EI-03 bathed by LCDW.
Cold-water corals and sponges were observed to be the dominant structure-forming fauna at all but the heavily sedimented sites on the western Antarctic Peninsula. Consistent with earlier preliminary analyses (Waller et al. Reference Waller, Scanlon and Robinson2011), live stylasterid hydrocorals, sponges and soft-bodied alcyonaceans were found to be substantial contributors to Drake Passage benthic communities. Sub-Antarctic sites, including Cape Horn, Burdwood Bank and Sars Seamount, hosted communities dominated by members of the hexacorallia, octocorallia and porifera. Soft-coral species, including Thouarella viridis Zapata-Guardiola & Lopez-González, Convexella magelhaenica (Studer), Primnoella sp., B. vermidoma, B. malouinenesis, were observed to be most abundant at nearly every site and across a range of depths from ~300–1100 m (Fig. 2a–d). The substrate requirements for these organisms were often similar at each site, being satisfied by small rubble or gravel. Conversely, the southernmost sites including Elephant Island, western Antarctic Peninsula, Interim Seamount and the Shackleton Fracture Zone, hosted faunistic elements representative of soft-bottom communities of the deep Antarctic shelf. These communities were often identifiable by the presence of a few widespread structure-forming species including alcyoniid octocorals (Anthomastus spp.), sea pens Umbellula sp. and cladorhizid sponges. Mobile fauna at these locations were represented by Antarctic shrimp species Notocrangon spp. and numerous elasipodid holothurians.
The degree of biogeographical affinity among localities across the Southern Ocean is important for understanding ecological and evolutionary relationships of high latitude marine fauna. The results of our survey suggest that noteworthy biogeographical relationships were observed in the Drake Passage between spatially isolated shelf and seamount environments, but also among isothermal provinces at depth. North of the APF and among shallower depths on Drake Passage seamounts, characteristically Magellanic and cosmopolitan faunas were dominant. In an examination of sponge distribution patterns throughout the Southern Ocean, Downey et al. (Reference Downey, Griffiths, Linse and Janussen2012) also found distribution similarities between sponge communities in the Magellan region and the greater Scotia Arc. Conversely, south of the APF and at greater depths, communities were more similar to western Antarctic Peninsula shelf and abyssal faunas. Biogeographical similarities between abyssal and western Antarctic Peninsula slope and shelf depths may be influenced by occasional intrusions of Circumpolar Deep Waters onto the shelf (Clarke et al. Reference Clarke, Griffiths, Barnes, Meredith and Grant2009). While these findings might suggest a biogeographical discontinuity, they also highlight lack of knowledge of complex relationships among benthic community structure, oceanographic boundaries and complex topography at depth, particularly between seamounts in this region.
Drake Passage seamounts and Southern Ocean biogeography
Sars Seamount lies roughly on the boundary of the APF, whereas the peak of Interim Seamount lies in Southern Ocean waters between Sars Seamount and the western Antarctic Peninsula continental shelf. In this analysis, we were not able to evaluate quantitative differences between the seamount peak communities between Sars and Interim seamounts because of the difficulty in obtaining consistent TowCam images from the complex topography of Interim Seamount. Unusually high megafaunal abundance comparable to shelf locations and high sponge diversity at this site, combined with a heavy blanket of underlying biogenic rubble is possibly indicative of high secondary productivity in the benthos. Conversely, based on preliminary observation, megafaunal communities on the peak of Interim Seamount (~725 m) did not closely resemble those observed at Sars Seamount, in terms of abundance and diversity, despite their geographical proximity and similar depth ranges. Megafaunal abundances were notably sparser on the peak of Interim Seamount, with only occasional observations of solitary sponges, live coral and coral rubble (Waller et al. Reference Waller, Scanlon and Robinson2011). Additionally, sea floor topography and substrate composition were markedly different with a higher prevalence of large heavily-manganese-coated boulder and pillow basalt coverage. While the peaks of Sars and Interim seamounts span only a 200 m depth difference, variability in the community structure and species representation could be attributable to two factors: i) geographical location relative to the APF and ii) overlying water mass structure at depth. As an upwelling frontal zone, productivity along this boundary can be substantially higher in the immediate area surrounding the frontal area leading to enhanced particulate organic carbon flux to the benthos (El-Sayed & Weber Reference El-Sayed and Weber1982). Alternatively, overlying water column properties including temperature, dissolved oxygen concentration, carbonate saturation and relative water motion could also influence representation among benthic communities. The abiotic water column properties measured at the peak of Interim Seamount places it firmly within Upper Circumpolar Deep Water (UCDW), while the peak of Sars Seamount lies in AAIW. Both biological and environmental differences observed between AAIW and CDW suggests that a biogeographical barrier exists at depth in the central Drake Passage (Fig. 8). To test for differences in community structure based on water mass properties, methodological modifications including both vertical camera and additional quantitative sea floor sampling will be needed.
Latitudinal cross-section water column profiles of the Drake Passage region at a. 63–68°W, b. 62–65°W and c. 54–58°W. TowCam sampling approximate locations are overlaid in white text. Water masses are labelled in black text. Bottle data were acquired from the CLIVAR (Climate Variability and Predictability) and Carbon Hydrographic Data Office repository. Profiles were constructed with Ocean Data View software. Site abbreviations are as shown in Table I. AAIW = Antarctic Intermediate Waters, LCDW = Lower Circumpolar Deep Waters, SAMW = sub-Antarctic Mode Waters, UCDW = Upper Circumpolar Deep Waters.
In recent years, a growing body of literature has indicated that seamount communities can be compositionally similar to the sea floor benthos of nearby continental shelves (Arntz Reference Arntz2006, Gutt et al. Reference Gutt, Fricke, Teixidó, Potthoff and Arntz2006, Waller et al. Reference Waller, Scanlon and Robinson2011). Seamounts have also been proposed as connectivity pathways through stepping stone dispersal mechanisms (Rowden et al. Reference Rowden, Dower, Schlacher, Consalvey and Clark2010). Both Sars and Interim seamounts represent two high profile features out of 20+ peaks > 1000 m off the sea floor in the Drake Passage region, yet most remain critically under-sampled (Waller et al. Reference Waller, Scanlon and Robinson2011). Still, seamounts in the Drake Passage, as well as the greater Southern Ocean, provide an interesting opportunity to examine biogeographical transitions between deep sea benthic communities over relatively small spatial scales. Seamounts in the region may vertically transition two or more environmentally distinct water masses leading to biogeographical turnover across relatively abrupt vertical boundaries.
The deep Drake Passage has been a relatively poorly studied ecosystem compared to shallower environments on the Antarctic shelf (Brandt et al. Reference Brandt, Gooday, Brandao, Brix, Brokeland, Cedhagen, Choudhury, Cornelius, Danis, De Mesel, Diaz, Gillan, Ebbe, Howe, Janussen, Kaiser, Linse, Malyutina, Pawlowski, Raupach and Vanreusel2007) and South Georgia. One goal of understanding species distributions within the Drake Passage is to evaluate proposed biogeographical provinces based on environmental and biological models in the Southern Ocean. In a recent environmental data meta-analysis, Watling et al. (Reference Watling, Guinotte, Clark and Smith2013) proposed two distinct biogeographical provinces within the Drake Passage at lower bathyal depths (800–3500 m). Both Antarctic and sub-Antarctic bathyal province delineations occur at the approximate location of oceanographic frontal boundaries. Furthermore, these modelled boundaries complement the observed patterns in the present species distribution study at bathyal depths. Abyssal provinces in the western Antarctic, also identified by Watling et al., match the observed community structure and species similarities between Interim Seamount and the Shackleton Fracture Zone in this study (Fig. 3). While the findings of Watling et al. (Reference Watling, Guinotte, Clark and Smith2013) provide some broad support for the biogeographical groupings identified by this study, some isolated features, such as seamounts, are likely to be poorly resolved into provinces using the scale of this model.
Conclusions
The Drake Passage bathyal communities can be parsed into three biogeographical areas of interest which correspond to major overlying Southern Ocean water masses. Cold-water corals and sponges constitute the majority of megafaunal community diversity at depth, particularly on continental margin and seamount formations north of the APF. There is potential to greatly expand knowledge of biodiversity and connectivity among deep water communities by examining the taxonomic and phylogenetic composition of seamount faunas in the Drake Passage, particularly among cold-water corals and related cnidarians. Additional work should recognize the important influence that water masses can exert on deep water marine biogeography to better predict potential range shift probabilities and species invasions across the Southern Ocean. Further examination of benthic communities along seamount depth gradients may yield insight to the potential deep sea connectivity pathways between the Antarctic continent and adjacent landmasses.
Acknowledgements
We would like to thank the efforts of the science party and crew of the RV Nathaniel B. Palmer on cruises NBP11-03 and NBP08-05. Also, a special thanks to K. Scanlon and S. Hoy for helping to prepare seafloor mapping products, as well as D. Villeneuve for processing sea floor imagery. Valuable species identification assistance was provided by L. Allcock, K. Eckelbarger, L. Grange, E. Rodriguez, M. Taylor and L. Watling. Finally, we would like to thank three anonymous reviewers for comments and suggestions that greatly improved the quality of the final manuscript. Funding for this project was awarded to Rhian Waller and Laura Robinson under NSF Office of Polar Program grants OPP #0636787 (Robinson & Waller) and OPP #1127582 (Waller & Robinson).
Author contribution
RGW designed the research study, collected samples and conducted field operations. RGW and SRA conducted the analyses and wrote and edited the manuscript.
Supplemental material
Supplemental tables and a figure will be found at http://dx.doi.org/10.1017/S0954102017000256.



