


1. Introduction
A classical problem of hydrodynamics is that of estimating the wave-induced force on a vertical circular cylinder. In the most practically relevant form of the problem, the wave field is assumed to be irregular, and the quantity of interest therefore becomes the probability density function (PDF) of the force exerted on the cylinder. In principle, this variant of the problem may be solved exactly by calculating the irregular flow field around the cylinder, constructing the stress tensor and integrating its projections over the part of the cylinder's surface immersed in the water. Unfortunately, this simple strategy is not practically feasible under realistic ocean conditions where both pressure and viscous effects give substantial contributions to the force. Analytical methods fall short due to a combination of the complexity of the governing equations and the irregular geometry of the fluid domain. Numerical methods, on the other hand, may in principle be used, but the fine resolution required to accurately resolve the boundary layers, the shedding of vortices as well as the wave field, combined with the large spatial and temporal scales required to accurately sample the PDF, leave them impractical even with the immense computational power available today.
Currently, inexact procedures therefore constitute the only vehicle with which estimates for the PDF of the force on the cylinder can be produced under general conditions. Of these procedures, by far the most popular has been the one proposed by Morison et al. (Reference Morison, O'Brien, Johnson and Schaaf1950), who heuristically derived what is now known as the Morison equation. Choosing a coordinate system in which the  $(x,y)$-plane coincides with the still water plane oriented such that the
 $x$-axis points in the mean direction of the wave field, and the
 $z$-axis points vertically upwards, the generalized form of this equation (Borgman Reference Borgman1958) states that the inline force on the cylinder,
 $\boldsymbol {F} = (F_x, F_y)$, satisfies the relation
 \begin{equation} \frac{\partial
\boldsymbol{F}}{\partial z} = K_I \boldsymbol{a}_n + K_D
\boldsymbol{v}_n |\boldsymbol{v}_n|,\quad \text{with}\ K_I
= \tfrac{1}{4} {\rm \pi}\rho D^2 C_M\quad \text{and}\quad K_D =
\tfrac{1}{2} \rho D C_D.
\end{equation}
Here  $\rho$ is the density of the water,
 $D$ is the diameter of the cylinder, and
 $C_M$ and
 $C_D$ are the inertia and drag coefficients, respectively. Moreover,
 $\boldsymbol {a}_n = (a_x, a_y)$ and
 $\boldsymbol {v}_n = (v_x, v_y)$ are the fluid acceleration and velocity vectors in the
 $(x,y)$-plane at the centre of the cylinder, respectively, for a wave field that is undisturbed by the cylinder. When the waves are not breaking, such a wave field is very well described by potential flow theory, which therefore may be used in connection with (1.1) to calculate the statistical properties of the inline force. This fact has been utilized by, for example, Pierson & Holmes (Reference Pierson and Holmes1965) and Borgman (Reference Borgman1967) (see also Borgman Reference Borgman1972) who used first-order potential flow theory to derive analytical expressions for the PDF of
 $\partial _z \boldsymbol {F}$ at an arbitrary
 $z$-level for a unidirectional wave field, and by Song, Wu & Wiwatanapataphee (Reference Song, Wu and Wiwatanapataphee2000) who carried out a derivation for the same quantity to second order in nonlinearity. It should be noted, however, that these PDFs cannot be used as replacements for the PDF of the total force,
 $\boldsymbol {F}$, which is found by integrating (1.1) from the seabed to the free surface with respect to
 $z$. The reason is, of course, that
 $\partial _z \boldsymbol {F}$ is a highly correlated stochastic process when viewed as a function of
 $z$, and at a minimum the covariance structure of
 $\partial _z \boldsymbol {F}$ therefore must be known in order to calculate the PDF of
 $\boldsymbol {F}$. This was realized by Tickell (Reference Tickell1977), who wrote down a formal expression for the joint PDF of
 $\partial _z \boldsymbol {F}$ at an arbitrary number of different
 $z$-levels based on first-order potential flow theory for a unidirectional wave field, but his work did not lead to an actual distribution for the total force. In fact, to our knowledge, no results for the PDF of the total force have been presented to date. Moreover, since the studies involving the distribution of
 $\partial _z \boldsymbol {F}$ all have been based on unidirectional wave fields described by low-order theories, the effects of directionality and wave steepness on the total inline force remain completely unclear.
In this paper we aim to shed light on exactly these effects on the total inline force for nonlinear wave fields in infinitely deep water. To keep the investigation as general as possible, we assume  $\rho$,
 $D$,
 $C_M$ and
 $C_D$ to be constant with depth and time, and consider the dimensionless total inline force
 $F^\ast = |\boldsymbol {F}|/( (K_I a_0 / k_p)^2 + (K_D v_0^2 / k_p)^2 )^{1/2}$, where
 $a_0$ and
 $v_0$ are characteristic accelerations and velocities of the fluid for which expressions will be derived and
 $k_p$ is the peak wavenumber of the wave field. Using (1.1) in combination with these assumptions it is straightforward to show that
 \begin{equation} F^\ast{=}\left| (1 - \mathcal{P}^2)^{1/2} \frac{\boldsymbol {\mathcal I}}{a_0 / k_p} + \mathcal{P} \frac{\boldsymbol {\mathcal D}}{v_0^2 / k_p}\right|, \end{equation}
in which  $\mathcal {P}$ is a parameter given by
 \begin{equation} \mathcal{P} = \frac{K_D v_0^2}{((K_I a_0)^2 + (K_D v_0^2 )^2 )^{1/2}}, \end{equation}
and the vectors  ${\boldsymbol {\mathcal I}} = (\mathcal {I}_x, \mathcal {I}_y)^\textrm {T}$ and
 ${\boldsymbol {\mathcal D}} = (\mathcal {D}_x, \mathcal {D}_y)^\textrm {T}$ are defined as
 \begin{equation} {\boldsymbol {\mathcal I}} \equiv \int_{-\infty}^{\eta} \boldsymbol{a}_n \,\mathrm{d} z\quad \text{and}\quad {\boldsymbol {\mathcal D}} \equiv \int_{-\infty}^{\eta} \boldsymbol{v}_n |\boldsymbol{v}_n| \,\mathrm{d} z. \end{equation}
In these equations and throughout the paper  $\eta$ denotes the surface elevation, and we will refer to
 ${\boldsymbol {\mathcal I}}$ and
 ${\boldsymbol {\mathcal D}}$ as the depth-integrated inertia and drag terms, respectively. Clearly,
 $\mathcal {P}$ is a measure of the magnitude of the drag force relative to the total inline force with
 $\mathcal {P} = 0$ and
 $\mathcal {P} = 1$ corresponding to completely inertia and drag-dominated forces, respectively. Moreover, it will at a later stage be seen that for a given wave field,
 $\mathcal {P}$ is completely determined by the properties of the cylinder. As such, if
 $F^\ast$ is affected by the steepness and directionality of the wave field then it must be because the depth-integrated quantities are affected by these parameters, and we therefore begin our investigation by studying the PDFs of the components of
 ${\boldsymbol {\mathcal I}}$ and
 ${\boldsymbol {\mathcal D}}$. Having characterized the behaviour of these quantities, we then study the PDF of
 $F^\ast$ parametrically as a function of
 $\mathcal {P}$. In order to understand the role played by nonlinear effects, we derive a number of results for the PDFs
 $\mathcal {I}_x$,
 $\mathcal {I}_y$,
 $\mathcal {D}_x$ and
 $\mathcal {D}_y$ as well as for
 $F^\ast$ when
 $\mathcal {P} = 0$ and 1 based on first-order theory and compare them to the PDFs for the general nonlinear case. To calculate the latter PDFs, we perform numerical simulations of large irregular wave fields with different directional spreading and wave steepness using the numerical method of Klahn, Madsen & Fuhrman (Reference Klahn, Madsen and Fuhrman2021a). This numerical method solves the fully nonlinear equations of potential flow theory for a single valued free surface, and has been shown to give highly accurate results on a number of challenging deep water problems. In particular, its ability to handle high-order nonlinear wave-wave interactions without any approximations is important for this study, as, for example, third-order nonlinearities have been shown by Onorato et al. (Reference Onorato2009), Toffoli et al. (Reference Toffoli, Gramstad, Truelsen, Monbaliu, Bitner-Gregersen and Onorato2010) and Xiao et al. (Reference Xiao, Liu, Wu and Yue2013) to be capable of changing the statistical properties of long-crested wave fields substantially.
Regarding the use of the Morison equation, we do acknowledge that more accurate formulations exist. Several of these formulations use the idea of Lighthill (Reference Lighthill1986), who suggested that the wave loads can be separated into potential flow forces and vortex flow forces and that these can be treated independently. The most general extension of the Morison equation based on this idea is perhaps that of Rainey (Reference Rainey1989, Reference Rainey1995), who derived an expression for the inertia term correct to second order in nonlinearity for a very general assembly of slender cylinders from energy considerations. For a vertical circular cylinder, his theory shows that the inertia term of the Morison equation should in fact be supplemented with two additional terms: a term which arises because the fluid flow is not uniform with depth, and a term which takes into account the point loads at the free surface (see also Manners & Rainey Reference Manners and Rainey1992). Despite the obvious shortcomings of the Morison equation, we do believe that its widespread use justifies an investigation of its statistical properties. In that connection we stress, however, that if the above mentioned fully nonlinear simulations agree with the first-order approximations, it simply means that the results of the Morison equation can be explained from first-order theory. It does not (necessarily) mean that the more exact inertia term of e.g. Rainey is unaffected by nonlinear effects.
The remainder of this paper is organized as follows. In § 2 we describe the physical system under consideration, its governing equations and its initial condition. In § 3 we briefly discuss the numerical methods used for the time integration of the wave fields as well as the computation of the depth-integrated quantities, and state the computational parameters used in the simulations. We derive the PDFs of the depth-integrated quantities with first-order theory in § 4, and compare these with the PDFs obtained from the fully nonlinear simulations for different degrees of wave steepness and directionality in § 5. In the discussion of the nonlinear results, we make use of some results related to the effect of second-order nonlinearities on the PDFs of  $\mathcal {I}_x$,
 $\mathcal {I}_y$ and
 $v_y|_{z = \eta }$, and for completeness, we prove these results in appendices A and B. In § 6 we study the PDF of
 $F^\ast$ as a function of
 $\mathcal {P}$, before we finally draw conclusions in § 7.
2. Physical system and governing equations
We consider the time evolution of two-dimensional irregular wave fields in infinitely deep water which are assumed to satisfy the conditions of a potential flow and to have a non-overturning free surface. In addition, we take the wave fields to be periodic in the  $x$- and
 $y$-directions over distances
 $L_x$ and
 $L_y$, respectively. Once the initial conditions for the wave fields have been specified, their time evolution is completely determined by the irrotational Euler equations. As has, for example, been shown by Zakharov (Reference Zakharov1968), these equations may be written as
 \begin{gather} \frac{\partial^2 \varPhi}{\partial x^2} + \frac{\partial^2 \varPhi}{\partial y^2} + \frac{\partial^2 \varPhi}{\partial z^2} = 0 \quad \text{for }z < \eta, \end{gather}
 \begin{gather}\left.\frac{\partial \varPhi}{\partial z} \right|_{z \rightarrow - \infty} = 0, \end{gather}
 \begin{gather}\frac{\partial \eta}{\partial t} = \left( 1 + \left( \frac{\partial \eta}{\partial x}\right)^2 + \left( \frac{\partial \eta}{\partial y}\right)^2 \right) v_z^{(s)} - \frac{\partial \eta}{\partial x} \frac{\partial \varPhi_s}{\partial x} - \frac{\partial \eta}{\partial y} \frac{\partial \varPhi_s}{\partial y}, \end{gather}
 \begin{gather}\frac{\partial \varPhi_s}{\partial t} ={-}g \eta - \frac{1}{2} \left(\left(\frac{\partial \varPhi_s}{\partial x} \right)^2 + \left(\frac{\partial \varPhi_s}{\partial y} \right)^2 \right) + \frac{1}{2} \left( 1 + \left( \frac{\partial \eta}{\partial x}\right)^2 + \left( \frac{\partial \eta}{\partial y}\right)^2 \right) v_z^{(s)}, \end{gather}
where  $\varPhi _s \equiv \varPhi |_{z = \eta }$ is the velocity potential at the surface,
 $v_z^{(s)} \equiv \partial _z \varPhi |_{z = \eta }$ is the vertical velocity of the fluid at the free surface and
 $g$ is the gravitational acceleration. It should be noted that this set of equations constitutes an initial value problem for the pair
 $(\eta , \varPhi _s)$, and so the initialization of the system amounts to initializing these two variables. Following the work of Tanaka (Reference Tanaka2001), Toffoli et al. (Reference Toffoli, Gramstad, Truelsen, Monbaliu, Bitner-Gregersen and Onorato2010) and Xiao et al. (Reference Xiao, Liu, Wu and Yue2013), we construct the initial conditions for
 $(\eta , \varPhi _s)$ from a linear combination of sinusoidal wave components with independent random phases distributed uniformly over the interval
 $[0, 2{\rm \pi} ]$. For a generic component, we denote its angular frequency by
 $\omega$, its propagation angle relative to the
 $x$-axis by
 $\theta$, and we choose its amplitude according to a directional JONSWAP spectrum of the form
 $J(\omega , \theta ) = S(\omega ) D(\theta )$. The frequency part of the spectrum is given by the expression
 \begin{equation} S(\omega) = S_0 \left( \frac{\omega}{\omega_p} \right)^{{-}5} \exp \left( - \frac{5}{4} \left( \frac{\omega}{\omega_p}\right)^{{-}4} \right) \gamma^{\exp ( - ({(\omega/\omega_p - 1)^2}/{2\sigma^2}))}, \end{equation}
where  $\gamma = 3.3$,
 $\sigma = 0.07$ if
 $\omega < \omega _p$ and 0.09 otherwise,
 $\omega _p$ denotes the peak frequency of the wave field, and the constant
 $S_0$ is defined implicitly through the relation
 \begin{equation} \int_{0}^{\infty} S(\omega) \,\mathrm{d} \omega = \langle \eta^2 \rangle. \end{equation}
As such, the value of  $S_0$ is dictated by the steepness of the wave field,
 $\varepsilon = 2 k_p \langle \eta ^2 \rangle ^{1/2}$. We note that this definition of the wave steepness is the same as that used in the numerical studies of, for example, Toffoli et al. (Reference Toffoli, Gramstad, Truelsen, Monbaliu, Bitner-Gregersen and Onorato2010), Xiao et al. (Reference Xiao, Liu, Wu and Yue2013) and Klahn et al. (Reference Klahn, Madsen and Fuhrman2021a). The directional part of the spectrum is given by the expression
 \begin{equation} D(\theta) =
\begin{cases} \dfrac{\varGamma (N_D/2 +
1)}{\sqrt{\rm \pi} \varGamma ((N_D+1)/2)}\cos^{N_D} (\theta) &
\text{if }|\theta| \le {\rm \pi}/2,\\ 0 & \text{otherwise}, \end{cases}
\end{equation}
where  $\varGamma (\cdot )$ denotes the gamma function and
 $N_D$ is a parameter determining the width of the directional spectrum. The function
 $D(\theta )$ is shown in figure 1 for
 $N_D = 2$, 10, 50 and 100, and from it it is clear that the directional spread of the wave field decreases with
 $N_D$. It can also be seen from the figure that
 $D(\theta )$ always achieves its maximum at
 $\theta = 0$, and from this it follows that the main direction of the wave field is the positive
 $x$-direction.
The function  $D(\theta )$ given by (2.4) for the values
 $N_D = 2$, 10, 50 and 100.

3. Numerical methods
To simulate the wave fields described above, we use the recently developed volumetric pseudospectral method of Klahn et al. (Reference Klahn, Madsen and Fuhrman2021a). This method may be divided into two parts, namely, a part concerned with the time integration of  $\eta$ and
 $\varPhi _s$ using (2.1c) and (2.1d) under the assumption that
 $v_z^{(s)}$ is known, and a part dealing with the computation of
 $v_z^{(s)}$ from
 $\eta$ and
 $\varPhi _s$. The latter part is what sets it apart from other pseudospectral methods such as the methods of Dommermuth & Yue (Reference Dommermuth and Yue1987), West et al. (Reference West, Brueckner, Janda, Milder and Milton1987), Clamond & Grue (Reference Clamond and Grue2001) and Fructus et al. (Reference Fructus, Clamond, Grue and Kristiansen2005) as it solves the Laplace equation in the fluid domain without any kind of approximation except for discretization errors. As shown by Klahn et al. (Reference Klahn, Madsen and Fuhrman2021a), this strategy enables the solution of the Laplace equation with an error that decreases exponentially with the spatial resolution for practically all values of the water depth and the wave steepness when considering steady nonlinear waves. In order to remain efficient for large problems, the method utilizes an artificial boundary condition as used by Nicholls (Reference Nicholls2011) and a preconditioning strategy inspired by the work of Fuhrman & Bingham (Reference Fuhrman and Bingham2004). Denoting the total number of grid points by
 $N$, these techniques ensure that the computational effort per time step grows in proportion to
 $N \log (N)$ when increasing the horizontal resolution. In total, the method therefore offers high accuracy at a low computational cost.
In this section we briefly review the method, and refer to Klahn et al. (Reference Klahn, Madsen and Fuhrman2021a) for a full description and validation. In addition, we discuss the initialization of  $\eta$ and
 $\varPhi _s$, the numerical method used for the computation of
 $\mathcal {I}_x$,
 $\mathcal {I}_y$,
 $\mathcal {D}_x$ and
 $\mathcal {D}_y$, as well as the computational parameters used to perform the simulations.
3.1. Initialization
As mentioned in § 2, we initialize  $\eta$ and
 $\varPhi _s$ from the JONSWAP spectrum
 $J(\omega , \theta ) = S(\omega ) D(\theta )$ with
 $S(\omega )$ and
 $D(\theta )$ given by (2.2) and (2.4), respectively. The adopted numerical method for the solution of (2.1) approximates
 $\eta$ and
 $\varPhi _s$ in terms of truncated Fourier series, i.e.
 \begin{gather} \eta(x,y,t) = \sum_{n_x ={-}N_x}^{N_x-1} \sum_{n_y ={-}N_y}^{N_y-1} \hat{\eta}_{n_x, n_y}(t) \exp ( \text{i} \boldsymbol{k}_{n_x, n_y} \cdot \boldsymbol{r} ), \end{gather}
 \begin{gather}\varPhi_s(x,y,t) = \sum_{n_x ={-}N_x}^{N_x-1} \sum_{n_y ={-}N_y}^{N_y-1} \hat{\varPhi}_{n_x, n_y}(t) \exp ( \text{i} \boldsymbol{k}_{n_x, n_y} \cdot \boldsymbol{r} ), \end{gather}
and, therefore, the initialization procedure consists of computing the expansion coefficients  $\hat {\eta }_{n_x, n_y}$ and
 $\hat {\varPhi }_{n_x, n_y}$ corresponding to
 $J(\omega ,\theta )$ with random phases. Here
 $\boldsymbol {r} = (x,y)$ denotes the horizontal position and
 $\boldsymbol {k}_{n_x, n_y} = (2{\rm \pi} n_x/L_x, 2{\rm \pi} n_y/L_y)$ is the
 $(n_x, n_y)$th wavenumber vector. In order to compute the initial coefficients, we follow Tanaka (Reference Tanaka2001) and start by computing the number
 \begin{equation} b_{n_x, n_y} = \left( \frac{2{\rm \pi}^2 g^3}{ \omega_{n_x, n_y}^4 L_x L_y} J(\omega_{n_x, n_y}, \theta_{n_x, n_y}) \right)^{1/2} \exp({\text{i} \phi_{n_x, n_y}}), \end{equation}
where  $\omega _{n_x, n_y} = ( g | \boldsymbol {k}_{n_x, n_y} | )^{1/2}$ is the
 $(n_x, n_y)$th frequency,
 $\phi _{n_x, n_y}$ is a random number drawn from a uniform distribution over the interval
 $[0, 2{\rm \pi} ]$ and
 $\theta _{n_x, n_y}$ is the angle between
 $\boldsymbol {k}_{n_x, n_y}$ and the
 $x$-axis measured positively in the counter clockwise direction. From
 $b_{n_x, n_y}$ we then compute the initial coefficients as
 \begin{gather} \hat{\eta}_{n_x, n_y} = \left( \frac{|\boldsymbol{k}_{n_x, n_y}|}{ 2 \omega_{n_x, n_y}} \right)^{1/2} ( b_{n_x, n_y} + b_{{-}n_x, -n_y}^{{\ast}} ), \end{gather}
 \begin{gather}\hat{\varPhi}_{n_x, n_y} ={-} \text{i} \left( \frac{\omega_{n_x, n_y}}{2 |\boldsymbol{k}_{n_x, n_y}|} \right)^{1/2} ( b_{n_x, n_y} - b_{{-}n_x, -n_y}^{{\ast}} ), \end{gather}
where the symbol  $^\ast$ denotes complex conjugation. We note that this initialization procedure gives a wave field which is consistent with the governing equations only when these are linearized around the rest state. For that reason, the initial surface elevation should in all simulations ideally be normally distributed. With the present initialization procedure, this is only achieved, however, when a sufficiently large number of Fourier components is used, as described by Tucker, Challenor & Carter (Reference Tucker, Challenor and Carter1984). We have therefore checked that the parameters stated in § 3.5 indeed yield an initial surface elevation that is normally distributed to a high accuracy.
3.2. Time integration
Assuming that  $v_z^{(s)}$ is known, the numerical method discretizes the spatial part of (2.1c) and (2.1d) using the Fourier collocation method (see e.g. Kopriva Reference Kopriva2009). In this method,
 $\eta$ and
 $\varPhi _s$ are approximated by truncated Fourier series as in (3.1) and the equations are satisfied identically at the set of grid points
 \begin{equation} \left\{ (x_{n_x},
y_{n_y}) = \left.\left(\frac{L_x n_x}{2N_x}, \frac{L_y
n_y}{2N_y} \right)\right|\!1 \le n_x \le 2N_x \ \text{and}\
1 \le n_y \le 2N_y \right\}.
\end{equation}
At these points the spatial derivatives of  $\eta$ and
 $\varPhi _s$ are calculated from the truncated Fourier series with the fast Fourier transform providing the connection between grid point values and expansion coefficients. The spatial discretization generates evolution equations for the values of
 $\eta$ and
 $\varPhi _s$ at the grid points, and we integrate these in time using the classical fourth-order Runge–Kutta method with fixed step size
 ${\rm \Delta} t$. To avoid temporal instabilities due to the initial condition being based on linear theory, we use the adjustment scheme of Dommermuth (Reference Dommermuth2000) to ramp up the nonlinear interactions among the Fourier components of the wave field. We do so by multiplying the nonlinear terms of (2.1c) and (2.1d) by the function
 \begin{equation} R(t) = 1 - \exp \left( - \left( \frac{t}{T_R} \right)^n \right), \end{equation}
where  $n$ and
 $T_R$ are parameters to be specified, and we refer to the paper of Dommermuth for a precise definition of the nonlinear terms. To avoid temporal instabilities in general, which we note may be caused by the fact that our numerical method cannot take wave breaking into account, we employ the artificial damping strategy outlined by Xiao et al. (Reference Xiao, Liu, Wu and Yue2013) and multiply the
 $(n_x, n_y)$th Fourier coefficients of
 $\eta$ and
 $\varPhi _s$ by the number
 \begin{equation} D_{n_x, n_y} = \exp
\Bigg(-\left( \frac{|\boldsymbol{k}_{n_x, n_y}|}{8 k_p}
\right)^{30} \Bigg) \end{equation}
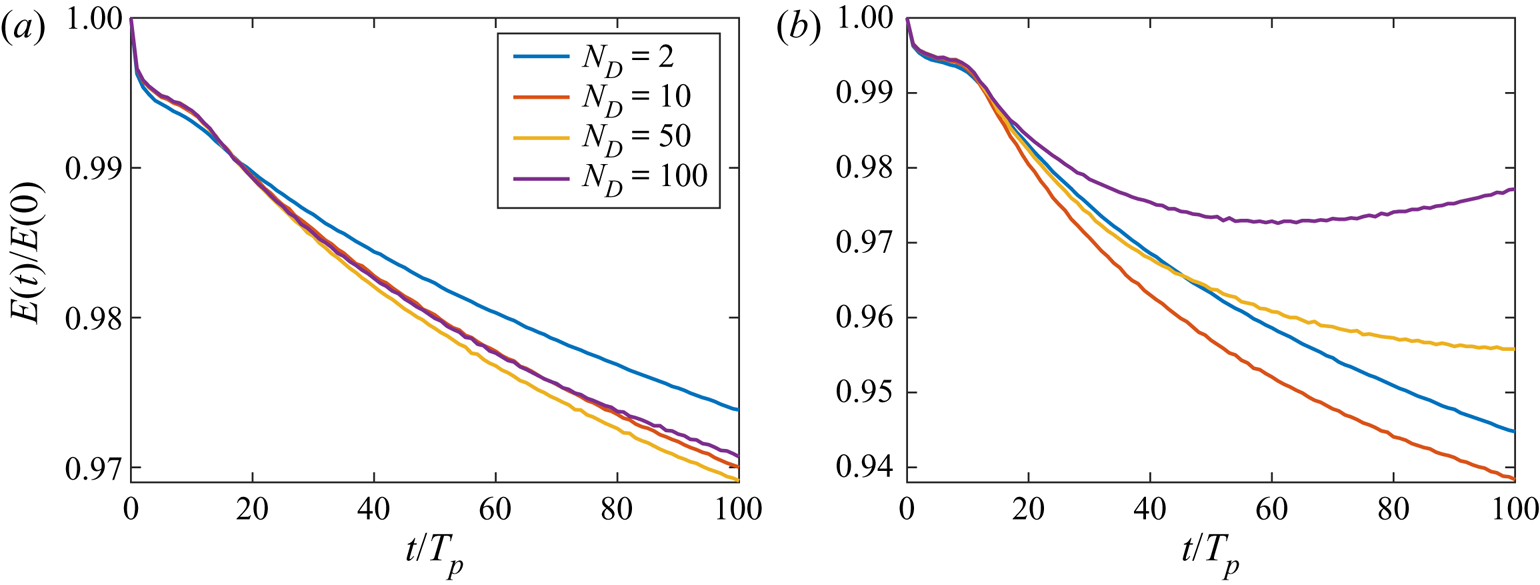
every time step. In an attempt to quantify the effect of the damping, we show the time evolution of the total mechanical energy
 \begin{equation} E = \frac{1}{2} \int_{0}^{L_y} \int_{0}^{L_x} \left( \varPhi_s \frac{\partial \eta}{\partial t} + g \eta^2 \right) \mathrm{d} x \,\mathrm{d} y \end{equation}
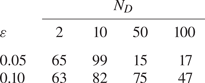
for our simulations in figure 2. The simulations are made with the values 0.05 and 0.10 for the steepness,  $\varepsilon$, the values 2, 10, 50 and 100 for the parameter
 $N_D$ and the computational parameters listed in § 3.5. The results show that the total energy changes by roughly 2.5 %–6 % within the first 100 peak periods, and as such, the change in the total energy is comparable in magnitude to that found by Xiao et al. (Reference Xiao, Liu, Wu and Yue2013).
The total mechanical energy (3.7) as a function of time for wave fields of steepness  $\varepsilon = 0.05$ (a) and
 $\varepsilon = 0.10$ (b) for different values of
 $N_D$. The legend applies to both figures, and it should be noted that the
 $y$-axes have different scales.

3.3. Computation of  $v_z^{(s)}$ given $\eta$ and $\varPhi _s$


To compute  $v_z^{(s)}$ from
 $\eta$ and
 $\varPhi _s$, one must solve the Laplace equation (2.1a) together with the boundary condition (2.1b) and the condition
 $\varPhi |_{z = \eta } = \varPhi _s$. In the present method this is done by dividing the fluid domain into an upper part with
 $z > -b$ and a lower part with
 $z < -b$, where
 $b$ is a positive number such that the level
 $z = -b$ lies below the lowest point of the surface elevation. As has, for example, been shown by Nicholls (Reference Nicholls2011), the Laplace problem in the lower part of the domain can be solved analytically, and the full Laplace problem therefore reduces to the set of equations
 \begin{gather} \frac{\partial^2 \varPhi}{\partial x^2} + \frac{\partial^2 \varPhi}{\partial y^2} + \frac{\partial^2 \varPhi}{\partial z^2} = 0 \quad \text{for }-b < z < \eta, \end{gather}
 \begin{gather}\varPhi |_{z = \eta} = \varPhi_s, \end{gather}
 \begin{gather}\left.\frac{\partial \varPhi}{\partial z}\right|_{z ={-}b} - T[\varPhi |_{z ={-}b}] = 0, \end{gather}
which is a Laplace problem on the upper part of the domain only. Here the operator  $T$ is defined through its action on the function
 $\exp ({\textrm {i} \boldsymbol {k} \cdot \boldsymbol {r}})$, which is
 $T[\exp ({\textrm {i} \boldsymbol {k} \cdot \boldsymbol {r}})] = |\boldsymbol {k}| \exp ({\textrm {i} \boldsymbol {k} \cdot \boldsymbol {r}})$ for all
 $\boldsymbol {k}$, and we note that this is slightly different than the definition given in Klahn et al. (Reference Klahn, Madsen and Fuhrman2021a), since a finite water depth is considered there. To solve the reduced Laplace problem (3.8), the change of coordinates
 $(x, y, z) \mapsto (x, y, s)$ is performed with
 $s$ defined as
 \begin{equation} s(x,y,z) = \frac{2z + b - \eta(x,y)}{b + \eta(x,y)}. \end{equation}
Using the chain rule it follows that the function  $F(x,y,s(x,y,z)) \equiv \varPhi (x,y,z)$ must satisfy the equation
 \begin{align} 0 &= \frac{\partial^2 F}{\partial x^2} + \frac{\partial^2 F}{\partial y^2} + \left( \left( \frac{\partial s}{\partial x}\right)^2 + \left( \frac{\partial s}{\partial y}\right)^2 + \left( \frac{\partial s}{\partial z}\right)^2\right) \frac{\partial^2 F}{\partial s^2} \nonumber\\ &\quad +2 \frac{\partial s}{\partial x} \frac{\partial^2 F}{\partial x \partial s} + 2 \frac{\partial s}{\partial y} \frac{\partial^2 F}{\partial y \partial s} + \left( \frac{\partial^2 s}{\partial x^2} + \frac{\partial^2 s}{\partial y^2} \right) \frac{\partial F}{\partial s}, \end{align}
as well as the boundary conditions
 \begin{gather} F |_{s = 1} = \varPhi_s, \end{gather}
 \begin{gather}\frac{2}{b + \eta} \left.\frac{\partial F}{\partial s}\right|_{s ={-}1} - T[F |_{s ={-}1}] = 0. \end{gather}
Finally,  $F$ is computed numerically in a pseudospectral fashion by seeking the values of
 $F$ at the set of grid points
 \begin{equation} \left\{ (x_{n_x}, y_{n_y}, s_{n_s} )\,|\, 1 \le n_x \le 2N_x,\ 1 \le n_y \le 2N_y\ \text{and}\ 0 \le n_s \le N_s \right\}, \end{equation}
where  $x_{n_x}$ and
 $y_{n_y}$ are given by (3.4) and
 $s_{n_s}$ is the
 $n_s$th point of the Legendre–Gauss–Lobatto quadrature of order
 $N_s$. To that end,
 $F$ is assumed to be of the form
 \begin{equation} F(x,y,s) = \sum_{n_x ={-}N_x}^{N_x-1} \sum_{n_y ={-}N_y}^{N_y-1} \sum_{n_s = 0}^{N_s} \hat{F}_{n_x, n_y, n_s} \exp ( \text{i} \boldsymbol{k}_{n_x, n_y} \cdot \boldsymbol{r} ) \mathcal{L}_{n_s}(s), \end{equation}
where  $\mathcal {L}_{n_s}$ is the
 $n_s$th Lagrange polynomial of degree
 $N_s$, and (3.10) and (3.11) are required to be satisfied identically at the set of grid points (3.12). This procedure yields a system of
 $4N_x N_y (N_s + 1)$ linear equations for the grid point values of
 $F$ which is solved using the iterative method GMRES (Saad & Schultz Reference Saad and Schultz1986) with a preconditioner inspired by the work of Fuhrman & Bingham (Reference Fuhrman and Bingham2004). Once the values of
 $F$ at the grid points have been computed,
 $v_z^{(s)}$ is computed as
 \begin{equation} v_z^{(s)} = \frac{2}{b + \eta} \left.\frac{\partial F}{\partial s} \right|_{s = 1}. \end{equation}
3.4. Computation of depth-integrated quantities
In this section we show how we compute the depth-integrated quantities  $\mathcal {I}_x$,
 $\mathcal {I}_y$,
 $\mathcal {D}_x$ and
 $\mathcal {D}_y$ numerically. As these are all of the same form and therefore can be calculated using the same procedure, we only give a detailed explanation for
 $\mathcal {I}_x$. For notational convenience, we will suppress any dependence on the spatial coordinates
 $\boldsymbol {r}$ and
 $z$ as well as time when these are not strictly necessary.
By the definition (1.4a,b) we have
 \begin{equation} \mathcal{I}_x= \int_{-\infty}^{\eta} a_x \,\mathrm{d} z = \underbrace{\int_{{-}b}^{\eta} a_x \,\mathrm{d} z}_{I_U} + \underbrace{\int_{-\infty}^{{-}b} a_x \,\mathrm{d} z}_{I_L}\equiv I_U + I_L, \end{equation}
where the subscripts ‘ $U$’ and ‘
 $L$’ stand for ‘upper’ and ‘lower’, respectively. To compute the upper integral,
 $I_U$, we replace
 $z$ using the change of coordinates (3.9) and approximate the resulting integral by the same Legendre–Gauss–Lobatto quadrature used to solve the reduced Laplace problem (3.8) for
 $F$. This gives
 \begin{equation} I_U= \int_{{-}b}^{\eta} a_x \,\mathrm{d} z = \frac{b + \eta}{2} \int_{{-}1}^{1} a_x \,\mathrm{d} s \approx \frac{b + \eta}{2} \sum_{n_s = 0}^{N_s} w_{n_s}^{(\text{LGL})} a_x |_{z = z(s_{n_s})}, \end{equation}
in which  $w_{n_s}^{(\text {LGL})}$ and
 $s_{n_s}$ are the
 $n_s$th weight and node of the Legendre–Gauss–Lobatto quadrature, respectively. To compute the lower integral,
 $I_L$, we follow a very similar procedure: we make the change of coordinates
 $z = -l/k_p - b$ and subsequently approximate the resulting integral using a Laguerre quadrature rule with
 $N_l$ points. This gives
 \begin{equation} I_L= \int_{-\infty}^{{-}b} a_x \,\mathrm{d} z = \frac{1}{k_p} \int_{0}^{\infty} a_x \,\mathrm{d} l \approx \frac{1}{k_p} \sum_{n_l = 1}^{N_l} (w_{n_l}^{(\text{L})} \exp(l_{n_l})) a_x |_{z = z(l_{n_l})}, \end{equation}
where  $w_{n_l}^{(\text {L})}$ and
 $l_{n_l}$ are the
 $n_l$th weight and node of the Laguerre quadrature, respectively. It thus only remains for us to explain how we compute
 $a_x$ at the different quadrature points, and to that end, we recall that the fluid acceleration is
 $\boldsymbol {a} = (\partial _t + \boldsymbol {v} \boldsymbol {\cdot } \boldsymbol {\nabla }) \boldsymbol {v}$, where
 $\boldsymbol {\nabla } = (\partial _x, \partial _y, \partial _z)^\textrm {T}$ is the gradient in Cartesian coordinates and
 $\boldsymbol {v} = (v_x, v_y, v_z)^\textrm {T}$ is the fluid velocity given by
 $\boldsymbol {v} = \boldsymbol {\nabla } \varPhi$.
In the upper part of the fluid domain we compute the values of  $a_x$ using a procedure that involves solving the reduced Laplace problem (3.8) for
 $F$ and the corresponding reduced Laplace problem for
 $G(x, y, s(x,y,z)) = \partial _t \varPhi (x,y,z)$ (see, e.g. § 2.2.3 of Klahn, Madsen & Fuhrman Reference Klahn, Madsen and Fuhrman2021b). More specifically, we compute
 $F$ and
 $G$ at the Legendre–Gauss–Lobatto quadrature points using the method described in the previous section, and then compute the acceleration field as
 \begin{equation} \boldsymbol{a} = \tilde{\boldsymbol{\nabla}} G + ( ( \tilde{\boldsymbol{\nabla}} F ) \boldsymbol{\cdot}\tilde{\boldsymbol{\nabla}} ) ( \tilde{\boldsymbol{\nabla}} F ), \end{equation}
where the operator  $\tilde {\boldsymbol {\nabla }}$ is defined as
 $\tilde {\boldsymbol {\nabla }} = \boldsymbol {\nabla } + (\boldsymbol {\nabla } s) \partial _s$ and it is understood that
 $\partial _z F = \partial _z G = 0$. In the lower part of the domain we follow a rather different approach to compute the values of
 $a_x$ at the Laguerre quadrature points. In this approach we first compute the values of
 $\partial _t v_x$,
 $v_x$,
 $\partial _x v_x$, etc. at the quadrature points, before we compute the values of
 $a_x$ as
 \begin{equation} a_x = \frac{\partial v_x}{\partial t}+ v_x \frac{\partial v_x}{\partial x} + v_y \frac{\partial v_x}{\partial y}+ v_z \frac{\partial v_x}{\partial z}. \end{equation}
In order to compute the values of, for example,  $v_x$ at the quadrature points, we utilize the fact that
 $v_x$ must be a solution to the Laplace equation within the fluid domain. This implies that if we write
 \begin{equation} v_x |_{z ={-}b}\equiv \tilde{\boldsymbol{\nabla}} F|_{s ={-}1} = \sum_{n_x ={-}N_x}^{N_x-1} \sum_{n_y ={-}N_y}^{N_y-1} \hat{v}_{n_x, n_y} \exp (\text{i} \boldsymbol{k}_{n_x, n_y} \cdot \boldsymbol{r}), \end{equation}
then  $v_x$ must be given by the expression
 \begin{equation} v_x = \sum_{n_x ={-}N_x}^{N_x-1} \sum_{n_y ={-}N_y}^{N_y-1} \hat{v}_{n_x, n_y} \exp \left( |\boldsymbol{k}_{n_x, n_y}| (z + b) \right) \exp (\text{i} \boldsymbol{k}_{n_x, n_y} \cdot \boldsymbol{r}) \end{equation}
for  $z < - b$. Clearly, we therefore have
 \begin{equation} v_x |_{z = z(l_{n_l})} = \sum_{n_x ={-}N_x}^{N_x-1} \sum_{n_y ={-}N_y}^{N_y-1} \hat{v}_{n_x, n_y} \exp \left( - \frac{|\boldsymbol{k}_{n_x, n_y}|}{k_p} l_{n_l} \right) \exp (\text{i} \boldsymbol{k}_{n_x, n_y} \cdot \boldsymbol{r}), \end{equation}
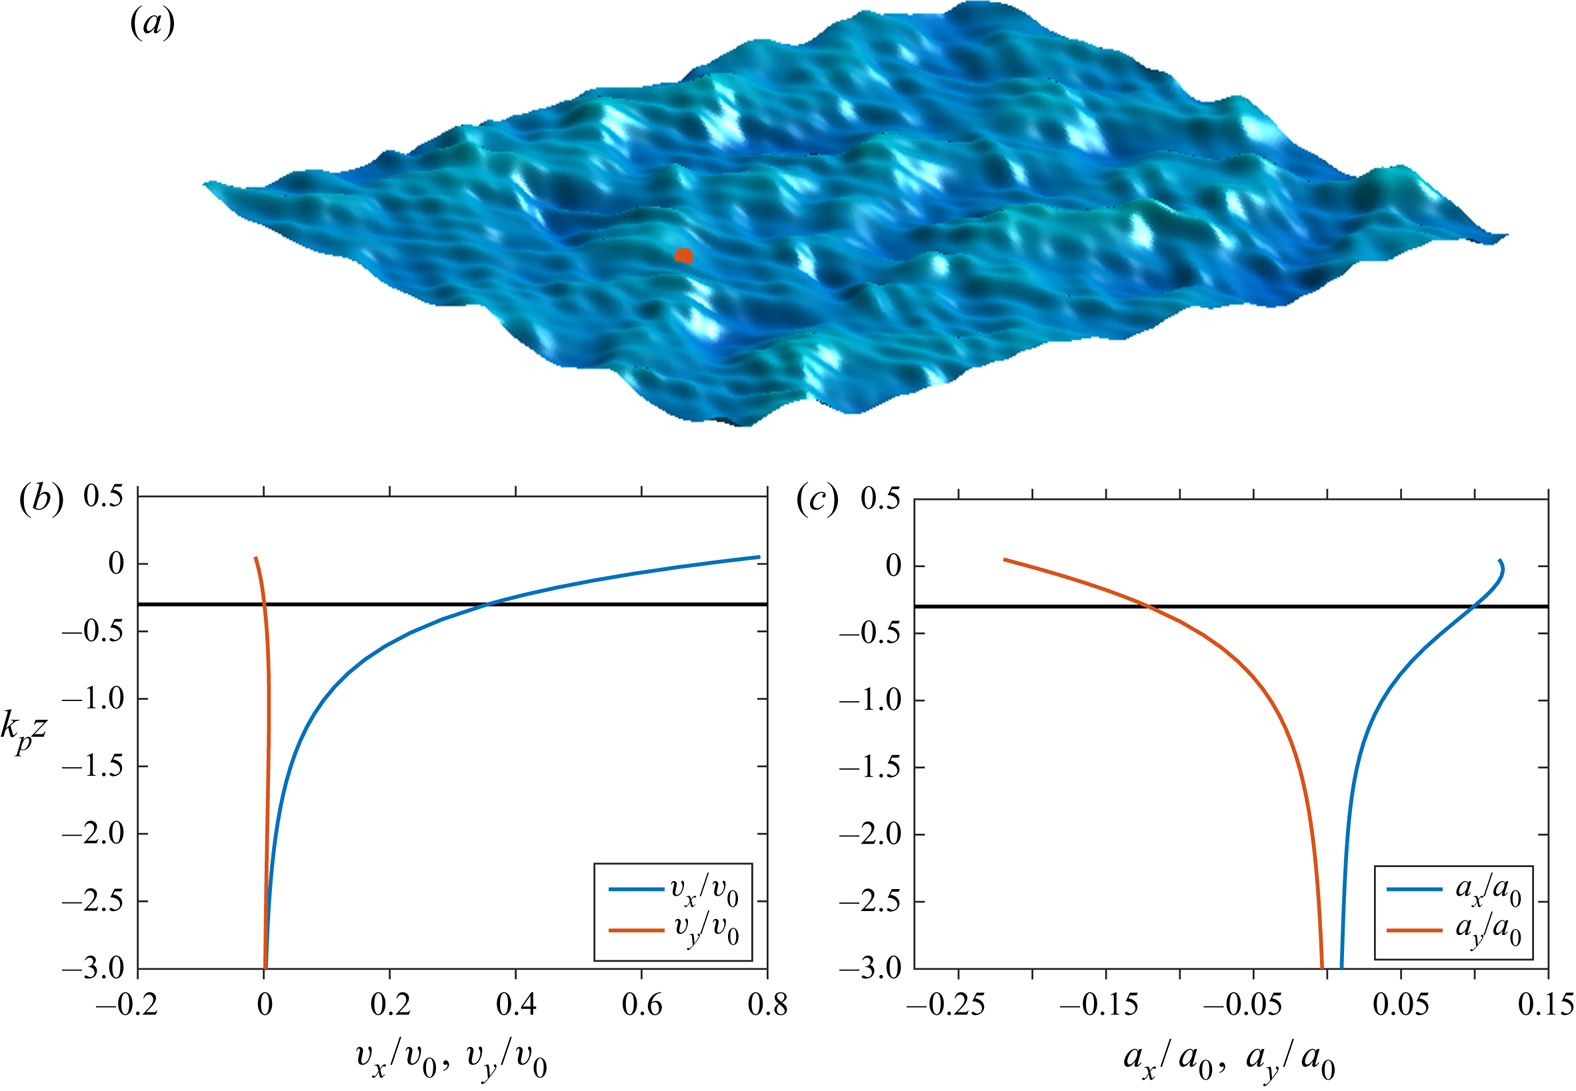
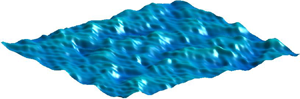
and we note that all other terms entering the right-hand side of (3.19) may be computed in a completely analogous way. For the sake of illustration, we show an example of how the surface elevation may look during the simulations as well as how the horizontal velocities and accelerations behave as a function of depth in figure 3.
(a) An example of the free surface elevation in the region  $\{0 \le x \le 3\lambda _p \ \text {and}\ 0 \le y \le 24 \lambda _p\}$ for the simulations with
 $\varepsilon = 0.10$ and
 $N_D = 50$ at time
 $t = 75 T_p$. The vertical scale is exaggerated two times. (b,c) Profiles of the horizontal velocities and accelerations below the red dot in (a). The black line shows the level
 $z = -b$. The computational parameters used in the simulations are listed in § 3.5, and the velocity and acceleration scales
 $v_0$ and
 $a_0$ are defined in §§ 4.2.1 and 4.1.1, respectively.

Before moving on, we note that one should be careful not to use very large values of  $N_l$ in connection with this algorithm, since it becomes numerically unstable when
 $N_l$ becomes large. In practice we have found that when
 $N_l \approx 30$ in the computations, the results are converged to at least six significant digits which is sufficient for the present purpose. For larger values of
 $N_l$, we have, however, found the results to become increasingly inaccurate.
3.5. Computational parameters
As basic dimensional parameters of the wave fields we choose the gravitational acceleration,  $g = 9.81$ m s
 $^{-2}$, and the peak wavelength,
 $\lambda _p = 275$ m (corresponding to the peak period
 $T_p = 13.3$ s). We characterize a wave field by its steepness
 $\varepsilon$ and its value of
 $N_D$, and in this work we simulate wave fields with
 $\varepsilon = 0.05$ and 0.10, and
 $N_D = 2$, 4, 10 and 100. For all values of
 $N_D$, we discretize both the
 $x$- and
 $y$-directions of all wave fields with
 $2N_x = 2N_y = 1024$ grid points. Since the variation of the wave fields in the
 $x$-direction does not depend much on
 $N_D$, we take
 $L_x = 50 \lambda _p$ in all simulations. The variation of the wave fields in the
 $y$-direction, however, depends strongly on
 $N_D$, and we therefore take
 \begin{equation} L_y= \frac{ \langle
( \partial_x \eta^{(1)} )^2
\rangle^{1/2}}{\langle ( \partial_y \eta^{(1)} )^2 \rangle^{1/2}} L_x= \frac{\left( \int_0^{2{\rm \pi}}
D(\theta) \cos^2(\theta) \,\mathrm{d} \theta \right)^{1/2}}{\left(\int_0^{2{\rm \pi}} D(\theta)
\sin^2(\theta) \,\mathrm{d} \theta\right)^{1/2}} L_x=
( 1 + N_D)^{1/2} L_x,
\end{equation}
where  $\eta ^{(1)}$ is the first-order solution to (2.1) initialized from the JONSWAP spectrum
 $J(\omega , \theta )$ given by (4.4a) below. This choice of
 $L_y$ is made in an attempt not to ‘waste’ degrees of freedom in the
 $y$-direction for large values of
 $N_D$, and we note that although the idea is rather simple, it has to our knowledge not been used in any numerical study of irregular wave fields until now.
At this stage we believe that a few comments on the spatial scales and resolution are appropriate. Since  $N_x$ and
 $N_y$ are finite, it can be shown using the linear dispersion relation for waves in deep water that the frequency spectrum (2.2) with the present choice of
 $N_y$ and
 $L_y$ is effectively cut off at the frequency
 $\omega _c$, say, given by
 \begin{equation} \omega_c = \left( \frac{2 + N_D}{1 + N_D} \right)^{1/4} \left( \frac{N_x}{L_x / \lambda_p} \right)^{1/2} \omega_p. \end{equation}
As such, the cut-off frequency is determined by the directional spreading and half the number of grid points used per peak wavelength in the main direction (recall that the total number of grid points in the main direction is  $2N_x$ rather than
 $N_x$). Since
 $N_x = 512$, slightly more than 20 points are used per peak wavelength, and for the values of
 $N_D$ used in this work,
 $\omega _c$ therefore lies between
 $3.21 \omega _p$ for
 $N_D = 100$ and
 $3.44 \omega _p$ for
 $N_D = 2$. Thus, it should be possible to capture the main features of the nonlinear interactions up to at least third order with the present resolution. It is of course also important that the peak of the initial spectrum is properly resolved. To that end, we note that the choice of
 $L_x$ implies that the frequency resolution in the vicinity of the spectral peak is
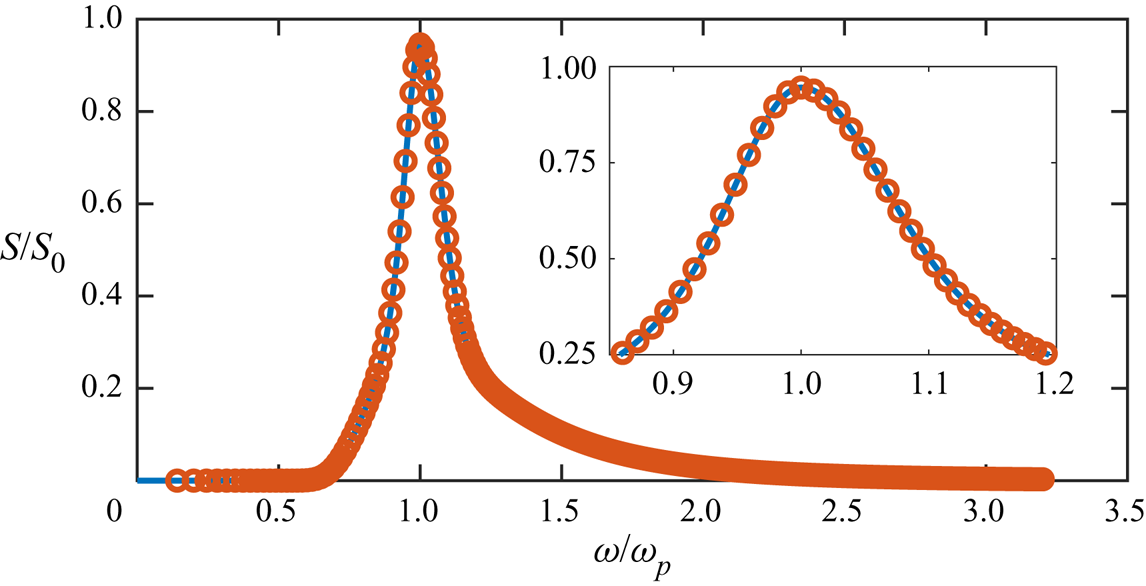
 ${\rm \Delta} \omega \approx 0.01 \omega _p$ for the main direction, and from figure 4, it can be seen that this gives an accurate description of the spectral peak. Since the frequency resolution in all other directions is similar, we are content that the spatial scales and resolution used in this work are adequate for the present purpose.
The frequency spectrum (2.2) (full line) compared with its discretized version when using the discrete frequencies of the main direction (circles). The inset shows the spectrum in the range  $0.9 \lesssim \omega / \omega _p \lesssim 1.2$.

When solving the reduced Laplace problem (3.8), we take  $b = 6 \langle \eta ^2 \rangle ^{1/2} = 3 \varepsilon \lambda _p / ( 2 {\rm \pi})$ such that the dimensionless depth of the computational domain is
 $k_p b = 3 \varepsilon$. This should be compared with the large, finite water depth,
 $h$, needed to simulate wave fields in infinite depth by similar numerical methods which solve the Laplace equation for the entire fluid domain by stretching the vertical coordinate without using the artificial boundary condition (3.8c). These methods need a computational domain with the dimensionless vertical extent
 $k_p h = O(2{\rm \pi} )$ in order to simulate wave fields in infinitely deep water (see the work of Barratt, Bingham & Adcock (Reference Barratt, Bingham and Adcock2020) for an example), and as such, the vertical extent of the domain of the present numerical method is therefore at least an order of magnitude smaller than that needed by similar methods. We resolve the vertical dimension using
 $N_s = 10$ (corresponding to 11 grid points) for all wave fields, and employ the GMRES method with the relative tolerance
 $10^{-6}$. The time integration of the wave fields is carried out for
 $0 \le t \le 100T_p$ with the time step
 ${\rm \Delta} t = T_p/50$, and for each combination of
 $\varepsilon$ and
 $N_D$, we have performed the time integration with 80 different random initial conditions in order to ensure a reasonably low level of statistical noise in the final results. In each of the simulations we ramp up the nonlinear interactions among the Fourier components of the wave fields using the parameters
 $n = 4$ and
 $T_R = 10T_p$.
The numerical method is implemented as a serial Matlab program, and the computational bottleneck of the method is the reduced Laplace equation which is here solved with  $1024 \times 1024 \times 11 \approx 11.5 \times 10^6$ grid points four times per time step. By construction of the preconditioning strategy, the efficiency of the program varies with
 $\varepsilon$ and
 $N_D$, but in all cases the wall-clock time per time step was typically limited from above by about 4 minutes such that the 100 peak periods of simulation were each completed in about two weeks on the high performance computing cluster of the Technical University of Denmark. We note that the simulations have thus cumulatively taken about 25 years of computation time in total.
4. First-order theory for the distributions of $\mathcal {I}_x$, $\mathcal {I}_y$, $\mathcal {D}_x$ and $\mathcal {D}_y$


It goes without saying that reference results are required when evaluating the effect of wave steepness and directionality on the PDFs of the depth-integrated quantities. For that reason, we derive a number of results for these PDFs based on first-order theory in this section, and we emphasize that these results are new. To begin with, we derive approximations for the PDFs of  $\mathcal {I}_x$ and
 $\mathcal {I}_y$ which are valid for arbitrary directional spread. For
 $\mathcal {D}_x$ and
 $\mathcal {D}_y$, the situation is more complicated due to the inherent nonlinearity of these terms; in fact, a derivation of their PDFs valid for arbitrary directional spread has thus far eluded us. We therefore derive a sampling procedure with which the PDFs of
 $\mathcal {D}_x$ and
 $\mathcal {D}_y$ can be approximated to any desired accuracy for arbitrary
 $N_D$. Since a sampling procedure does not provide any qualitative insights, we derive an analytic approximation for the PDF of
 $\mathcal {D}_x$ which formally becomes valid in the limit where the wave field becomes long crested, but turns out to be remarkably accurate even for short-crested wave fields. Although this asymptotic result will never be more accurate than the sampling procedure, it completely explains the role played by
 $N_D$ to first order in
 $\varepsilon$. We note that an asymptotic expression for the PDF of
 $\mathcal {D}_y$ can in principle be derived using a similar procedure, but based on numerical evaluations we have found that the final result is rather inaccurate unless
 $N_D \gtrsim 100$, and we therefore do not pursue the derivation of it in this work. To validate the analytical expressions and the sampling method, we compare them with results from simulations with
 $\varepsilon = 10^{-6}$, for which first-order theory should apply. We note that these simulations only consist of a single time step, since the statistical properties of a small-amplitude wave field do not depend on time.
In an attempt to streamline the presentation as much as possible, we have chosen to use the moment generating function as the basis for our derivations. For a vector of  $N$ possibly correlated random variables,
 $\boldsymbol {X}$, say, the moment generating function is defined as
 \begin{equation} M_{\boldsymbol{X}}(\boldsymbol{t}) = \langle \exp ( \boldsymbol{t}^\textrm{T} \boldsymbol{X}) \rangle, \end{equation}
where  $\boldsymbol {t}$ is a vector of length
 $N$ and the angle brackets mean average over random variables. In the present situation, the moment generating function turns out to be useful, since it provides the integral equation
 \begin{equation} M_{\boldsymbol{X}}(\boldsymbol{t})= \int p \left( \boldsymbol{X} \right) \exp(\boldsymbol{t}^\textrm{T} \boldsymbol{X})\,\mathrm{d} \boldsymbol{X} \end{equation}
for the PDF of  $\boldsymbol {X}$. Here the integration runs over the support of
 $\boldsymbol {X}$, and the equation may in the cases needed here be inverted for
 $p(\boldsymbol {X})$ using the inverse Fourier and Laplace transforms. In fact, we note that if
 $M_{\boldsymbol {X}}(\boldsymbol {t}) = \exp (\frac {1}{2} \boldsymbol {t}^\textrm {T} \boldsymbol \varSigma \boldsymbol {t})$, where
 $\boldsymbol \varSigma$ is a matrix of dimension
 $N \times N$, then it follows from an application of the multidimensional Fourier transform that
 $\boldsymbol {X}$ is normally distributed with zero mean and covariance matrix
 $\boldsymbol \varSigma$. In other words, the PDF of
 $\boldsymbol {X}$ is, in that case, given by the expression
 $p(\boldsymbol {X}) = ( (2{\rm \pi} )^N \text {det}(\boldsymbol \varSigma ))^{-1/2} \exp ( -\frac {1}{2} \boldsymbol {X}^\textrm {T} \boldsymbol \varSigma ^{-1} \boldsymbol {X} )$. To calculate the moment generating function, we will in several cases utilize its power series form. This form of
 $M_{\boldsymbol {X}}(\boldsymbol {t})$ reads
 \begin{equation} M_{\boldsymbol{X}}(\boldsymbol{t})=\sum_{p = 0}^{\infty} \frac{1}{p!} \langle (\boldsymbol{t}^\textrm{T} \boldsymbol{X})^p \rangle, \end{equation}
and is readily derived by Taylor expanding the exponential function in (4.1) and interchanging the order of averaging and summation.
Before presenting the derivations, we briefly recall some properties of the solution of (2.1) to first order in  $\varepsilon$ that we will use repeatedly in the following. First of all, it is well known that when the solution is sought in terms of a classical Stokes-type perturbation series, the first-order solution satisfying the prescribed initial condition may be expressed as
 \begin{equation} \eta^{(1)} = \sum_{n} \hat{a}_{n} \cos \left( \boldsymbol{k}_{n} \cdot \boldsymbol{r} - \omega_{n} t + \phi_{n} \right), \end{equation}
 \begin{equation}\varPhi^{(1)} = \sum_{n} \frac{\hat{a}_{n} \omega_{n}}{|\boldsymbol{k}_{n}|} \exp \left( |\boldsymbol{k}_{n}| z \right) \sin \left( \boldsymbol{k}_{n} \cdot \boldsymbol{r} - \omega_{n} t + \phi_{n} \right). \end{equation}
Here the superscript  $(1)$ indicates that the solution is accurate to first order in
 $\varepsilon$,
 $n$ runs over a set of indices which we will discuss shortly,
 $\boldsymbol {k}_{n}$ is the
 $n$th wavenumber vector and
 $\omega _{n} = ( g |\boldsymbol {k}_n| )^{1/2}$. The phases
 $\phi _1$,
 $\phi _2,\ldots$ are independent random numbers which are uniformly distributed on the interval
 $[0, 2{\rm \pi} ]$, and the
 $n$th coefficient
 $\hat {a}_n$ is chosen as the positive solution to the equation
 \begin{equation} \tfrac{1}{2} \hat{a}_{n}^2 = J(\omega_n, \theta_n) {\rm \Delta} \omega_n {\rm \Delta} \theta_n, \end{equation}
where  ${\rm \Delta} \omega _n = (\omega _{n+1} - \omega _{n-1})/2$ and
 ${\rm \Delta} \theta _n = (\theta _{n+1} - \theta _{n-1})/2$. We note that since wave-wave interactions are absent to first order in
 $\varepsilon$ and the initial state is homogeneous in space, the statistical properties of the system are independent of
 $\boldsymbol {r}$ and
 $t$. We will therefore take
 $\boldsymbol {r} = \boldsymbol {0}$ and
 $t = 0$ throughout the derivations without loss of generality. In addition, we note that it follows from (4.5) that for any reasonably behaved function
 $f(\omega , \theta )$, the approximation
 \begin{equation} \sum_{n} \frac{1}{2} \hat{a}_n^2\, f(\omega_n, \theta_n)\approx \int_0^\infty \int_0^{2{\rm \pi}} f(\omega,\theta) J(\omega, \theta) \,\mathrm{d} \theta \,\mathrm{d} \omega \end{equation}
can be made arbitrarily accurate by choosing the set of indices, over which  $n$ runs, appropriately. As such, we will in the following assume that the set of indices is such that the left-hand side and right-hand side of (4.6) are in fact identical.
4.1. Probability density functions of $\mathcal {I}_x$ and $\mathcal {I}_y$


4.1.1. The PDF of $\mathcal {I}_x$

By the definition (1.4a,b), the depth-integrated inertia term in the  $x$-direction is given by the expression
 \begin{equation} \mathcal{I}_x = \int_{-\infty}^{\eta} a_x \,\mathrm{d} z. \end{equation}
To first order in  $\varepsilon$, this expression reduces to
 \begin{equation} \mathcal{I}_x = \int_{-\infty}^{0} a_x^{(1)} \,\mathrm{d} z, \end{equation}
where  $a_x^{(1)} \equiv \partial _t \partial _x \varPhi ^{(1)}$ is the first-order fluid acceleration in the
 $x$-direction. Using (4.4b) gives
 \begin{equation} a_x^{(1)} = \sum_{n} \hat{a}_n \omega_n^2 \cos(\theta_n) \exp \left( |\boldsymbol{k}_{n}| z \right) \sin(\phi_n), \end{equation}
and, therefore, to first order in  $\varepsilon$, we have
 \begin{equation} \mathcal{I}_x = g \sum_{n} \hat{a}_n \cos(\theta_n) \sin(\phi_n), \end{equation}
which follows from (4.8) and the fact that  $|\boldsymbol {k}_n | = \omega _n^2/g$. Using this expression for
 $\mathcal {I}_x$, we now calculate the power series form of its moment generating function by directly calculating its moments. For all non-negative integers
 $p$, it holds that
 \begin{align} \langle
\mathcal{I}_x^{2p+1} \rangle &= g^{2p+1} \sum_{n_1}
\cdots \sum_{n_{2p+1}} (( \hat{a}_{n_1} \cdots
\hat{a}_{n_{2p+1}} )\nonumber\\ &\quad
\times ( \cos(\theta_{n_{1}}) \cdots
\cos(\theta_{n_{2p+1}}) ) \langle \sin(\phi_{n_1})
\cdots \sin(\phi_{n_{2p+1}}) \rangle ) \nonumber\\ &=
0, \end{align}
since by definition of the phases the average of a product of an odd number of sine functions is zero. Thus, all odd moments vanish identically. For the even moments, we find that
 \begin{align} \langle
\mathcal{I}_x^{2p} \rangle &= g^{2p} \sum_{n_1} \cdots
\sum_{n_{2p}} (( \hat{a}_{n_1} \cdots
\hat{a}_{n_{2p}} )\nonumber\\ &\quad
\times ( \cos(\theta_{n_{1}}) \cdots
\cos(\theta_{n_{2p}}) ) \langle \sin(\phi_{n_1})
\cdots \sin(\phi_{n_{2p}}) \rangle ),
\end{align}
and this is zero unless the phases of the sine functions have the same indices in groups of 2, 4, 6, etc. The contributions from the groups larger than 2, however, become negligible when the set of indices is chosen such that the sum-to-integral-conversion rule (4.6) applies (see, e.g. the remark by Longuet-Higgins (Reference Longuet-Higgins1963) immediately after his (2.3)). For that reason, we find that
 \begin{equation} \langle \mathcal{I}_x^{2p} \rangle= \frac{(2p)!}{2^p p!} \left( g^2 \sum_{n} \sum_{m} \hat{a}_n \hat{a}_m \cos(\theta_n) \cos(\theta_m) \langle \sin(\phi_n) \sin(\phi_m) \rangle\right)^{p}, \end{equation}
where the numerical factor in front of the parenthesis is the number of unique pairs that can be chosen from a set of  $2p$ numbers. If we now utilize the fact that
 $\langle \sin (\phi _n) \sin (\phi _m) \rangle = \frac {1}{2} \delta _{n,m}$, where
 $\delta _{n,m}$ is the Kronecker delta, we find that
 \begin{equation} \langle \mathcal{I}_x^{2p} \rangle= \frac{(2p)!}{2^p p!} \left( g^2 \sum_{n} \frac{1}{2} \hat{a}_n^2 \cos^2(\theta_n)\right)^{p}. \end{equation}
Using (4.6) as well as the definition of  $\varepsilon$, it may be shown that
 \begin{equation} g^2 \sum_{n} \frac{1}{2} \hat{a}_n^2 \cos^2(\theta_n) = g^2 \int_{0}^{\infty} S(\omega) \,\mathrm{d} \omega \int_{0}^{2{\rm \pi}} D(\theta) \cos^2(\theta) \,\mathrm{d} \theta = \frac{1}{4} \frac{1 + N_D}{2 + N_D} \left(\frac{a_0}{k_p} \right)^2, \end{equation}
where  $a_0 = \varepsilon g$, and clearly this implies that the even moments of
 $\mathcal {I}_x$ are
 \begin{equation} \langle \mathcal{I}_x^{2p} \rangle = \frac{(2p)!}{2^p p!}\left(\frac{1}{4} \frac{1 + N_D}{2 + N_D} \right)^{p} \left(\frac{a_0}{k_p} \right)^{2p}. \end{equation}
Using the one-dimensional analogue of (4.3) and a few straightforward algebraic manipulations in combination with (4.11) and (4.16) now shows that the moment generating function of  $\mathcal {I}_x$ is
 \begin{align} M_{ \mathcal{I}_x}(t)=\sum_{p = 0}^{\infty} \frac{1}{p!} \left( \frac{1}{2} \left( \frac{a_0 t}{k_p} \right)^2 \left( \frac{1}{4} \frac{1 + N_D}{2 + N_D} \right) \right)^{p}= \exp \left( \frac{1}{2} \left( \frac{a_0 t}{k_p} \right)^2 \left( \frac{1}{4} \frac{1 + N_D}{2 + N_D} \right) \right), \end{align}
where the second equality follows from the fact that the infinite series is simply the Taylor expansion of an exponential function. From the remark given immediately after (4.2), it now follows that  $\mathcal {I}_x/(a_0/k_p)$ is normally distributed with zero mean and variance
 $(1+N_D)/( 4(2+N_D) )$, and its PDF therefore reads
 \begin{equation} p \left( \frac{\mathcal{I}_x}{a_0/k_p} \right) = \left( \frac{2}{\rm \pi} \frac{2 + N_D}{1 + N_D} \right)^{1/2} \exp \left( - \frac{2(2 + N_D)}{1 + N_D} \left( \frac{\mathcal{I}_x}{a_0/k_p} \right)^2 \right). \end{equation}
Combining this result with the fact that the fraction  $(2+N_D)/(1+N_D)$ decreases with
 $N_D$, we conclude that the probability of finding a value of
 $\mathcal {I}_x/(a_0/k_p)$ with large magnitude increases with the parameter
 $N_D$. We note that this is in line with what one would expect, as the wave motion becomes increasingly concentrated around the
 $x$-direction when
 $N_D$ becomes large.
4.1.2. The PDF of $\mathcal {I}_y$

To first order in  $\varepsilon$, the PDF of
 $\mathcal {I}_y$ may be calculated using the exact same steps as used above. In fact, the only difference is that
 $a_x^{(1)}$ should be replaced by
 \begin{equation} a_y^{(1)}= \sum_{n} \hat{a}_n \omega_n^2 \sin(\theta_n) \exp \left( |\boldsymbol{k}_{n}| z \right) \sin(\phi_n) \end{equation}
in (4.8). Since the expression for  $a_y^{(1)}$ is identical to that of
 $a_x^{(1)}$ except that it contains a sine function instead of a cosine function, the PDF of
 $\mathcal {I}_y/(a_0/k_p)$ can be obtained directly from (4.18) simply by replacing the fraction
 $(1+N_D)/(2+N_D)$ with
 \begin{equation} \int_{0}^{2{\rm \pi}} D(\theta) \sin^2(\theta) \,\mathrm{d} \theta = \frac{1}{2 + N_D}. \end{equation}
The final result for the PDF of  $\mathcal {I}_y/(a_0 / k_p)$ therefore reads
 \begin{equation} p \left( \frac{\mathcal{I}_y}{a_0/k_p} \right) = \left( \frac{2}{\rm \pi} (2 + N_D) \right)^{1/2} \exp \left( - 2(2 + N_D) \left( \frac{\mathcal{I}_y}{a_0/k_p} \right)^2 \right). \end{equation}
Clearly, the tails of this PDF will decay more rapidly to 0 as  $N_D$ increases, and we therefore conclude that large values of
 $\mathcal {I}_y$ become less probable when
 $N_D$ becomes large. We note that this is in line with what one would expect for the same reason as given above.
4.1.3. Comparison of (4.18) and (4.21) with simulations of wave fields for negligible $\varepsilon$

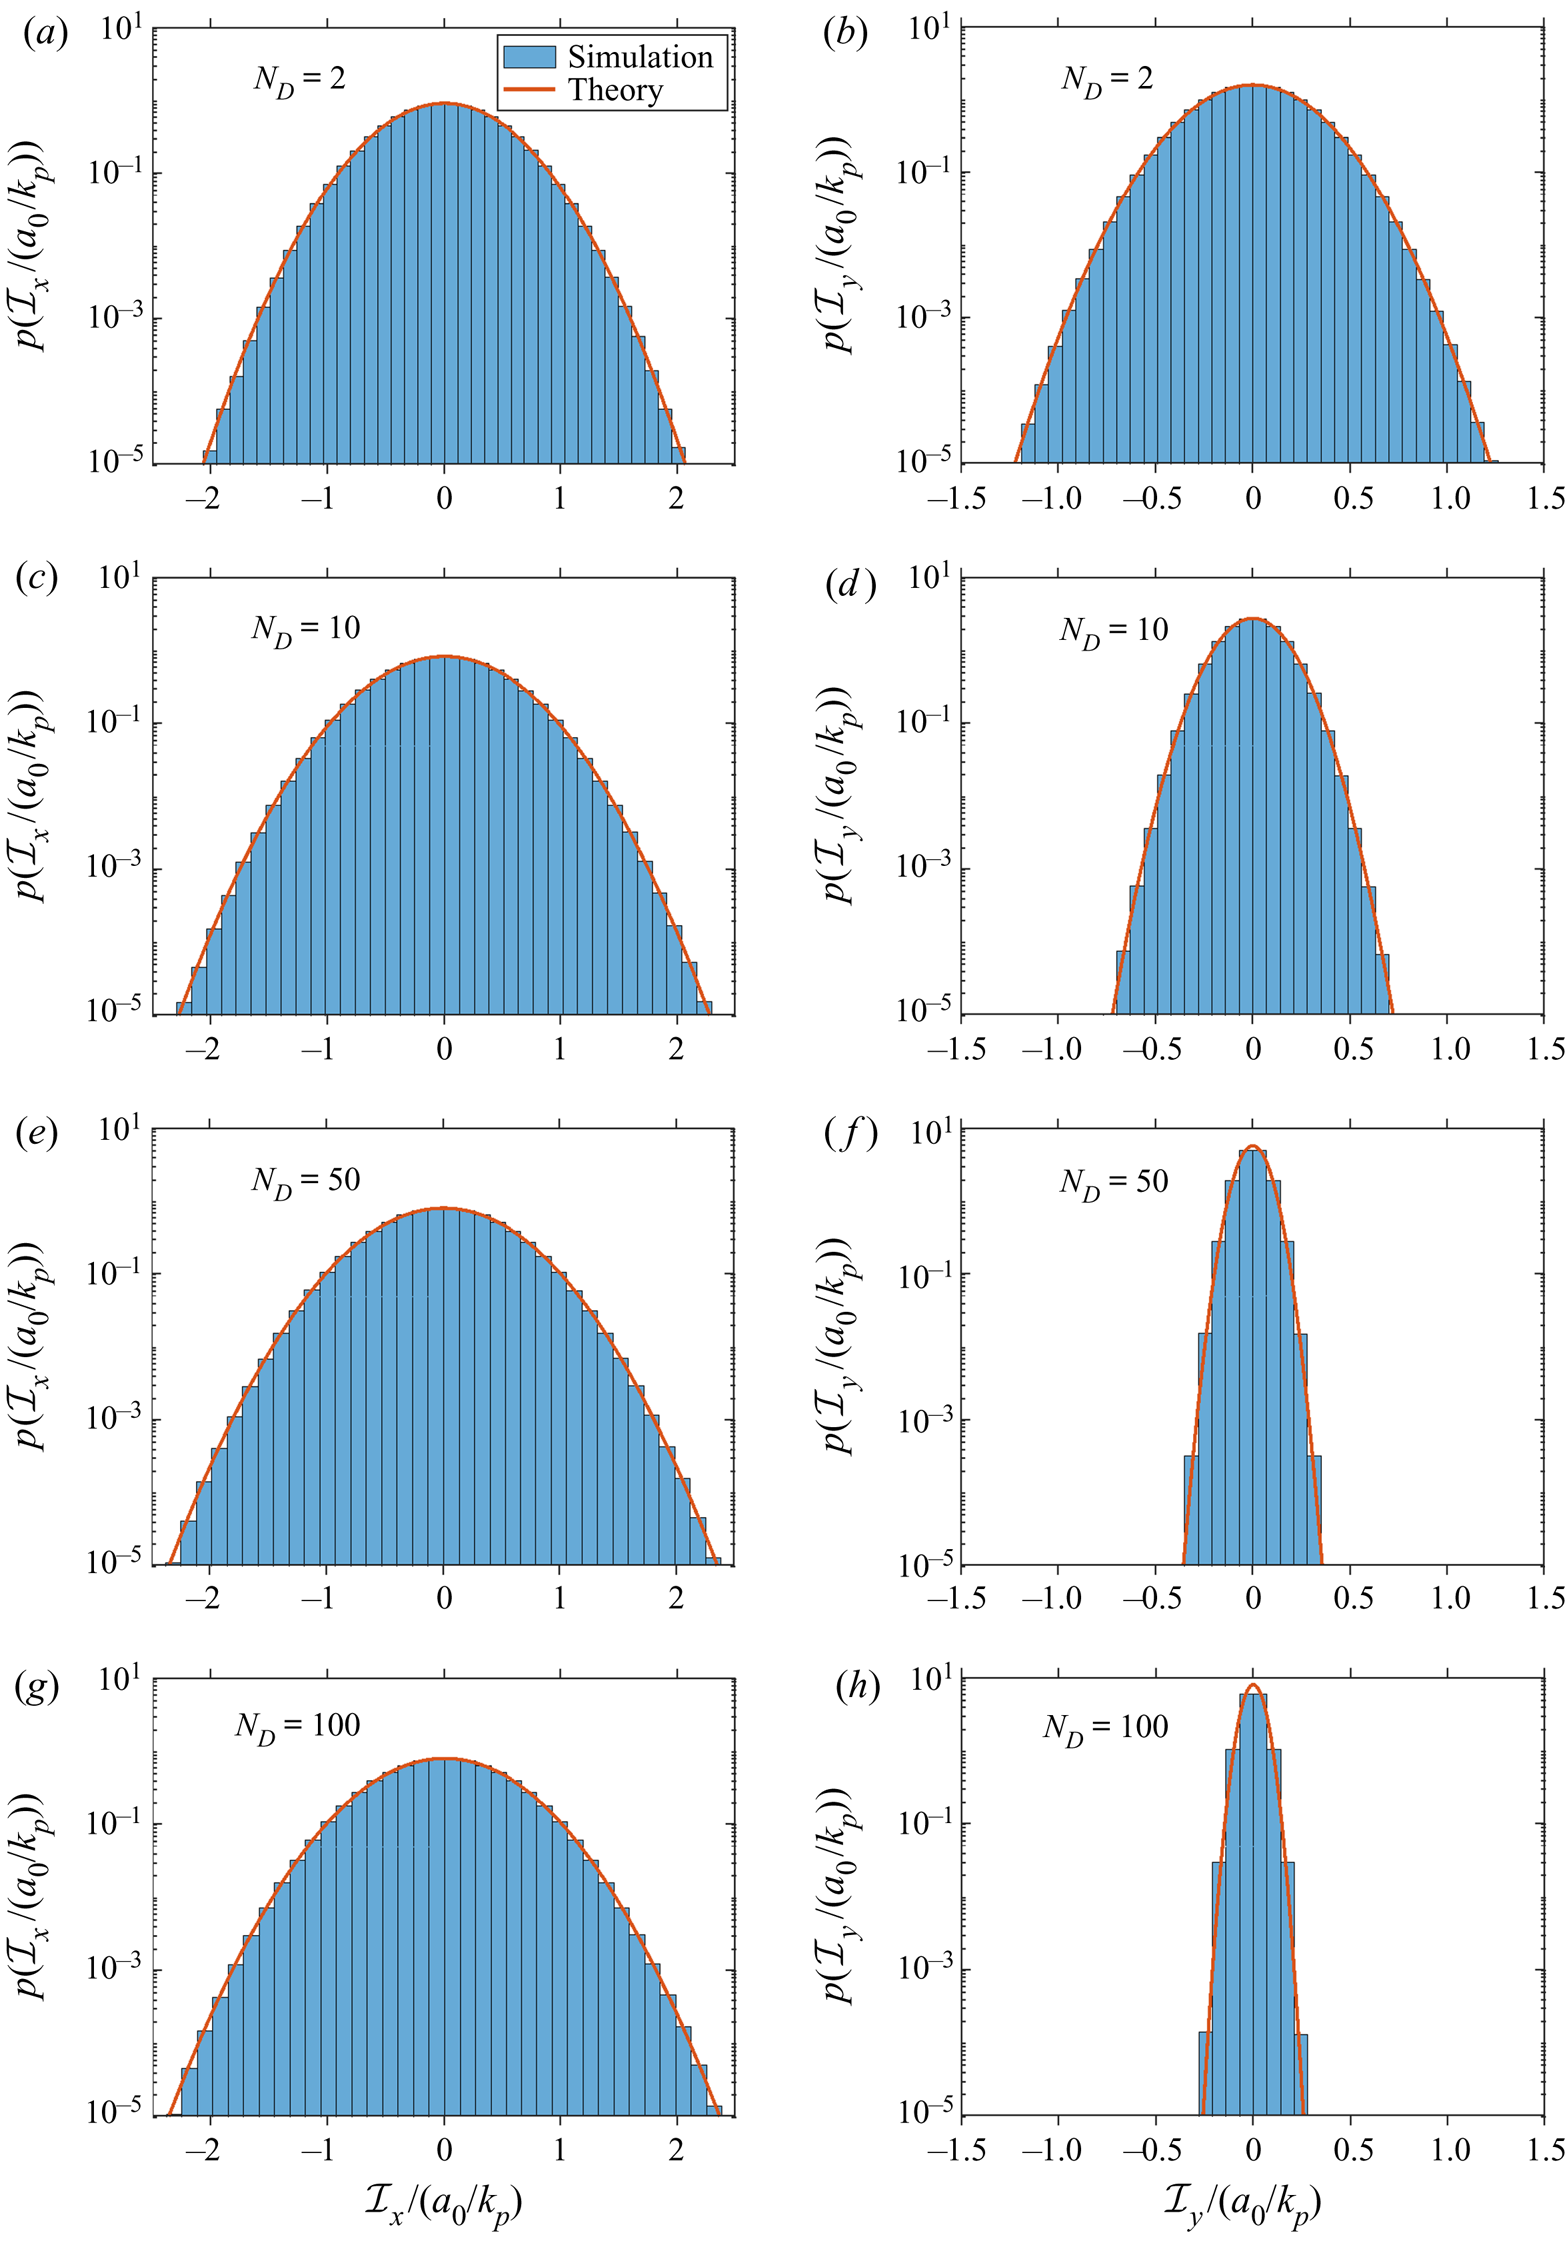
We conclude the treatment of the depth-integrated inertia terms by validating the expressions (4.18) and (4.21) against the results of simulations of wave fields with  $\varepsilon = 10^{-6}$. In figure 5 a comparison between the simulated and analytical results are shown for
 $N_D = 2$, 10, 50 and 100, and from it we conclude that the derived expressions for
 $p(\mathcal {I}_x/(a_0/k_p))$ and
 $p( \mathcal {I}_y/(a_0/k_p))$ match the simulation results very well. In this connection it is interesting to note that while the PDF of
 $\mathcal {I}_x/(a_0/k_p)$ only widens slightly when
 $N_D$ is increased from 2 to 100, the PDF of
 $\mathcal {I}_y/(a_0/k_p)$ narrows significantly. As such, the statistical properties of
 $\mathcal {I}_y/(a_0/k_p)$ seem to be much more sensitive to changes in the directional spread of the wave field than the statistical properties of
 $\mathcal {I}_x/(a_0/k_p)$.


4.2. Probability density functions of $\mathcal {D}_x$ and $\mathcal {D}_y$


4.2.1. A method for sampling the PDFs of $\mathcal {D}_x$ and $\mathcal {D}_y$


In the following we describe a method based on first-order theory with which random realizations of  $\mathcal {D}_x$ and
 $\mathcal {D}_y$ can be sampled. Obviously, by binning these samples and normalizing the bin values, the PDFs of the depth-integrated drag terms can be estimated. Since the method is essentially the same for
 $\mathcal {D}_y$ as for
 $\mathcal {D}_x$, we only describe it for the latter.
The starting point of the method is the definition of  $\mathcal {D}_x$ (see (1.4a,b)), i.e.
 \begin{equation} \mathcal{D}_x = \int_{-\infty}^{\eta} v_x ( v_x^2 + v_y^2 )^{1/2}\,\mathrm{d} z, \end{equation}
which, when approximated to lowest order in  $\varepsilon$, becomes
 \begin{equation} \mathcal{D}_x = \int_{-\infty}^{0} v_x^{(1)} ( v_x^{(1)^2} + v_y^{(1)^2} )^{1/2}\,\mathrm{d} z. \end{equation}
Here  $v_x^{(1)} \equiv \partial _x \varPhi ^{(1)}$ and
 $v_y^{(1)} \equiv \partial _y \varPhi ^{(1)}$ are the first-order fluid velocities in the
 $x$- and
 $y$-directions, respectively, and using (4.4b) it is straightforward to show that
 \begin{gather} v_x^{(1)} = \sum_{n} \hat{a}_n \omega_n \cos(\theta_n) \exp \left( |\boldsymbol{k}_{n}| z \right) \cos(\phi_n), \end{gather}
 \begin{gather}v_y^{(1)} = \sum_{n} \hat{a}_n \omega_n \sin(\theta_n) \exp \left(|\boldsymbol{k}_{n}| z \right) \cos(\phi_n). \end{gather}
To proceed from here we perform a change of coordinates, setting  $z = -\alpha /k_p$ in (4.23), and approximate the resulting integral using a Laguerre quadrature rule with
 $N_\alpha$ points. This gives
 \begin{align} \mathcal{D}_x &= \frac{1}{k_p} \int_{0}^{\infty} v_x^{(1)} \left( v_x^{(1)^2} + v_y^{(1)^2} \right)^{1/2} \mathrm{d} \alpha \nonumber\\ &\approx \frac{1}{k_p} \sum_{n_{\alpha} = 1}^{N_\alpha} W_{n_\alpha} \left.\left( v_x^{(1)} \left( v_x^{(1)^2} + v_y^{(1)^2} \right)^{1/2} \right)\right|_{z = z(\alpha_{n_\alpha})}, \end{align}
where  $W_{n_\alpha } = w_{n_\alpha } \exp (\alpha _{n_\alpha })$, and
 $\alpha _{n_\alpha }$ and
 $w_{n_\alpha }$ are the
 $n_\alpha$th quadrature point and weight of the Laguerre quadrature rule, respectively. We note that since
 $v_x^{(1)}$ and
 $v_y^{(1)}$ are both solutions to the Laplace equation, they depend analytically on
 $z$ and the quadrature therefore converges to the exact result at an exponential rate. Thus, for all practical purposes, the finite sum may be considered to be exact as long as
 $N_\alpha$ is moderately large. As such, we conclude that a realization of
 $\mathcal {D}_x$ may be computed from a realization of the vector
 \begin{equation} \boldsymbol{v} = \begin{bmatrix} v_x^{(1)} |_{z = z(\alpha_1)}, & \ldots, & v_x^{(1)} |_{z = z(\alpha_{N_\alpha})}, & v_y^{(1)} |_{z = z(\alpha_1)}, & \dots, & v_y^{(1)} |_{z = z(\alpha_{N_\alpha})} \end{bmatrix}^\textrm{T}, \end{equation}
and to complete the description of the sampling method we therefore simply need to derive the PDF of  $\boldsymbol {v}$. From (4.3), it is clear that the moment generating function of
 $\boldsymbol {v}$ can be evaluated from the term
 $\langle (\boldsymbol {t}^\textrm {T} \boldsymbol {v} )^p \rangle$, for which we therefore seek an expression. Denoting the
 $n$th entry of
 $\boldsymbol {v}$ by
 $v_n$ and the
 $n$th entry of
 $\boldsymbol {t}$ by
 $t_n$, we have
 \begin{equation} \langle ( \boldsymbol{t}^\textrm{T} \boldsymbol{v} )^p \rangle = \sum_{n_1 = 1}^{2N_\alpha} \cdots \sum_{n_p = 1}^{2N_\alpha} \left( t_{n_1} \cdots t_{n_p} \right) \langle v_{n_1} \cdots v_{n_p} \rangle, \end{equation}
and from this result we immediately conclude that the term is zero whenever  $p$ is odd, since the average in that case will be over an odd number of cosine functions, cf. (4.24). Substituting
 $p$ with
 $2p$, we find after a few calculations that the even terms are
 \begin{align} \langle ( \boldsymbol{t}^\textrm{T} \boldsymbol{v} )^{2p} \rangle &= \sum_{n_1 = 1}^{2N_\alpha} \cdots \sum_{n_{2p} = 1}^{2N_\alpha}(t_{n_1} \cdots t_{n_{2p}}) \langle v_{n_1} \cdots v_{n_{2p}}\rangle\nonumber\\ &= \frac{(2p)!}{2^p p!} \left( \sum_{n = 1}^{2N_\alpha} \sum_{m = 1}^{2N_\alpha} t_n t_m \langle v_n v_m \rangle \right)^{p}. \end{align}
If we now define the matrix  $\boldsymbol \varSigma _v$ such that its
 $(n,m)$th entry is
 $\langle v_n v_m \rangle$, the results for the even and odd terms imply that the moment generating function of
 $\boldsymbol {v}$ is
 \begin{equation} M_{\boldsymbol{v}}(\boldsymbol{t}) = \sum_{p = 0}^{\infty} \frac{1}{(2p)!} \langle \left( \boldsymbol{t}^\textrm{T} \boldsymbol{v} \right)^{2p} \rangle = \sum_{p = 0}^{\infty} \frac{1}{p!} \left( \frac{1}{2} \boldsymbol{t}^\textrm{T} \boldsymbol\varSigma_v \boldsymbol{t} \right)^p = \exp \left( \frac{1}{2} \boldsymbol{t}^\textrm{T} \boldsymbol\varSigma_v \boldsymbol{t} \right), \end{equation}
and when combined with the remark given immediately after (4.2), this result implies that  $\boldsymbol {v}$ follows a multivariate normal distribution with covariance matrix
 $\boldsymbol \varSigma _v$. We note that samples of such a distribution may nowadays be generated efficiently by a wide variety of software packages, and to complete the description of the sampling method it therefore suffices to construct the covariance matrix of
 $\boldsymbol {v}$. For arbitrary
 $n$ and
 $m$, it may be shown that
 $\langle v_x^{(1)} |_{z = z(\alpha _n)} v_y^{(1)} |_{z = z(\alpha _m)} \rangle = 0$, and as a consequence, the covariance matrix simplifies to
 \begin{equation} \boldsymbol\varSigma_v =\begin{bmatrix} \boldsymbol\varSigma_{v_x} & \boldsymbol{0} \\ \boldsymbol{0} & \boldsymbol\varSigma_{v_y} \end{bmatrix}. \end{equation}
Here  $\boldsymbol \varSigma _{v_x} \equiv \langle \boldsymbol {v}_x \boldsymbol {v}_x^\textrm {T} \rangle$ and
 $\boldsymbol \varSigma _{v_y} \equiv \langle \boldsymbol {v}_y \boldsymbol {v}_y^\textrm {T} \rangle$ are the covariance matrices of the vectors
 \begin{gather} \boldsymbol{v}_x = \begin{bmatrix} v_x^{(1)} |_{z = z(\alpha_1)}, & \ldots, & v_x^{(1)} |_{z = z(\alpha_{N_\alpha})} \end{bmatrix}, \end{gather}
 \begin{gather}\boldsymbol{v}_y = \begin{bmatrix} v_y^{(1)} |_{z = z(\alpha_1)}, & \ldots, & v_y^{(1)} |_{z = z(\alpha_{N_\alpha})} \end{bmatrix}. \end{gather}
Using (4.6) these matrices may be shown to be given by the expressions
 \begin{equation} \boldsymbol\varSigma_{v_x} = v_0^2 \frac{1+N_D}{2+N_D} \boldsymbol\varSigma,\quad \text{and}\quad \boldsymbol\varSigma_{v_y} = v_0^2 \frac{1}{2+N_D} \boldsymbol\varSigma, \end{equation}
where  $v_0 \equiv \varepsilon (g/k_p)^{1/2}$ and the matrix
 $\boldsymbol \varSigma$ is defined such that its
 $(n,m)$th entry is
 \begin{equation} \boldsymbol\varSigma_{n,m}= \frac{\displaystyle \int_{0}^{\infty} \exp \left( - x^2(\alpha_n + \alpha_m) \right) x^{{-}3} \exp \left( - \frac{5}{4} x^{{-}4} \right) \gamma^{\exp ( - ({(x - 1)^2}/{2\sigma^2}))}\,\mathrm{d} x}{ \displaystyle 4 \int_{0}^{\infty} x^{{-}5} \exp \left( - \frac{5}{4} x^{{-}4} \right) \gamma^{\exp ( - ({(x - 1)^2}/{2\sigma^2}))}\,\mathrm{d} x}, \end{equation}
in which  $\gamma$ and
 $\sigma$ are parameters of the frequency spectrum (2.2). This concludes the description of the sampling method.
4.2.2. An asymptotic result for the PDF of $\mathcal {D}_x$

We now derive an analytical expression for the PDF of  $\mathcal {D}_x$, and because the derivation is somewhat more complicated than those presented above, we divide it into three steps. In the first step, the PDF of
 $\mathcal {D}_x$ is related to that of
 $| \mathcal {D}_x |$, and the latter is approximated by a finite sum. In the second step, the finite sum is rewritten as a linear combination of independent random variables, from which the moment generating function is calculated. Finally, in the third step, this function is inverted using the inverse Laplace transform.
Our derivation starts from (4.23), which we rewrite as
 \begin{equation} \mathcal{D}_x = \int_{-\infty}^{0} v_x^{(1)} | v_x^{(1)} | \left( 1 + \left( \frac{v_y^{(1)}}{v_x^{(1)}}\right)^2 \right)^{1/2} \mathrm{d} z. \end{equation}
From (4.32a,b), it follows that at any fixed depth we have  $( v_y^{(1)}/v_x^{(1)} )^2 = O( (1+N_D)^{-1} )$ in a statistical sense, and neglecting the square root factor of the integrand thus introduces an error which on average is proportional to
 $(1+N_D)^{-1}$. For long-crested wave fields, for which
 $N_D$ is large, this error is small, and we therefore make the approximation
 \begin{equation} \mathcal{D}_x \approx \int_{-\infty}^{0} v_x^{(1)} | v_x^{(1)} | \,\mathrm{d} z, \end{equation}
while keeping in mind that the final result will formally only be valid in the limit of large  $N_D$. It follows from the results of the previous section that
 $v_x^{(1)}$ is a Gaussian process with zero mean when considered as a function of
 $z$. The symmetry of this process around 0 implies that the PDF of
 $\mathcal {D}_x$ is symmetrical around 0, and we may hence write
 \begin{equation} p\left( \mathcal{D}_x \right) = \tfrac{1}{2} p \left( | \mathcal{D}_x | \right). \end{equation}
We note that this relation could also have been guessed from pure physical reasoning, as the velocity of the water in the  $x$-direction at any given
 $z$-level is known to be positive as often as negative when described with first-order theory. The relation (4.36) implies that we can restrict our attention to computing the PDF of
 $| \mathcal {D}_x |$, and from (4.35) we have
 \begin{equation} | \mathcal{D}_x |\approx \left| \int_{-\infty}^{0} v_x^{(1)} | v_x^{(1)} | \,\mathrm{d} z \right| \approx \int_{-\infty}^{0} v_x^{(1)^2} \,\mathrm{d} z, \end{equation}
where the approximation comes from the fact that  $v_x^{(1)}$ may change sign with depth. We simplify the expression for
 $| \mathcal {D}_x |$ further by employing the same Laguerre quadrature as in section (4.2.1), and find that
 \begin{equation} | \mathcal{D}_x | \approx \frac{1}{k_p} \int_{0}^{\infty} v_x^{(1)^2} \,\mathrm{d} \alpha \approx \left.\frac{1}{k_p} \sum_{n_{\alpha} = 1}^{N_\alpha} W_{n_\alpha} v_x^{(1)^2} \right|_{z = z(\alpha_{n_\alpha})}. \end{equation}
For clarity, we recall that  $W_{n_\alpha } = w_{n_\alpha } \exp (\alpha _{n_\alpha })$, and that
 $\alpha _{n_\alpha }$ and
 $w_{n_\alpha }$ are the
 $n_\alpha$th quadrature point and weight of the Laguerre quadrature rule, respectively. This completes the first part of the derivation.
In order to calculate the moment generating function of  $| \mathcal {D}_x |$ we seek to rewrite (4.38) as a linear combination of squares of independent normally distributed random variables with zero mean and unit variance. To that end, we note that the vector
 $\boldsymbol {v}_x$ defined in (4.31) consists of correlated normal random variables and that its covariance matrix
 $\boldsymbol \varSigma _{v_x}$ defined in (4.32a,b) is symmetric positive-semidefinite (SPD) by construction. The latter of these facts enables us to define the dimensionless vector
 $\boldsymbol {X} = \boldsymbol \varSigma _{v_x}^{-1/2} \boldsymbol {v}_x$, with
 $\boldsymbol \varSigma _{v_x}^{1/2}$ the SPD square root of
 $\boldsymbol \varSigma _{v_x}$, and we may therefore rewrite (4.38) as
 \begin{equation} | \mathcal{D}_x
|\approx \frac{1}{k_p} \boldsymbol{X}^\textrm{T} (
\boldsymbol\varSigma_{v_x}^{1/2} \boldsymbol{\mathsf{W}}
\boldsymbol\varSigma_{v_x}^{1/2}) \boldsymbol{X}=
\frac{v_0^2}{k_p} \frac{1 + N_D}{2 + N_D}
\boldsymbol{X}^\textrm{T} ( \boldsymbol\varSigma^{1/2}
\boldsymbol{\mathsf{W}} \boldsymbol\varSigma^{1/2})
\boldsymbol{X}. \end{equation}
Here  $\boldsymbol{\mathsf{W}}$ is the diagonal matrix whose
 $(n,n)$th entry is
 $W_n$, and the second equality follows from using (4.32a,b). The symmetry of
 $\boldsymbol \varSigma ^{1/2}$ implies that the matrix
 $\boldsymbol \varSigma ^{1/2} \boldsymbol{\mathsf{W}} \boldsymbol \varSigma ^{1/2}$ is also symmetric and can therefore be orthogonally diagonalized, meaning that it can be factored as
 $\boldsymbol{\mathsf{P}}^\textrm {T} \boldsymbol \varLambda \boldsymbol{\mathsf{P}}$, where
 $\boldsymbol{\mathsf{P}}$ and
 $\boldsymbol \varLambda$ are orthogonal and diagonal matrices, respectively. By setting
 $\boldsymbol {Y} = \boldsymbol {P} \boldsymbol {X}$ and using this result in (4.39), we arrive at the relation
 \begin{equation} | \mathcal{D}_x |\approx \frac{v_0^2}{k_p} \frac{1 + N_D}{2 + N_D} \boldsymbol{Y}^\textrm{T} \boldsymbol\varLambda \boldsymbol{Y} = \frac{v_0^2}{k_p} \sum_{n_{\alpha} = 1}^{N_\alpha} \left( \frac{1 + N_D}{2 + N_D} \varLambda_{n_\alpha} \right) Y_{n_\alpha}^2, \end{equation}
which we claim is a linear combination of squared uncorrelated normally distributed variables with zero mean and unit variance. To prove this assertion, we first note that  $\boldsymbol {Y} = \boldsymbol{\mathsf{P}} \boldsymbol \varSigma _{v_x}^{-1/2} \boldsymbol {v}_x$ is in fact normally distributed, since it is a linear transformation of the vector
 $\boldsymbol {v}_x$ which is normally distributed. Secondly, a straightforward calculation shows that
 $\langle \boldsymbol {Y} \rangle = \boldsymbol {0}$ and that
 $\langle \boldsymbol {Y} \boldsymbol {Y}^\textrm {T} \rangle$ is the identity matrix, and in combination these three results imply the desired conclusion. If we now define
 $\mu _{n_\alpha } = 2 (1 + N_D)/(2+ N_D) \varLambda _{n_\alpha }$ and set
 $\xi = | \mathcal {D}_x |/(v_0^2 / k_p)$, then from (4.40),
 \begin{equation} \xi \approx \sum_{n_\alpha = 1}^{N_\alpha} \frac{1}{2} \mu_{n_\alpha} Y_{n_\alpha}^2. \end{equation}
When combined with the facts that the components of  $\boldsymbol {Y}$ are independent and all have identical PDFs, namely
 $p(Y_{n_\alpha }) = (2{\rm \pi} )^{-1/2} \exp ( - Y_{n_\alpha }^2/2)$, this result implies that the moment generating function of
 $\xi$, when evaluated at
 $-t$, is
 \begin{align} M_\xi ({-}t) &\approx \left\langle \exp \left( - \sum_{n_\alpha = 1}^{N_\alpha} \frac{1}{2} \mu_{n_\alpha} Y_{n_\alpha}^2 t \right) \right\rangle \nonumber\\ &= \prod_{n_\alpha = 1}^{N_\alpha} \left\langle \exp \left( - \frac{1}{2} \mu_{n_\alpha} Y_{n_\alpha}^2 t \right) \right\rangle = \prod_{n_\alpha = 1}^{N_\alpha} \frac{1}{( 1 + \mu_{n_\alpha} t)^{1/2}}. \end{align}
The PDF of  $\xi$ must therefore satisfy the relation
 \begin{equation} \int_{0}^{\infty} \exp \left( - \xi t \right) p(\xi) \,\mathrm{d} \xi \approx \prod_{n_\alpha = 1}^{N_\alpha} \frac{1}{(1 + \mu_{n_\alpha} t)^{1/2}}, \end{equation}
and this completes the second part of the derivation.
At this stage the only thing left to do is to invert the relation (4.43) for  $p(\xi )$. To do so, we start by considering the eigenvalues
 $\varLambda _{n_\alpha }$, which are given to six significant digits in table 1. From the table we see that the eigenvalues decay extremely rapidly with
 $n_\alpha$, such that the approximation is very accurate even for
 $N_\alpha$ as small as, say, 5. Moreover, the eigenvalues are all positive, and this implies that the singularities on the right-hand side of (4.43) all are located on the negative real axis. As such,
 $p(\xi )$ may be expressed as
 \begin{equation} p(\xi) \approx \frac{1}{2 {\rm \pi}\text{i}} \lim_{R \rightarrow \infty} \int_{ - \text{i} R}^{\text{i} R}\frac{ \exp\left( \xi t \right)}{\left( 1 + \mu_1 t \right)^{1/2} \left( 1 + \mu_2 t \right)^{1/2} \cdots ( 1 + \mu_{N_L} t )^{1/2}}\,\mathrm{d} t, \end{equation}
by using the complex inversion formula for the Laplace transform (see, e.g. Spiegel Reference Spiegel1965). To calculate this integral, we take the branch cut of the square root to be the negative part of the real line and consider the contour integral
 \begin{align} & \int_{\varGamma} \frac{ \exp\left( \xi z \right)}{\left( 1 + \mu_1 z \right)^{1/2} \left( 1 + \mu_2 z \right)^{1/2} \cdots ( 1 + \mu_{N_\alpha} z )^{1/2}}\,\mathrm{d} z \nonumber\\ &\quad =\sum_{n = 1}^{6} \int_{\varGamma_n} \frac{ \exp\left( \xi z \right)}{\left( 1 + \mu_1 z \right)^{1/2} \left( 1 + \mu_2 z \right)^{1/2} \cdots ( 1 + \mu_{N_\alpha} z )^{1/2}}\, \mathrm{d} z, \end{align}
where the components of the contour  $\varGamma$ are shown in figure 6, and should be considered in the limits
 $R \rightarrow \infty$ and
 $r \rightarrow 0$. Since the integrand is holomorphic in the region inside
 $\varGamma$, the residue theorem (see, e.g. Berg Reference Berg2013) implies that the integral along the entire curve vanishes identically. Moreover, the contribution from
 $\varGamma _1$ clearly gives
 $2{\rm \pi} \textrm {i} p(\xi )$, and it can be shown that the contributions from
 $\varGamma _2$,
 $\varGamma _4$ and
 $\varGamma _6$ to the integral tend to 0 when
 $R$ and
 $r$ tend to
 $\infty$ and
 $0$, respectively. In total, we can therefore rewrite (4.45) as
 \begin{align} p(\xi) &\approx \frac{\textrm{i}}{2{\rm \pi}} \left(\int_{\varGamma_3} \frac{ \exp\left( \xi z \right)}{\left( 1 + \mu_1 z \right)^{1/2} \left( 1 + \mu_2 z \right)^{1/2} \cdots ( 1 + \mu_{N_L} z )^{1/2}}\,\mathrm{d} z \right.\nonumber\\ &\quad \left.+ \int_{\varGamma_5} \frac{ \exp\left( \xi z \right)}{\left( 1 + \mu_1 z \right)^{1/2} \left( 1 + \mu_2 z \right)^{1/2} \cdots ( 1 + \mu_{N_L} z )^{1/2}}\,\mathrm{d} z \right), \end{align}
and upon utilizing that the square root carries the opposite sign on  $\varGamma _3$ than on
 $\varGamma _5$, we find that
 \begin{align} p(\xi) &\approx \frac{\text{i}}{2{\rm \pi}} \sum_{n = 1}^{N_\alpha} \left( ( ( -\text{i})^n - \text{i}^n) \vphantom{\int_{\mu_n^{{-}1}}^{\mu_{n+1}^{{-}1}}}\right.\nonumber\\ &\quad \times\left. \int_{\mu_n^{{-}1}}^{\mu_{n+1}^{{-}1}} \frac{\exp(-\xi t)}{\left( \mu_1 t -1 \right)^{1/2} \cdots \left( \mu_n t -1 \right)^{1/2} \left( 1 - \mu_{n+1} t \right)^{1/2} \cdots ( 1 - \mu_{N_L} t )^{1/2}}\,\mathrm{d} t \right), \end{align}
where  $\mu _{N_\alpha + 1}^{-1} \equiv \infty$. The integrals inside the sum have, as we will now show, very simple asymptotic forms with which the total expression may be simplified significantly. Using Watson's lemma (see e.g. Holmes Reference Holmes2013) it can be shown that
 \begin{align} & \int_{\mu_n^{{-}1}}^{\mu_{n+1}^{{-}1}} \frac{\exp(-\xi t)}{\left( \mu_1 t -1 \right)^{1/2} \cdots \left( \mu_n t -1 \right)^{1/2} \left( 1 - \mu_{n+1} t \right)^{1/2} \cdots ( 1 - \mu_{N_L} t )^{1/2}}\,\mathrm{d} t \nonumber\\ &\quad \sim C_n \left( \frac{\rm \pi}{\mu_1 \xi} \right)^{1/2} \exp (- \mu_n^{{-}1} \xi) \end{align}
as  $\xi \rightarrow \infty$, where the number
 $C_n$ is given by the expression
 \begin{align} C_n = \left( \frac{\varLambda_1}{\varLambda_n} -1 \right)^{{-}1/2} \cdots \left( \frac{\varLambda_{n-1}}{\varLambda_n} -1 \right)^{{-}1/2} \left( 1 - \frac{\varLambda_{n+1}}{\varLambda_n} \right)^{{-}1/2} \cdots \left( 1 - \frac{\varLambda_{N_\alpha}}{\varLambda_n} \right)^{{-}1/2}. \end{align}
If we then combine (4.36), (4.47) and (4.48) with the definitions of  $\xi$ and
 $\mu _n$, we finally find that
 \begin{equation} p \left( \frac{\mathcal{D}_x}{v_0^2 / k_p} \right) \sim C_1 \left( 8 {\rm \pi}\varLambda_1 \frac{1 + N_D}{2 + N_D} \frac{| \mathcal{D}_x |}{v_0^2 / k_p} \right)^{{-}1/2} \exp \left( - \frac{1}{2 \varLambda_1} \frac{2 + N_D}{1 + N_D} \frac{| \mathcal{D}_x |}{v_0^2 / k_p} \right) \end{equation}
as  $| \mathcal {D}_x |/(v_0^2 / k_p) \rightarrow \infty$, which concludes our derivation of the PDF of
 $\mathcal {D}_x$. From the asymptotic result (4.50) we conclude that when
 $| \mathcal {D}_x |/(v_0^2 / k_p)$ is large, it tends to follow a (scaled) chi-square distribution with one degree of freedom. We note that this result could have been anticipated qualitatively from (4.41) by combining the fact that the first term in the sum (when considered in isolation) follows a chi-square distribution with one degree of freedom with the fact that it is this term which, in some sense, is responsible for generating the events with large
 $| \mathcal {D}_x |/(v_0^2 / k_p)$, as it has the largest variance.
The contour  $\varGamma = \cup _{n = 1}^6 \varGamma _n$, which should be considered in the limits where
 $R$ tends to
 $\infty$ and
 $r$ tends to
 $0$. Here
 $\varGamma _1$ is a straight line from
 $- \text {i} R$ to
 $\text {i} R$,
 $\varGamma _2$ is a quarter circle from
 $\text {i} R$ to
 $-R$,
 $\varGamma _3$ is a straight line from
 $-R$ to
 $t_1$,
 $\varGamma _4$ is a half-circle with centre
 $t_1$ and radius
 $r$,
 $\varGamma _5$ is a straight line from
 $t_1$ to
 $-R$ and
 $\varGamma _6$ is a quarter circle from
 $-R$ to
 $- \text {i}R$. The numbers
 $z_1 = -\mu _1^{-1}$,
 $z_2 = -\mu _2^{-1}$,…,
 $z_{N_\alpha } = - \mu _{N_\alpha }^{-1}$ are the singularities of the integrand (4.45).

The eigenvalues  $\varLambda _{n_\alpha }$ of the matrix
 $\boldsymbol \varSigma ^{1/2} \boldsymbol{\mathsf{W}} \boldsymbol \varSigma ^{1/2}$ in descending order converged to six significant digits. The eigenvalues with
 $n_\alpha > 6$ are all smaller than
 $10^{-6}$.

From the asymptotic result (4.50), it is clear that the PDF of  $\mathcal {D}_x$ decays less rapidly to zero when
 $N_D$ increases. We therefore conclude that events where
 $| \mathcal {D}_x |$ is large become more probable when the directional spread of the wave field is small, as one would expect.
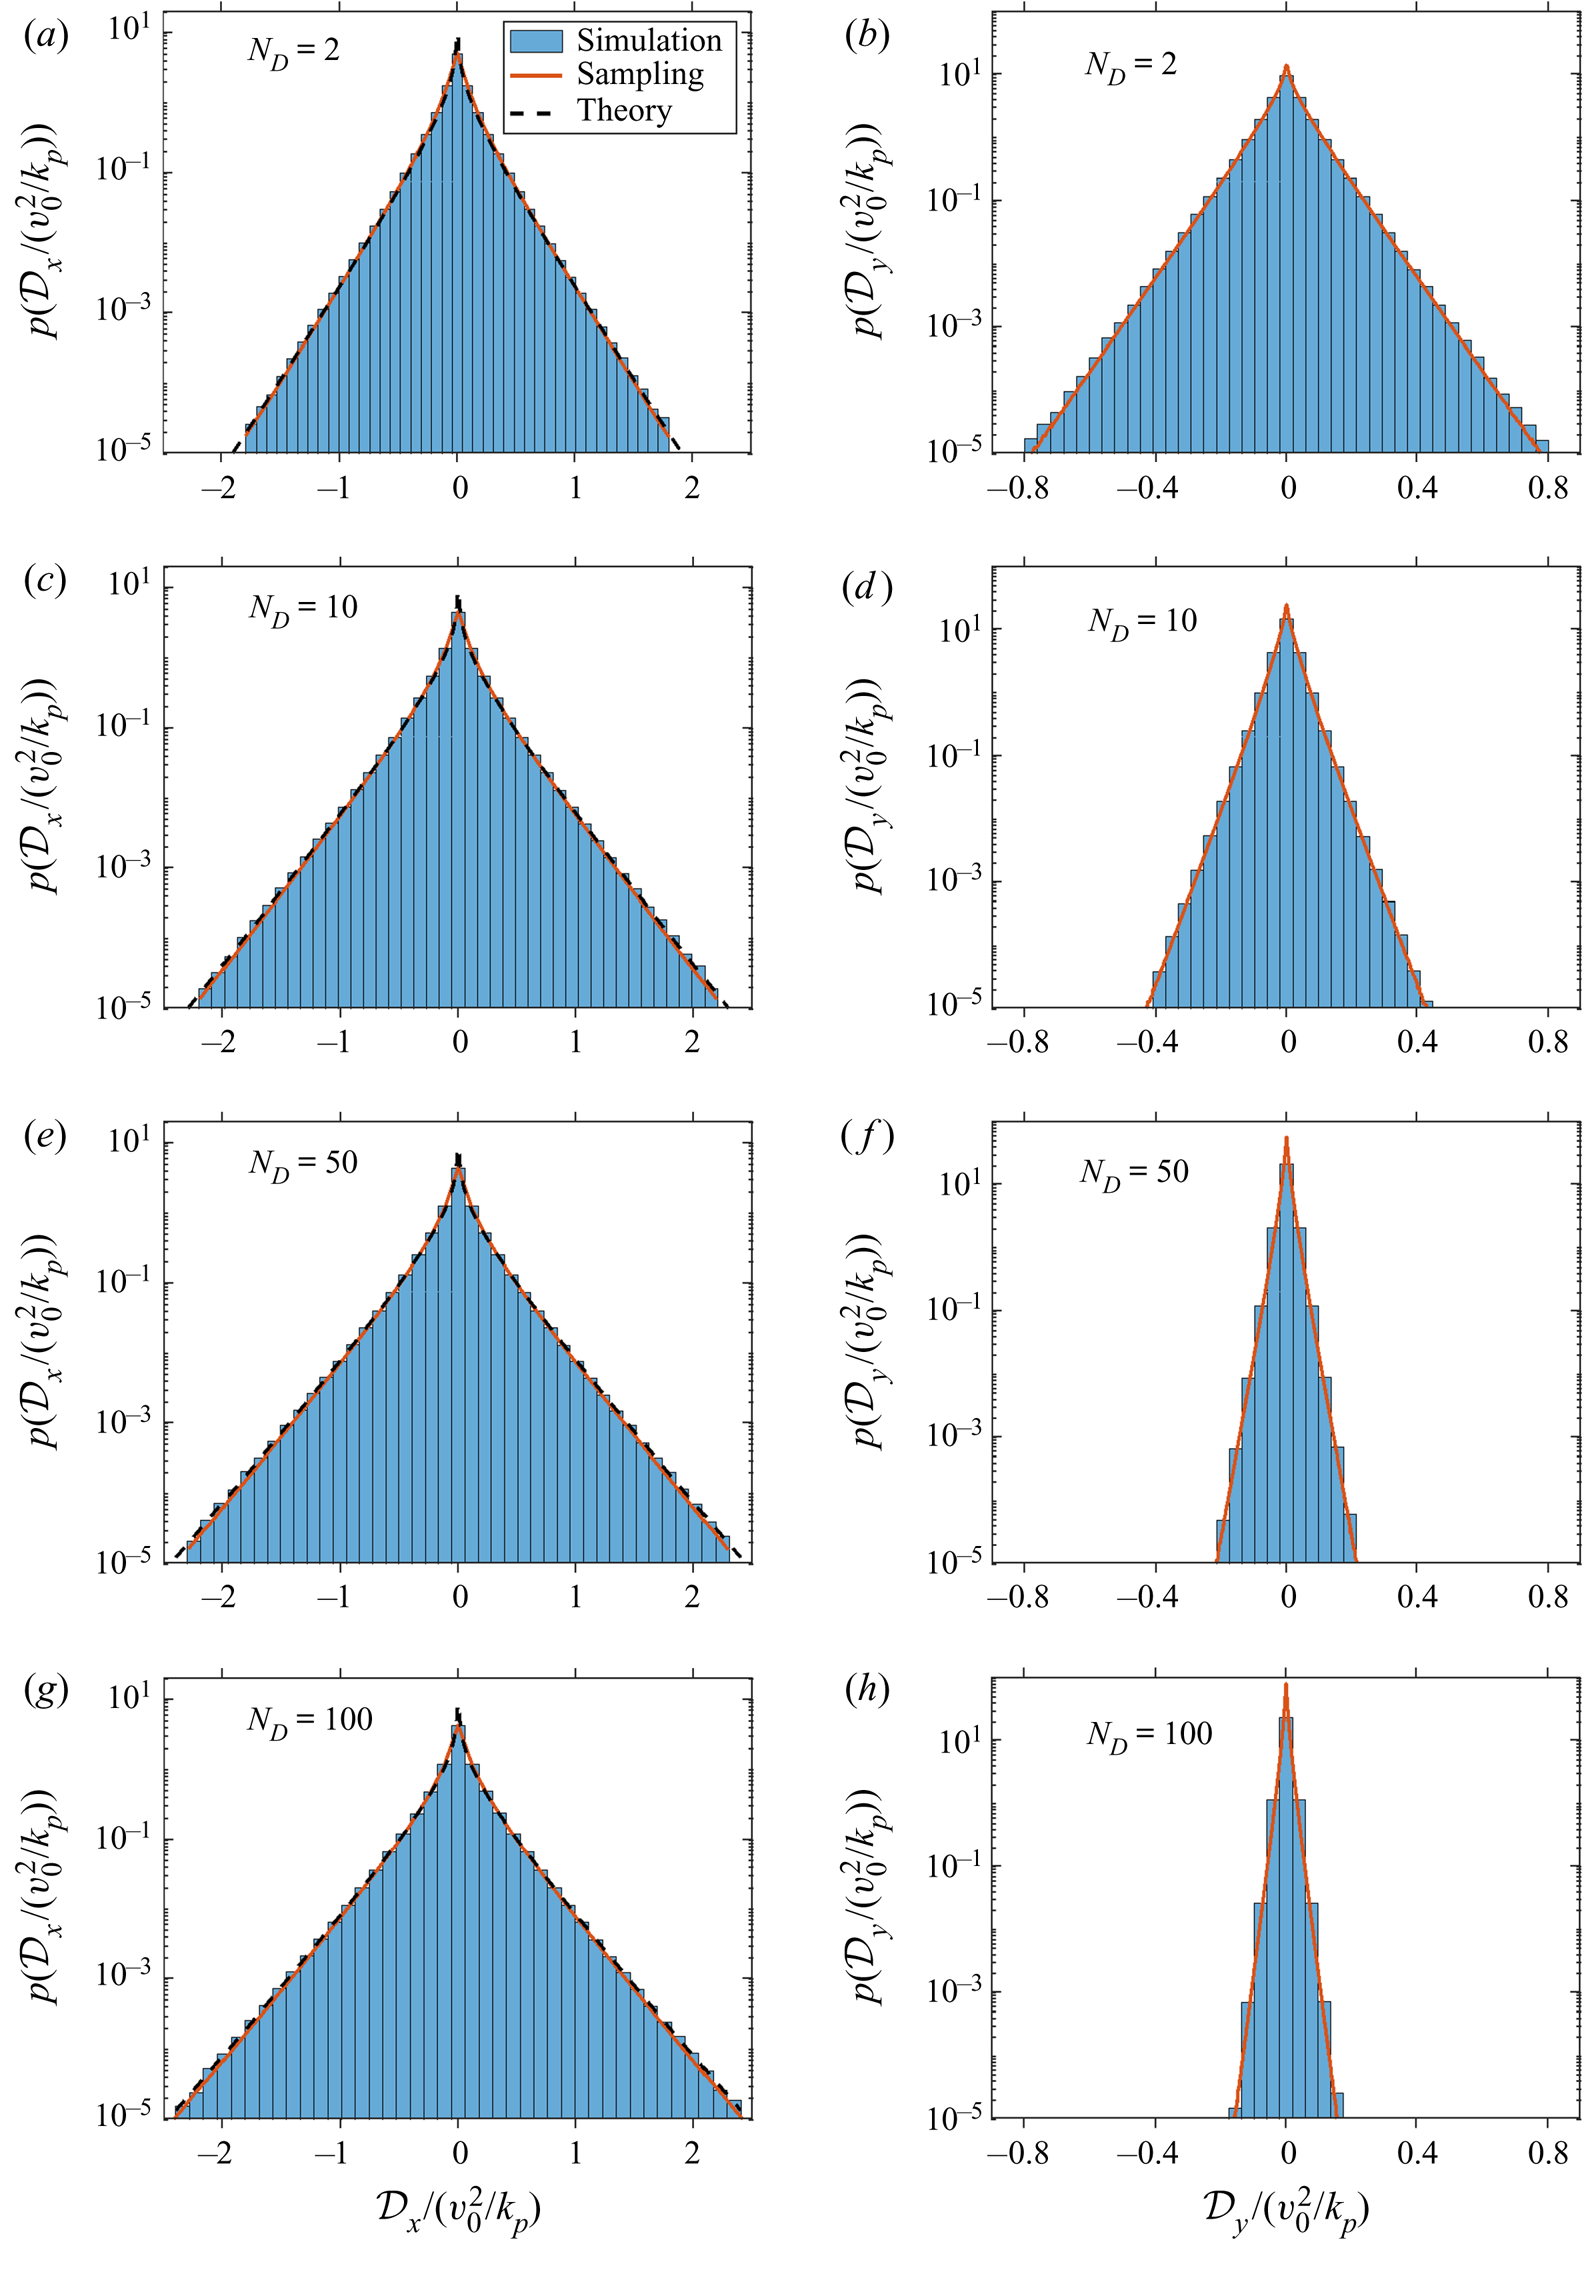
4.2.3. Comparison of the sampling method and the asymptotic approximation (4.50) with simulations of wave fields for negligible $\varepsilon$

We conclude the treatment of the depth-integrated drag terms by validating the derived results against simulations of wave fields with  $\varepsilon = 10^{-6}$. For
 $N_\alpha = 5$ and
 $N_D = 2$, 10, 50 and 100, the simulated and derived results are compared in figure 7, from which it is clear that the sampling method provides a highly accurate result even when using only five points in the quadrature (4.25). The asymptotic result (4.50) in general also provides a very good match for the simulated results for all values of
 $N_D$, except for close to
 $\mathcal {D}_x/(v_0^2 / k_p) = 0$ where it diverges due to an inverse square root singularity. This is remarkable not only because of the small value of
 $N_\alpha$, but also because of the many approximations which have been made throughout the derivation of (4.50). In this connection one may, of course, wonder whether an even better match could be found by using the formally more accurate expression (4.47). We have tested this by evaluating (4.47) numerically, but the result does not provide a better match, since it approaches 0 as
 $\mathcal {D}_x$ becomes small. The reason for this behaviour is the approximation (4.37), which effectively excludes the possibility that
 $\mathcal {D}_x = 0$.
A comparison of the PDFs of  $\mathcal {D}_x$ (a,c,e,g) and
 $\mathcal {D}_y$ (b,d,f,h) obtained from simulation of wave fields with
 $\varepsilon = 10^{-6}$ with the results of the sampling method described in § 4.2.1 and the analytical expression (4.50) for different values of
 $N_D$. The sampling method and the analytic result have both been evaluated using
 $N_\alpha = 5$. The legend applies to all figures.

In addition to providing a measure for the accuracy of the derived PDFs, we note that figure 7 also illustrates the effect of the directional spread on  $p( \mathcal {D}_x/(v_0^2/k_p) )$ and
 $p (\mathcal {D}_y/(v_0^2/k_p) )$. To that end, we conclude that the statistical properties of the depth-integrated drag terms exhibit the same qualitative behaviour as the statistical properties of the depth-integrated inertia terms in the sense that while the PDF of
 $\mathcal {D}_x/(v_0^2/k_p)$ only widens slightly as
 $N_D$ is increased from 2 to 100, the PDF of
 $\mathcal {D}_y/(v_0^2/k_p)$ narrows significantly.
5. The distributions of $\mathcal {I}_x$, $\mathcal {I}_y$, $\mathcal {D}_x$ and $\mathcal {D}_y$ as a function of $\varepsilon$ and $N_D$


In this section we present the results for the PDFs of  $\mathcal {I}_x$,
 $\mathcal {I}_y$,
 $\mathcal {D}_x$ and
 $\mathcal {D}_y$ obtained from the nonlinear simulations for
 $\varepsilon = 0.05$ and 0.10 and
 $N_D = 2$, 10, 50 and 100 at a fixed point in time and compare them with our theoretical results based on first-order theory. In that connection we re-emphasize the fact that our numerical method does not take wave breaking into account, and that the presented PDFs therefore may deviate from the true results in general and underestimate the probability of extreme events in particular, since these are expected to occur when a wave breaks right into the cylinder. The comparisons of the PDFs will be purely qualitative, but the results presented here can be freely downloaded (Klahn, Madsen & Fuhrman Reference Klahn, Madsen and Fuhrman2021c) and quantitative investigations can therefore easily be performed if desired. Before comparing the PDFs, we briefly discuss the time evolution of the skewness and kurtosis of the surface elevation, since we use these quantities to define a non-arbitrary time for the measurement of the depth-integrated quantities. Prior to presenting the PDFs, we also discuss the decay of the kinematic quantities
 $a_x$,
 $a_y$,
 $v_x ( v_x^2 + v_y^2 )^{1/2}$ and
 $v_y ( v_x^2 + v_y^2 )^{1/2}$ with depth, as these represent the inertia and drag forces per unit vertical length, respectively.
5.1. Time of measurement
At the start of the simulations, the components of the wave fields considered in this work have finite amplitudes but uncorrelated, random phases. As such, the statistical properties of the wave fields are expected to vary considerably over the first  $O(\varepsilon ^{-2})$ peak periods (see, e.g. Dysthe et al. Reference Dysthe, Trulsen, Krogstad and Socquet-Juglard2003; Annenkov & Shrira Reference Annenkov and Shrira2009; Xiao et al. Reference Xiao, Liu, Wu and Yue2013), which we note corresponds roughly to the length of our simulations. Specifically, these statistical variations relate to the skewness and kurtosis, i.e. the quantities
 \begin{equation} \mathcal{S} = \frac{\langle \eta^3 \rangle}{\langle \eta^2 \rangle^{3/2}}\quad \text{and}\quad \mathcal{K} = \frac{\langle \eta^4 \rangle}{\langle \eta^2 \rangle^2}. \end{equation}
These quantities respectively take the values 0 and 3 in the case of a linear wave field, and can therefore be used as a measure of the degree of nonlinearity of the wave field. Our results for the skewness and kurtosis are shown in figure 8, from which it can be seen that  $\mathcal {S}$ in all cases quickly reaches an almost constant level while
 $\mathcal {K}$ does not. At the instance of maximum kurtosis, the wave fields may therefore be considered to be in their most nonlinear state during the simulations, and we therefore choose to measure the statistical properties of the depth-integrated quantities at this time. In this connection we note that Toffoli et al. (Reference Toffoli, Gramstad, Truelsen, Monbaliu, Bitner-Gregersen and Onorato2010) used the same instance in time for their measurement of the PDF of the surface elevation. For completeness, the time of measurement for the different values of
 $\varepsilon$ and
 $N_D$ is listed in table 2.
The time evolution of the skewness (a,c,e,g) and kurtosis (b,d,f,h) for  $\varepsilon = 0.05$ and 0.10 and
 $N_D = 2$, 10, 50 and 100. The legend applies to all figures.

The dimensionless time  $t/T_p$ at which the PDFs of the depth-integrated quantities are measured as a function of
 $\varepsilon$ and
 $N_D$. At the times listed, the kurtosis of the surface elevation reaches it maximum during the simulations.

5.2. The decay of kinematic quantities with depth
Although this study is mainly focused on the statistical properties of the depth-integrated inertia and drag forces, we here report on the depth variation of the forces per unit vertical length. This variation is important for at least two reasons, the first being that it can be used to qualitatively explain the behaviour of the PDFs of  $D_x$ and
 $D_y$, and the second being that knowledge about the magnitude of the contributions to the total force at different depths is very useful for practical purposes. In deep water, which is assumed throughout this work, most offshore structures such as tension-leg platforms do not extend all the way to the seabed. As such, the total force calculated in this work presents an upper bound for the force on such structures, and how useful this bound is in practice obviously depends on whether substantial contributions to the force are found at great depth.
To quantify this, we have calculated the standard deviations of  $a_x$,
 $a_y$,
 $v_x ( v_x^2 + v_y^2 )^{1/2}$ and
 $v_y ( v_x^2 + v_y^2 )^{1/2}$ at the time of maximum kurtosis. As mentioned above, these quantities represent the inertia and drag forces per unit vertical length, respectively. The results for
 $\varepsilon = 0.10$ and
 $N_D = 2$, 10, 50 and 100 are shown in figure 9, and from this it is clear that both the contributions to the inertia and drag force decay extremely rapidly with depth. We have found similar results for
 $\varepsilon = 0.05$ and, therefore, conclude that significant contributions to the inertia force are limited to the region
 $z \gtrsim - \lambda _p$, and that substantial contributions to the drag force are limited to the region
 $z \gtrsim - \lambda _p/2$. If a structure penetrates deeper into the water than a single peak wavelength, the results for the depth-integrated force in this work will thus provide an accurate estimate on the total inline force on the structure. On the other hand, if the vertical extent of the structure is less than a peak wavelength, the results of this work can only be used as an upper bound.
The variation of the standard deviations of (a)  $a_x$, (b)
 $a_y$, (c)
 $v_x ( v_x^2 + v_y^2 )^{1/2}$ and (d)
 $v_y ( v_x^2 + v_y^2 )^{1/2}$ with depth for
 $\varepsilon = 0.10$ and different values of
 $N_D$. The results are computed at the time of maximum kurtosis and the legend applies to all figures.
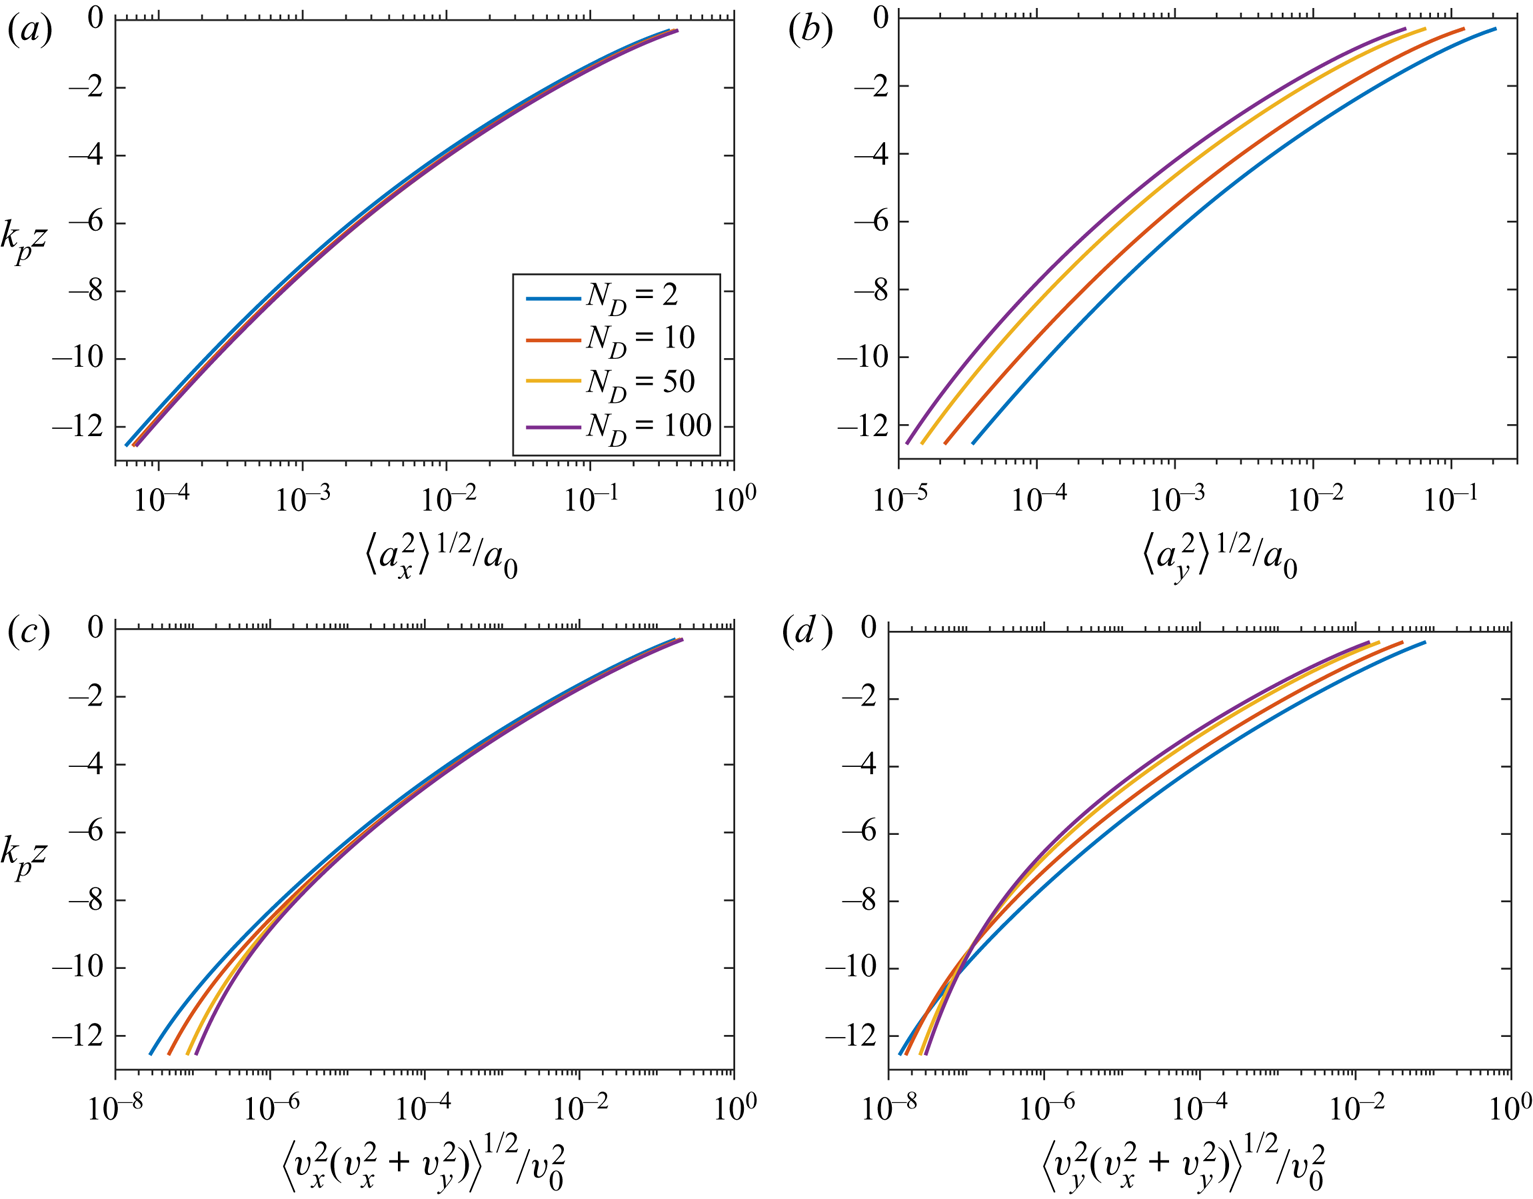
5.3. The PDF of $\mathcal {I}_x$

In figure 10 we show a comparison of the PDF of  $\mathcal {I}_x$ obtained from the nonlinear simulations together with the first-order result (4.18). From the figure, it is clear that the first-order result matches the nonlinear PDF almost perfectly for all values of
 $\varepsilon$ and
 $N_D$, and this hints that the statistical properties of
 $\mathcal {I}_x$ are unaffected by nonlinear effects. In appendix A we present a proof of the fact that the contributions from second-order nonlinearities to the PDFs of both
 $\mathcal {I}_x$ and
 $\mathcal {I}_y$ vanish identically regardless of the shape of the underlying frequency and directional spectrum. As a consequence, the exact PDF of these quantities can only differ from the first-order result if they are affected by third- or higher-order nonlinear interactions, and for
 $\mathcal {I}_x$, this is clearly not the case for the range of parameters investigated here. We note that this finding may be of great practical value, since it hints that the result of the depth-integrated Morison equation (without the extensions due to, for example, Rainey Reference Rainey1989) in many cases may be accurately approximated by the normal distribution (4.18), specifically, as may be seen from (1.2), when the parameter
 $\mathcal {P}$ is close to zero. We return to this finding when discussing the PDF of
 $F^\ast$ in § 6.
A comparison of the PDF of  $\mathcal {I}_x$ obtained from fully nonlinear simulations at the time of maximum kurtosis with the first-order result (4.18) for different values of
 $\varepsilon$ and
 $N_D$. The legend applies to all figures.

5.4. The PDF of $\mathcal {I}_y$

Our results for the PDF of  $\mathcal {I}_y$ from the nonlinear simulations are shown in figure 11 together with the first-order result given by (4.21). For
 $\varepsilon = 0.05$ there is a very good agreement between the nonlinear PDFs and the first-order approximation for all values of
 $N_D$, and this is in line with the fact that the statistical properties of
 $\mathcal {I}_y$ are not affected by second-order effects, cf. appendix A. For
 $\varepsilon = 0.10$ there is likewise a very good agreement between the exact nonlinear PDFs and the first-order approximation for
 $N_D = 2$ and 10, but for
 $N_D = 50$ and 100, the linear and nonlinear results deviate visibly as the tails of the nonlinear PDF decay much more slowly to zero. This is a clear indication of the fact that the statistical properties of
 $\mathcal {I}_y$ are affected by third-order nonlinearities when the steepness is appreciable and the wave field becomes long crested. We note that this finding is consistent with the results of, for example, Onorato et al. (Reference Onorato2009) and Toffoli et al. (Reference Toffoli, Gramstad, Truelsen, Monbaliu, Bitner-Gregersen and Onorato2010), who found that the PDF of the surface elevation is only affected by third-order interactions in the case where the directional spread of the wave field is relatively small.
A comparison of the PDF of  $\mathcal {I}_y$ obtained from fully nonlinear simulations at the time of maximum kurtosis with the first-order result (4.21) for different values of
 $\varepsilon$ and
 $N_D$. The legend applies to all figures.

5.5. The PDF of $\mathcal {D}_x$

Figure 12 shows our results for the PDF of  $\mathcal {D}_x$ from the nonlinear simulations together with the results of the first-order sampling method presented in 4.2.1 when executed with
 $N_\alpha = 5$. From the figure, it can be seen that the first-order PDF does not provide an accurate description of the nonlinear PDF for any of the pairs
 $(\varepsilon ,N_D)$ used in this study. Assuming that third-order effects only come into play when
 $N_D$ is large, we therefore conclude that
 $\mathcal {D}_x$ is in general affected by second-order nonlinearities by a simple contradiction argument. To understand this result we recall that by definition
 \begin{equation} \mathcal{D}_x = \int_{-\infty}^{\eta} v_x (v_x^2 + v_y^2)^{1/2}\,\mathrm{d} z, \end{equation}
and owing to figure 9c as well as the fact that  $N_D > 0$ in this study, we conclude that the dominant contribution to
 $\mathcal {D}_x$ comes from
 $v_x$ close to the surface. As has been shown by Song & Wu (Reference Song and Wu2000) for arbitrary depth, this quantity is in general affected by second-order nonlinearities (consider, for example, their (68) in the limit of large
 $k_p h$). In particular, Reference Song and WuSong & Wu show that the PDF of
 $v_x$ becomes skewed to second order, and it may be checked by numerical calculations that the skewness is positive for all cases presented here. This explains why
 $\mathcal {D}_x$ is more likely to be positive than negative. An important consequence of the fact that second-order nonlinearities affect the PDF of
 $\mathcal {D}_x$ is that the total inline force is likely to be only poorly described by first-order theory when the parameter
 $\mathcal {P}$ is close to 1. We return to this finding in § 6 when presenting our results for the PDF of
 $F^\ast$.
A comparison of the PDF of  $\mathcal {D}_x$ obtained from fully nonlinear simulations at the time of maximum kurtosis with the result of the first-order sampling method presented in § 4.2.1 for different values of
 $\varepsilon$ and
 $N_D$. The sampling method has been employed with
 $N_\alpha = 5$. The legend applies to all figures.

Regarding the effect of third-order nonlinearities when  $\varepsilon$ and
 $N_D$ are both large, we note that the present results imply that these interactions cannot be significant for the bulk of the PDFs. For if they were, the deviations between the linear and nonlinear PDFs for the long-crested case given by
 $\varepsilon = 0.10$ and
 $N_D = 100$ and the short-crested case given by
 $\varepsilon = 0.10$ and
 $N_D = 10$ should be substantially different, and this is not the case. A more interesting question is of course whether third-order interactions lead to differences in the tail of the distributions. With the present information, this can, however, not be determined, as it would require the exact results of second-order theory. More research is therefore called for in order to answer this question.
5.6. The PDF of $\mathcal {D}_y$

Finally, our results for the PDF of  $\mathcal {D}_y$ obtained from the nonlinear simulations are compared with the results of the first-order sampling method with
 $N_\alpha = 5$ in figure 13. For
 $\varepsilon = 0.05$, deviations between the linear and nonlinear PDFs can be seen, but these are notably smaller than the deviations for the same value of
 $\varepsilon$ found in connection with the PDF of
 $\mathcal {D}_x$ in figure 12. This indicates that the statistical properties of
 $\mathcal {D}_y$ are much less affected by second-order effects than are the statistical properties of
 $\mathcal {D}_x$, and an argument supporting this finding goes as follows. The definition
 \begin{equation} \mathcal{D}_y = \int_{-\infty}^{\eta} v_y (v_x^2 + v_y^2)^{1/2}\,\mathrm{d} z \end{equation}
in connection with figure 9(d) implies that the statistical properties of  $\mathcal {D}_y$ must be intimately linked to the statistical properties of
 $v_y|_{z = \eta }$. Moreover, when the directional distribution,
 $D(\theta )$, is an even function as in this work, it turns out that
 $v_y|_{z = \eta }$ is unaffected by second-order nonlinearities. Therefore,
 $\mathcal {D}_y$ is not expected to be affected substantially by second-order effects. A rather technical proof of the claim that
 $v_y|_{z = \eta }$ is unaffected by second-order effects is given in appendix B, but we note that the result can in fact also be understood intuitively. As shown by Longuet-Higgins (Reference Longuet-Higgins1963), the only possible effects of second-order nonlinearities on a given quantity are to (i) change its mean value and (ii) change its skewness. When
 $D(\theta )$ is an even function, it is reasonable to assume that the PDF of
 $v_y|_{z = \eta }$ must be an even function regardless of the order, to which the calculation is carried out. As such, all odd moments of
 $v_y|_{z = \eta }$ are always zero, and, therefore, no change in the statistical behaviour of
 $v_y|_{z = \eta }$ can appear when extending the first-order description to include the effect of second-order nonlinearities.
A comparison of the PDF of  $\mathcal {D}_y$ obtained from fully nonlinear simulations at the time of maximum kurtosis with the result of the first-order sampling method presented in § 4.2.1 for different values of
 $\varepsilon$ and
 $N_D$. The sampling method has been employed with
 $N_\alpha = 5$. The legend applies to all figures.

For  $\varepsilon = 0.10$, the linear and nonlinear PDFs in figure 13 only differ slightly for
 $N_D = 2$ and 10, but for
 $N_D = 50$ and 100 a substantial deviation can be seen. This suggests that when the steepness is appreciable and the wave field is relatively long crested, the statistical properties of
 $\mathcal {D}_y$ are significantly affected by third-order effects.
6. The distributions of $F^\ast$ as a function of $\varepsilon$ and $N_D$


In this section we consider the PDF of  $F^\ast$ as a function of the parameter
 $\mathcal {P}$ (see (1.3) for the definition of
 $\mathcal {P}$). We briefly describe how first-order PDFs for
 $F^\ast$ can be constructed in the completely inertia and drag-dominated regimes, i.e. when
 $\mathcal {P} = 0$ and
 $\mathcal {P} = 1$, and subsequently compare these to the fully nonlinear results for
 $\varepsilon = 0.05$ and 0.10 and
 $N_D = 2$, 10, 50 and 100. The comparisons will again be of a qualitative nature, but quantitative results can easily be checked, as the results are publicly available (Klahn et al. Reference Klahn, Madsen and Fuhrman2021c). The nonlinear PDFs are computed at the times stated in table 2, and, to be clear, we take
 $a_0 = \varepsilon g$ and
 $v_0 = \varepsilon (g/k_p)^{1/2}$ in (1.3) such that the parameter
 $\mathcal {P}$ becomes
 \begin{equation} \mathcal{P} = \left( 1 + \left( \frac{\rm \pi}{2} \frac{C_M}{C_D} \frac{k_p D}{\varepsilon} \right)^2 \right)^{{-}1}. \end{equation}
This shows that, for a given wave field, the value of  $\mathcal {P}$ is determined by the properties of the cylinder as claimed in the introduction. Moreover, since we typically have
 $({\rm \pi} C_M)/(2 C_D) = O(1)$, it shows that
 $\mathcal {P}$ is close to zero when the ratio
 $k_p D/\varepsilon$ is large and close to one when the ratio is small.
6.1. First-order theory for the distribution of $F^\ast$ when $\mathcal {P} = 0$ and $\mathcal {P} = 1$


When  $\mathcal {P} = 0$, the total non-dimensional inline force is given by the length of
 ${\boldsymbol {\mathcal I}}/(a_0/k_p)$, and using an argument similar to that used in § 4.2.1 it can be shown that the components of this vector are independent and normally distributed with zero mean and variances
 $(1+N_D)/(4(2+N_D))$ and
 $1/(4(2+N_D))$, respectively. As such, the PDF of
 $F^\ast$ may in this case be calculated using the exact same procedure as, for example, used by Klahn et al. (Reference Klahn, Madsen and Fuhrman2021b) to compute the PDF of the horizontal fluid velocity at the surface. Since the steps in this procedure are explained in § 5.1 in the paper of Klahn et al., we are content with stating the final result, which reads
 \begin{equation} p(F^\ast) = \frac{4(2 + N_D)}{(1 + N_D)^{1/2}} F^\ast \exp \left( - \frac{(2 + N_D)^2}{1 + N_D} F^{{\ast}^2} \right) I_0 \left( \frac{(2+N_D) N_D}{1 + N_D} F^{{\ast}^2} \right). \end{equation}
Here  $I_0$ is the modified Bessel function of the first kind of order 0, and it is interesting to note that
 $I_0(x) \sim \exp (x)/(2{\rm \pi} x)^{1/2}$ as
 $x \rightarrow \infty$ (see, for example, Abramowitz & Stegun Reference Abramowitz and Stegun1972), because it implies that
 \begin{equation} p(F^\ast) \sim \left( \frac{8}{\rm \pi} \frac{2 + N_D}{N_D} \right)^{1/2} \exp \left( - \frac{2 (2+N_D)}{1+N_D} F^{{\ast}^2} \right)\quad \text{as }F^\ast \rightarrow \infty. \end{equation}
It will be seen that the asymptotic exponential decay of  $p(F^\ast )$ is the same as that of
 $P(\mathcal {I}_x/(a_0/k_p))$ (see (4.18)), and, therefore, hints that the asymptotic behaviour of
 $F^\ast$ is determined by the kinematics of the wave field in the main direction.
When  $\mathcal {P} = 1$, the total non-dimensional inline force is given by the length of
 ${\boldsymbol {\mathcal D}}/(v_0^2 / k_p)$, and the PDF of
 $F^\ast$ can therefore be sampled using the method presented in § 4.2.1. In figure 14 we show the sampled PDF obtained using
 $N_\alpha = 5$ for
 $N_D = 2$, 10 and 100, together with functions of the form
 $C F^{\ast ^{-1/2}} \exp ( -1/(2 \varLambda _1) (2+N_D)/(1+N_D) F^\ast )$ with
 $C$ a constant, i.e. functions that decay at the same rate as the PDF of
 $\mathcal {D}_x$ given by (4.50). For large values of
 $F^\ast$ there is a very good agreement between the sampled PDFs and the asymptotic behaviour of the PDF of
 $\mathcal {D}_x$. This gives further support to the assertion that the asymptotic behaviour of
 $p(F^\ast )$ is determined by the kinematics of the wave field in the main direction.
The PDF of  $F^\ast$ for
 $\mathcal {P} = 1$ obtained using the sampling method described in § 4.2.1 with
 $N_\alpha = 5$ for different values of
 $N_D$. The dashed lines show functions of the form
 $C F^{\ast ^{-1/2}} \exp ( -1/(2 \varLambda _1) (2+N_D)/(1+N_D) F^\ast )$, where the constant
 $C$ has been chosen such that the asymptotic behaviour agrees with
 $p(F^\ast )$.

6.2. The nonlinear distribution of $F^\ast$ as a function of $\mathcal {P}$


Our results for the PDF of  $F^\ast$ obtained from the nonlinear simulations are shown in figure 15 for different values of
 $\mathcal {P}$ together with the first-order distributions described in the previous section. From the figure we conclude that when
 $\mathcal {P} = 0$, the PDF of
 $F^\ast$ is very well described by the first-order result (6.2) for all values of
 $\varepsilon$ and
 $N_D$ as anticipated in § 5.3. We stress, however, that this result not necessarily implies that the more accurate formulation of the inertia force by, for example, Rainey (Reference Rainey1989) is unaffected by nonlinear effects. We also conclude that the first-order sampling method for computing the PDF of
 $F^\ast$ when
 $\mathcal {P} = 1$ drastically underestimates the probability of large forces for all
 $\varepsilon$ and
 $N_D$ as anticipated in § 5.5. Clearly, the deviation between the linear and nonlinear results for
 $\mathcal {P} = 1$ become more significant when the steepness increases. From the figure we also conclude, regardless of the value of
 $\mathcal {P}$, that large forces become substantially more probable when
 $\varepsilon$ and
 $N_D$ increase. When
 $0 < \mathcal {P} < 1$, it appears that when
 $F^\ast$ is small, its PDF behaves qualitatively like the inertia-dominated PDF (
 $\mathcal {P} = 0$), and when
 $F^\ast$ is large, its PDF behaves qualitatively like the drag-dominated PDF ((
 $\mathcal {P} = 1$)). By this we mean that
 $p(F^\ast )$ initially grows to a maximum for small values of
 $F^\ast$, while it decays at a rate which on a logarithmic scale appears to be constant for large values of
 $F^\ast$. This finding may be understood by recalling that the PDF of the depth-integrated inertia terms in general decay much more rapidly than the PDF of the depth-integrated drag terms. We emphasize, however, that when
 $\mathcal {P} < 1$, the quantitative behaviour of
 $p(F^\ast )$ for large values of
 $F^\ast$ is not the same as that of the drag-dominated PDF, since the asymptotic decay is different.
The PDF of the non-dimensional total inline force,  $F^\ast$, as a function of the parameter
 $\mathcal {P}$ for different values of
 $\varepsilon$ and
 $N_D$. The upper dashed line shows the first-order result (6.2) for
 $\mathcal {P} = 0$ while the lower dashed line shows the result of the first-order sampling method for
 $p(F^\ast )$ executed with
 $N_\alpha = 5$ when
 $\mathcal {P} = 1$. The legend applies to all figures.

7. Conclusions
In this paper we have presented a study of the effect of wave steepness and directional spread on the statistical properties of the non-dimensional total inline force  $F^\ast$ as well as the depth-integrated quantities
 $\mathcal {I}_x$,
 $\mathcal {I}_y$,
 $\mathcal {D}_x$ and
 $\mathcal {D}_y$ as defined in (1.4a,b) for nonlinear irregular wave fields based on directional JONSWAP spectra. We have described the wave fields using potential flow theory and specifically considered the values
 $\varepsilon = 0.05$ and 0.10 for the steepness and
 $N_D = 2$, 10, 50 and 100 for the directional spread. The study was motivated by the fact that while the Morison equation remains the most popular tool for estimating the wave-induced inline force on a vertical circular cylinder, its statistical properties have until now been largely unknown, as these have mostly been studied for unidirectional wave fields using first-order theory.
In order to provide the necessary benchmark needed to clarify the role of nonlinear effects in connection with the depth-integrated quantities, we have derived a number of results related to the PDFs of the depth-integrated quantities analytically using their moment generating function in connection with first-order theory. We have shown that  $\mathcal {I}_x$ and
 $\mathcal {I}_y$ both follow normal distributions to first order in
 $\varepsilon$ as given in (4.18) and (4.21). In addition, we have derived a sampling procedure with which the first-order PDFs of
 $\mathcal {D}_x$ and
 $\mathcal {D}_y$ can be computed to any desired accuracy for an arbitrary directional spread of the wave field. The sampling procedure is based on a Laguerre quadrature, and we have shown that it is highly accurate even when using only five quadrature points. Assuming that the directional spread of the wave field is small, we have derived the asymptotic result (4.50) for the PDF of
 $\mathcal {D}_x$, which shows that
 $\mathcal {D}_x$ asymptotically follows a (scaled) chi-square distribution with a single degree of freedom. Despite the many approximations employed to arrive at the final result, the expression is remarkably accurate even for small values of
 $N_D$. It is only inaccurate close to the origin where it diverges due to an inverse square root singularity.
To obtain the PDFs of the depth-integrated quantities and the total inline force in the general nonlinear case, we have performed extensive numerical simulations using the numerical method of Klahn et al. (Reference Klahn, Madsen and Fuhrman2021a). This method is fully nonlinear and solves the governing potential flow equations without any approximations using a pseudospectral discretization strategy. The PDFs of the depth-integrated quantities were measured at the time of maximum kurtosis during the simulations, and the following was concluded. The PDF of  $\mathcal {I}_x$ is, for all values of
 $\varepsilon$ and
 $N_D$ used in this work, essentially unaffected by nonlinear effects. It is therefore very well approximated by the first-order result (4.18). The PDF of
 $\mathcal {I}_y$ is very well described by the first-order result (4.21) for
 $\varepsilon = 0.05$ and all values of
 $N_D$ used in this work. For
 $\varepsilon = 0.10$, third-order effects give rise to substantial deviations from the first-order results when
 $N_D \ge 50$. The PDF of
 $\mathcal {D}_x$ is, for all values of
 $\varepsilon$ and
 $N_D$ used in this work, strongly affected by second-order nonlinear effects. Finally, the PDF of
 $\mathcal {D}_y$ was found to be much less affected by second-order effects than the PDF of
 $\mathcal {D}_x$. In many cases, the former is therefore well approximated by the result of first-order theory. We explained this by pointing to the fact that when the directional distribution of the wave field is an even function, the second-order corrections to the fluid velocity in the
 $y$-direction at the surface vanish. For
 $\varepsilon = 0.10$ and
 $N_D \ge 50$, however, the PDF of
 $\mathcal {D}_y$ is strongly affected by third-order nonlinearities and, therefore, deviates substantially from the first-order PDF.
The PDF of the total inline force  $F^\ast$ as given in (1.2) was likewise measured at the time of maximum kurtosis during the simulations. It was found that in the inertia-dominated regime (i.e. when the parameter
 $\mathcal {P}$ is close to zero), the force is very well described by first-order theory. Caution should, however, be taken when interpreting this result; it simply means that the result of the classical Morison equation in many situations can be accurately approximated by first-order theory. It does not necessarily mean that the additional inertia terms in the formulations of, for example, Rainey (Reference Rainey1989, Reference Rainey1995) are not affected by nonlinear effects. In the drag-dominated regime (i.e. when
 $\mathcal {P}$ is close to 1) the total inline force is only very poorly described by first-order theory. The probability of large forces was found to increase substantially with both the wave steepness and the directional spread for all values of
 $\mathcal {P}$. For
 $\mathcal {P}$ satisfying
 $0 < \mathcal {P} < 1$, we concluded that the PDF of
 $F^\ast$ behaves qualitatively similar to the inertia-dominated PDF for small values of
 $F^\ast$ while it behaves qualitatively similar to the drag-dominated PDF for large values of
 $F^\ast$.
Funding
The authors gratefully acknowledge the funding received from Centre for Oil and Gas - DTU/Danish Hydrocarbon Research and Technology Centre (DHRTC). Project name: DEWIOS. Project ID: FL_110.
Declaration of interests
The authors report no conflict of interest.
Appendix A. Second-order nonlinear effects on the PDFs of $\mathcal {I}_x$ and $\mathcal {I}_y$


Although the PDFs (4.18) and (4.21) were derived with first-order theory, it turns out that they are identical to the PDFs that can be derived when taking into account the effect of second-order nonlinearities. As such, the PDFs are in fact accurate to second order in  $\varepsilon$, and it is the purpose of this section to prove this result. The basic idea of the proof is to show that the second-order corrections to the moments of
 $\mathcal {I}_x$ and
 $\mathcal {I}_y$ vanish, implying that their moment generating functions and, hence, their PDFs do not change when the second-order corrections are included. Since the steps and arguments used in connection with the PDF of
 $\mathcal {I}_y$ are completely analogous to those used in connection with the PDF of
 $\mathcal {I}_x$, we only prove the result for the
 $x$-direction. In addition, we take
 $\boldsymbol {r} = \boldsymbol {0}$ and
 $t = 0$ without loss of generality throughout this section.
To get started with the proof, we recall that to second order in  $\varepsilon$ the solution to (2.1) takes the form
 \begin{gather} \eta = \eta^{(1)} + \eta^{(2)}, \end{gather}
 \begin{gather}\varPhi = \varPhi^{(1)} + \varPhi^{(2)}. \end{gather}
Here the first-order solution (indicated with the superscript (1)) is given by (4.4), while the second-order correction (indicated by the superscript (2)) has been calculated by, for example, Longuet-Higgins (Reference Longuet-Higgins1963). As we will use this result in the following, we mention here that he found the second-order correction to the velocity potential to be given by the expression
 \begin{align} \varPhi^{(2)} &= \frac{1}{2} \sum_{n} \sum_{m} \left(\frac{\hat{a}_n \omega_n}{|\boldsymbol{k}_n|} \frac{\hat{a}_m \omega_m}{|\boldsymbol{k}_m|} \right.\nonumber\\ &\quad \times\left(\frac{(\omega_n - \omega_m)(\boldsymbol{k}_n \cdot \boldsymbol{k}_m + |\boldsymbol{k}_n| |\boldsymbol{k}_m|)}{(\omega_n - \omega_m)^2 - g|\boldsymbol{k}_n - \boldsymbol{k}_m|} \exp \left( |\boldsymbol{k}_n - \boldsymbol{k}_m| z \right) \sin(\phi_n - \phi_m) \right.\nonumber\\ &\quad \left.\left.+ \frac{(\omega_n + \omega_m)(\boldsymbol{k}_n \cdot \boldsymbol{k}_m - |\boldsymbol{k}_n| |\boldsymbol{k}_m|)}{(\omega_n + \omega_m)^2 - g|\boldsymbol{k}_n + \boldsymbol{k}_m|} \exp \left( |\boldsymbol{k}_n + \boldsymbol{k}_m| z \right) \sin(\phi_n + \phi_m)\right) \right), \end{align}
where the factor  $1/2$ has been added, as it is missing in the paper by Longuet-Higgins. The form of the second-order solution (A1) implies that the fluid acceleration in the
 $x$-direction is
 $a_x = a_x^{(1)} + a_x^{(2)}$, where
 $a_x^{(1)} \equiv \partial _t \partial _x \varPhi ^{(1)}$ as in section (4.1) and
 \begin{equation} a_x^{(2)} \equiv\frac{\partial v_x^{(2)}}{\partial t} + v_x^{(1)} \frac{\partial v_x^{(1)}}{\partial x} + v_y^{(1)} \frac{\partial v_x^{(1)}}{\partial y} + v_z^{(1)} \frac{\partial v_x^{(1)}}{\partial z}. \end{equation}
Here  $v_x^{(1)}$,
 $v_y^{(1)}$ and
 $v_z^{(1)}$ are the fluid velocities in the
 $x$-,
 $y$- and
 $z$-directions to first order in
 $\varepsilon$, respectively, while
 $v_x^{(2)} \equiv \partial _x \varPhi ^{(2)}$ is the second-order correction to the fluid velocity in the
 $x$-direction. This result implies that
 $\mathcal {I}_x$ to second order in
 $\varepsilon$ is given by the expression
 \begin{align} \mathcal{I}_x &= \int_{-\infty}^{0} a_x^{(1)} \,\mathrm{d} z + \eta^{(1)} a_x^{(1)} |_{z = 0} \nonumber\\ &\quad + \int_{-\infty}^{0} \left( \frac{\partial v_x^{(2)}}{\partial t} + v_x^{(1)} \frac{\partial v_x^{(1)}}{\partial x} + v_y^{(1)} \frac{\partial v_x^{(1)}}{\partial y} + v_z^{(1)} \frac{\partial v_x^{(1)}}{\partial z} \right) \mathrm{d} z. \end{align}
If (4.4b) and (A2) are inserted into the expressions for  $a_x^{(1)}$ and
 $a_x^{(2)}$ and subsequently into (A4),
 $\mathcal {I}_x$ turns out to be of the form
 \begin{equation} \mathcal{I}_x = \sum_{n} A_n \sin(\phi_n) + \sum_{n} \sum_{m} B_{n,m} \cos(\phi_n) \sin(\phi_m), \end{equation}
where  $A_n = g \hat {a}_n \cos (\theta _n)$ and
 $B_{n,m}$ is a function of
 $\omega _n$,
 $\theta _n$ and
 $\boldsymbol {k}_n$ as well as
 $\omega _m$,
 $\theta _m$ and
 $\boldsymbol {k}_m$. While the exact expression for
 $B_{n,m}$ is not particularly important for the present purpose, it is important to note that the first term in (A5) is of order
 $a_0/k_p$ while the second term is of order
 $\varepsilon a_0 / k_p$. This may be shown by considering the variance of the terms individually, but we note that care must be taken in this process when considering the part of
 $B_{n,m}$ arising from the term
 $a_x^{(1)} |_{z = 0} \eta ^{(1)}$. When taken strictly, the variance of this term is infinite for the spectrum (2.2) since the resulting integral, which runs from 0 to
 $\infty$, diverges. If restricted to any finite interval, as is effectively done in the numerical simulations, the integral however converges and turns out to be of order
 $\varepsilon a_0 / k_p$. Now, using (A5) in combination with the binomial theorem, we find that the
 $p$th moment of
 $\mathcal {I}_x$ can be written as
 \begin{equation} \langle \mathcal{I}_x^p \rangle = \sum_{j = 0}^{p} {p\choose j} \left\langle \left( \sum_{n} A_n \sin(\phi_n) \right)^{p-j} \left( \sum_{l} \sum_{m} B_{l,m} \cos(\phi_l) \sin(\phi_m)\right)^{j}\right\rangle, \end{equation}
and it is clear from the above order of magnitude estimations that the  $j$th term in this expression is of order
 $\varepsilon ^j (a_0 / k_p)^p$. We therefore truncate the sum at
 $j = 1$ to be consistent with the second-order approximation. To complete the proof, we note that the term with
 $j = 0$ corresponds to the first-order contribution and that the contribution from the term with
 $j = 1$ is
 \begin{align} & p \sum_{n_1} \cdots \sum_{n_{p-1}} \sum_{l} \sum_{m} (( A_{n_1} \cdots A_{n_{p-1}} ) B_{l,m} \nonumber\\ &\quad \times \langle \sin(\phi_{n_1}) \cdots \sin(\phi_{n_{p-1}}) \cos(\phi_l) \sin(\phi_m)\rangle ) = 0, \end{align}
since by definition of the phases the average of the product of the sine and cosine functions vanishes. In conclusion, all moments of  $\mathcal {I}_x$ are the same to second order as to first order. Therefore, the moment generating function of
 $\mathcal {I}_x$ is the same to second order as to first order, and, thus, the PDF of
 $\mathcal {I}_x$ is the same to second order as to first order. We note that this result is solely implied by the randomness of the phases, and, therefore, holds regardless of the shape of the directional spectrum.
Appendix B. Second-order nonlinear effects on the PDF of $v_y|_{z = \eta }$

When the directional part of the underlying spectrum is an even function, i.e. when  $D(-\theta ) = D(\theta )$, it turns out that the contribution from second-order nonlinearities to the PDF of
 $v_y^{(s)} \equiv v_y|_{z = \eta }$ vanishes identically. In the following, we give a proof of this assertion by showing that the second-order corrections to the moments of
 $v_y^{(s)}$ are all zero. To simplify the notation, we again take
 $\boldsymbol {r} = \boldsymbol {0}$ and
 $t = 0$ without loss of generality.
To second order in  $\varepsilon$, we have
 \begin{equation} v_y^{(s)} = \left.\frac{\partial \varPhi^{(1)}}{\partial y} \right|_{z = 0} +\left(\eta^{(1)} \left.\frac{\partial^2 \varPhi^{(1)}}{\partial z \partial y}\right|_{z = 0}+ \left.\frac{\partial \varPhi^{(2)}}{\partial y} \right|_{z = 0}\right), \end{equation}
where  $\eta ^{(1)}$ and
 $\varPhi ^{(1)}$ are given by (4.4) and
 $\varPhi ^{(2)}$ is given by (A2). Inserting the results from (4.4) and (A2) into this relation, however, yields a very long expression, and we therefore start by defining some auxiliary notation. We define the numbers
 $A_n$ and
 $B_{l,m}$ by
 \begin{gather} A_n = \omega_n \sin(\theta_n), \end{gather}
 \begin{gather}B_{l,m} = \tfrac{1}{2} \left( \omega_l | \boldsymbol{k}_l | \sin(\theta_l) + \omega_m | \boldsymbol{k}_m | \sin(\theta_m) \right), \end{gather}
as well as the number  $\beta _{l,m}^{(\pm )} = \alpha _{l,m}^{(-)} \pm \alpha _{l,m}^{(+)}$, where
 \begin{equation} \alpha_{l,m}^{({\pm})}= \frac{1}{2} \left( | \boldsymbol{k}_l | \sin(\theta_l) \pm | \boldsymbol{k}_m | \sin(\theta_m) \right) \frac{\omega_l \omega_k}{| \boldsymbol{k}_l | | \boldsymbol{k}_m |} \frac{(\omega_l \pm \omega_m)(\boldsymbol{k}_l \cdot \boldsymbol{k}_m \mp |\boldsymbol{k}_l| |\boldsymbol{k}_m|)}{(\omega_l \pm \omega_m)^2 - g|\boldsymbol{k}_l \pm \boldsymbol{k}_m|}. \end{equation}
Using these definitions, it may be shown that (B1) can be written as
 \begin{align} v_y^{(s)} &= \sum_{n} \hat{a}_n A_n \cos(\phi_n) \nonumber\\ &\quad + \sum_{l} \sum_{m} \hat{a}_l \hat{a}_m ( ( B_{l,m} + \beta_{l,m}^{(+)} ) \cos(\phi_l) \cos(\phi_m) + \beta_{l,m}^{(-)} \sin(\phi_l) \sin(\phi_m) ), \end{align}
and we note that  $\beta _{l,l}^{(+)} = \beta _{l,l}^{(-)} = 0$ for all
 $l$ which may be proven by taking the limit
 $\boldsymbol {k}_m \rightarrow \boldsymbol {k}_l$ (see, e.g. the remark by Longuet-Higgins (Reference Longuet-Higgins1963) immediately after his (3.9)). Moreover, we note that it can be shown by considering the variances of the first and second term in this expression separately that the former is of order
 $v_0$ while the latter is of order
 $\varepsilon v_0$. Now, from (B4) and the binomial theorem, it follows that the
 $p$th moment of
 $v_y^{(s)}$ is given by
 \begin{align} \Big\langle v_y^{(s)^p} \Big\rangle &= \sum_{j = 0}^{p} {p \choose j} \left\langle \left( \sum_{n} \hat{a}_n A_n \cos(\phi_n) \right)^{p-j} \right.\nonumber\\ &\quad \left.\times \left( \sum_{l} \sum_{m} \hat{a}_l \hat{a}_m ( ( B_{l,m} + \beta_{l,m}^{(+)}) \cos(\phi_l) \cos(\phi_m) + \beta_{l,m}^{(-)} \sin(\phi_l) \sin(\phi_m) ) \right)^p\right\rangle, \end{align}
and since the  $j$th term in this sum is of order
 $\varepsilon ^j v_0^p$, we truncate the sum at
 $j = 1$ to be consistent with second-order theory. The second-order contribution to the
 $p$th moment,
 $\text {SOC}(p)$, of
 $v_y^{(s)}$ is thus
 \begin{align} \text{SOC}(p) &= p
\sum_{n_1} \cdots \sum_{n_{p-1}} \sum_{l} \sum_{m} (
\hat{a}_{n_1} \cdots \hat{a}_{n_{p-1}} \hat{a}_l \hat{a}_m
) ( A_{n_1} \cdots A_{n_{p-1}}) \nonumber\\ &\quad \times ( ( B_{l,m} +
\beta_{l,m}^{(+)} ) \langle \cos(\phi_{n_1})
\cdots \cos(\phi_{n_{p-1}}) \cos(\phi_l) \cos(\phi_m)
\rangle \nonumber\\ &\quad +
\beta_{l,m}^{(-)} \langle \cos(\phi_{n_1}) \cdots
\cos(\phi_{n_{p-1}}) \sin(\phi_l) \sin(\phi_m) \rangle
), \end{align}
and from this we immediately conclude that  $\text {SOC}(p) = 0$ whenever
 $p$ is even, for in that case the averages are taken over an odd number of cosine functions. We also conclude that regardless of whether
 $p$ is even or odd, the contribution from the term containing
 $\beta _{l,m}^{(-)}$ vanishes, since we must require
 $l = m$ for the phase average to be non-zero, but in that case
 $\beta _{l,m}^{(-)} = 0$ as noted above. Setting
 $p = 2q+1$, the odd moments of
 $v_y^{(s)}$ therefore are
 \begin{align} \text{SOC}(2q+1) &= (2q+1)
\sum_{n_1} \cdots \sum_{n_{2q}} \sum_{l} \sum_{m} (
\hat{a}_{n_1} \cdots \hat{a}_{n_{2q}} \hat{a}_l \hat{a}_m
) ( A_{n_1} \cdots A_{n_{2q}} )
\nonumber\\ &\quad \times ( B_{l,m} +
\beta_{l,m}^{(+)} ) \langle \cos(\phi_{n_1})
\cdots \cos(\phi_{n_{2q}}) \cos(\phi_l) \cos(\phi_m)
\rangle. \end{align}
To make progress from here, we recall that the phases must be equal in pairs for the average to be non-zero, and that  $\langle \cos (\phi _n) \cos (\phi _m) \rangle = \frac {1}{2} \delta _{n,m}$. Using these results together with the fact that
 $\beta _{l,l}^{(+)} = 0$, we find that
 \begin{align} \text{SOC}(2q+1) &= (2q+1) \left(\frac{(2q)!}{2^q q!} \left( \sum_n \frac{1}{2} \hat{a}_n^2 A_n^2 \right)^q \left( \sum_l \frac{1}{2} \hat{a}_l^2 B_{l,l}\right) \right.\nonumber\\ &\quad + \frac{(2q)!}{2^{q-1} (q-1)!} \left(1- \delta_{q,0} \right) \left( \sum_n \frac{1}{2} \hat{a}_n^2 A_n^2 \right)^{q-1} \nonumber\\ &\quad \left.\times \left( \sum_l \sum_m \frac{1}{4} \hat{a}_l^2 \hat{a}_m^2 A_l A_m ( B_{l,m} + \beta_{l,m}^{(+)} ) \right)\right), \end{align}
where the Kronecker delta in the second term comes from the fact that the term is absent when  $q = 0$. Clearly the odd moments of
 $v_y^{(s)}$ are zero if the sums in (B8) involving
 $B_{l,l}$ and
 $B_{l,m} + \beta _{l,m}^{(+)}$ are zero, and to complete the proof that the PDF of
 $v_y^{(s)}$ is the same to second order as to first order, we therefore simply need to show that these sums vanish. Employing the definition of
 $B_{l,m}$, the sum-to-integral-conversion rule (4.6) and the decomposition of the JONSWAP spectrum
 $J(\omega ,\theta ) = S(\omega ) D(\theta )$ yields
 \begin{align} \sum_l \frac{1}{2} \hat{a}_l^2 B_{l,l} = \sum_l \frac{1}{2} \hat{a}_l^2 \omega_l | \boldsymbol{k}_l | \sin(\theta_l) = \frac{1}{g} \int_{0}^{\infty} \omega^2 S(\omega) \,\mathrm{d} \omega \int_{-{\rm \pi}}^{\rm \pi} D(\theta) \sin(\theta) \,\mathrm{d} \theta= 0, \end{align}
where the last equality follows from the fact that  $D(\theta )$ is an even function while
 $\sin (\theta )$ is an odd function. To show that the sum in (B8) involving
 $B_{l,m} + \beta _{l,m}^{(+)}$ is zero, we start by using the definition of
 $A_n$ and the conversion rule (4.6) twice, which gives
 \begin{equation} \sum_l \sum_m \frac{1}{4} \hat{a}_l^2 \hat{a}_m^2 A_l A_m (B_{l,m} + \beta_{l,m}^{(+)}) = \int_{0}^{\infty} \int_{0}^{\infty} S(\omega_l) S(\omega_m) I(\omega_l, \omega_m) \,\mathrm{d} \omega_l \,\mathrm{d} \omega_m, \end{equation}
where the quantity  $I(\omega _l, \omega _m)$ is defined as
 \begin{align} I(\omega_l, \omega_m) &= \int_{-{\rm \pi}}^{\rm \pi} \int_{-{\rm \pi}}^{\rm \pi} ( D(\theta_l) D(\theta_m) A(\omega_l, \theta_l) A(\omega_m, \theta_m) \vphantom{\left( B(\omega_l, \omega_m, \theta_l, \theta_m) + \beta^{(+)}(\omega_l, \omega_m, \theta_l, \theta_m) \right)}\nonumber\\ &\quad \times( B(\omega_l, \omega_m, \theta_l, \theta_m) + \beta^{(+)}(\omega_l, \omega_m, \theta_l, \theta_m)) )\, \mathrm{d} \theta_l \,\mathrm{d} \theta_m. \end{align}
Finally, we note that  $D(\theta )$ is an even function and that
 $A(\omega _l, \theta _l)$,
 $B(\omega _l, \omega _m, \theta _l, \theta _m)$ and
 $\beta ^{(+)}(\omega _l, \omega _m, \theta _l, \theta _m)$ all change sign under the reflection of coordinates
 $(\theta _l, \theta _m) \rightarrow (- \theta _l, -\theta _m)$. As such, the integrand in (B11) changes sign under the substitution
 $(\theta _l, \theta _m) \rightarrow (- \theta _l, -\theta _m)$, and, therefore, we have
 $I(\omega _l, \omega _m) = 0$ regardless of the values of
 $\omega _l$ and
 $\omega _m$. In total we have thus shown that
 $\text {SOC}(p) = 0$ for both even and odd values of
 $p$, and this implies that the PDF of
 $v_y^{(s)}$ is the same to second order as to first order. We stress, however, that the result relies heavily on the fact that the directional distribution of the wave field is an even function, and does not hold for arbitrary directional distributions.