Introduction
Nitrogen (N) fertilizer plays an important role in ensuring food security, whilst excessive application leads to a series of edaphic and eco-environmental problems (Guo et al., Reference Guo, Liu, Zhang, Shen, Han, Zhang, Christie, Goulding, Vitousek and Zhang2010; Cui et al., Reference Cui, Yue, Wang, Meng, Wu, Yang, Zhang, Li, Zhang and Chen2013, Reference Cui, Zhang, Chen, Zhang, Ma, Huang, Zhang, Mi, Miao, Li, Gao, Yang, Wang, Ye, Guo, Lu, Huang, Lv, Sun, Liu, Peng, Ren, Li, Deng, Shi, Zhang, Yang, Tang, Wei, Jia, Zhang, He, Tong, Tang, Zhong, Liu, Cao, Kou, Ying, Yin, Jiao, Zhang, Fan, Jiang, Zhang and Dou2018; Norse and Ju, Reference Norse and Ju2015; Reis et al., Reference Reis, Bekunda Mateete, Howard, Karanja, Winiwarter, Yan, Bleeker and Sutton2016). The long-term effects of overuse of N fertilizer on soil chemical quality are mainly reflected in two aspects. Firstly, soil pH declined with the increase of N application due to the rise of nitrification of NH4+-N to NO3−-N (Yuan et al., Reference Yuan, Xu, Wang and Li2011; Hao et al., Reference Hao, Zhu, Zeng, Shen, Shi, Liu, Zhang and de Vires2019). Secondly, N application could influence the accumulation of soil organic carbon (SOC) mainly by affecting the residue returning and soil native carbon mineralization (Zang et al., Reference Zang, Blagodatskaya, Wang, Xu and Kuzyakov2017; Bowsher et al., Reference Bowsher, Evans, Tiemann and Friesen2018; Xiao et al., Reference Xiao, Zang, Ge, Chen, Zhu, Zhou, Atere, Wu, Su and Kuzyakov2019). The response of crop yield to N fertilizer can be described by linear + platform or quadratic curve models (Zingore et al., Reference Zingore, Murwira, Delve and Giller2007; Cui et al., Reference Cui, Yue, Wang, Meng, Wu, Yang, Zhang, Li, Zhang and Chen2013). Therefore, N management in farmlands is critical to achieve both food production and environmental sustainability.
Biochar, a C-rich product transformed from biomass through anaerobic pyrolysis, with subsequent use as an agricultural soil amendment to ameliorate soil quality, can increase crop productivity and mitigate greenhouse gas emissions (Glaser et al., Reference Glaser, Lehmann and Zech2002; Lehmann et al., Reference Lehmann, Gaunt and Rondon2006; Lehmann and Joseph, Reference Lehmann and Joseph2015; He et al., Reference He, Zhou, Jiang, Li, Du, Zhou, Shao, Wang, Xu, Bai, Wallace and Xu2017; Shi et al., Reference Shi, Ju, Bian, Li, Joseph, Mitchell, Munroe, Taherymoosavi and Pan2020). A meta-analysis reported that crop yield was increased by 10% averagely with biochar addition (Jeffery et al., Reference Jeffery, Verheijen, Van der Velde and Bastos2011), despite the latitude, soil properties, biochar qualities and input rate, biochar and N interaction led to the increment variable (Jeffery et al., Reference Jeffery, Verheijen, Van der Velde and Bastos2011, Reference Jeffery, Abalos, Prodana, Bastos, Groenigen, Hungate and Verheijen2017). The most likely explanations for the increase in crop yield caused by biochar addition were: (1) the liming effect of acidizing restricted soils; (2) improved water holding capacity of sandy soils; (3) improved nutrient availability by reducing leaching loss and (4) aided root growth to enhance absorption capacity, due to the high pH and functionalized porous surfaces (Laird et al., Reference Laird, Fleming, Davis, Horton, Wang and Karlen2010; Jeffery et al., Reference Jeffery, Verheijen, Van der Velde and Bastos2011; Biederman and Harpole, Reference Biederman and Harpole2013; Agegnehu et al., Reference Agegnehu, Bass, Nelson and Bird2016; Obia et al., Reference Obia, Mulder, Martinsen, Cornelissen and Børresen2016; Jin et al., Reference Jin, Chen, Chen, Hopkins, Zhang, Han, Jiang and Billy2019; Shi et al., Reference Shi, Ju, Bian, Li, Joseph, Mitchell, Munroe, Taherymoosavi and Pan2020). However, few researchers found that crop yields or vegetative growth with biochar input were decreased or shown no significant difference with no-biochar treatment in fertile alkaline/N-poor soils (Asai et al., Reference Asai, Samson, Stephan, Songyikhangsuthor, Homma, Kiyono, Inoue, Shiraiwa and Horie2009; Van Zwieten et al., Reference Van Zwieten, Kimber, Morris, Chan, Downie, Rust, Joseph and Cowie2010; Zhu et al., Reference Zhu, Peng, Huang, Xie and Holden2014). The decrease could be caused by short-term reductions of available N resulted from the high C/N ratio of biochar (Lehmann et al., Reference Lehmann, Gaunt and Rondon2006; Bruun et al., Reference Bruun, Ambus, Egsgaard and Hauggaard-Nielsen2012; Tammeorg et al., Reference Tammeorg, Simojoki, Mäkelä, Stoddard, Alakukku and Helenius2014).
Biochar addition was responsible for enhancing SOC, soil pH and available nutrient pools because of its characteristics of high pH, high and stable C content (Biederman and Harpole, Reference Biederman and Harpole2013; Agegnehu et al., Reference Agegnehu, Bass, Nelson and Bird2016; Jin et al., Reference Jin, Chen, Chen, Hopkins, Zhang, Han, Jiang and Billy2019). However, currently biochar effects have been derived mostly from small plots or short-term field studies located in tropical or subtropical regions in acid or sandy soils (Atkinson et al., Reference Atkinson, Fitzgerald and Hipps2010; Obia et al., Reference Obia, Mulder, Martinsen, Cornelissen and Børresen2016; Zhang et al., Reference Zhang, Yan, Niu, Liu, Van Zwieten, Chen, Bian, Cheng, Li, Joseph, Zheng, Zhang, Zheng, Crowley, Filley and Pan2016a; Haider et al., Reference Haider, Steffens, Moser, Müller and Kammann2017; Jin et al., Reference Jin, Chen, Chen, Hopkins, Zhang, Han, Jiang and Billy2019). Long-term performances of biochar addition and N regulation on calcareous alkaline soils in the North China Plain (NCP), which was one of the major grain production base in China (Chen et al., Reference Chen, Zhang, Shao, Sun, Niu and Liu2020) with temperate climate, were urgently need to be evaluated.
We hypothesize that biochar addition could enhance soil chemical quality, including SOC, total N (TN), Olsen-P, available-K content and soil pH, to support high-yielding crop production in a long-term field trial study. A field experiment was designed with aims to: (1) confirm the changes in soil chemical properties under N fertilizer and biochar fertilization and (2) analyse the response of wheat and maize yield and their relationship with soil mineral nitrogen on a calcareous alkaline soils in a temperate region.
Materials and methods
Experimental site
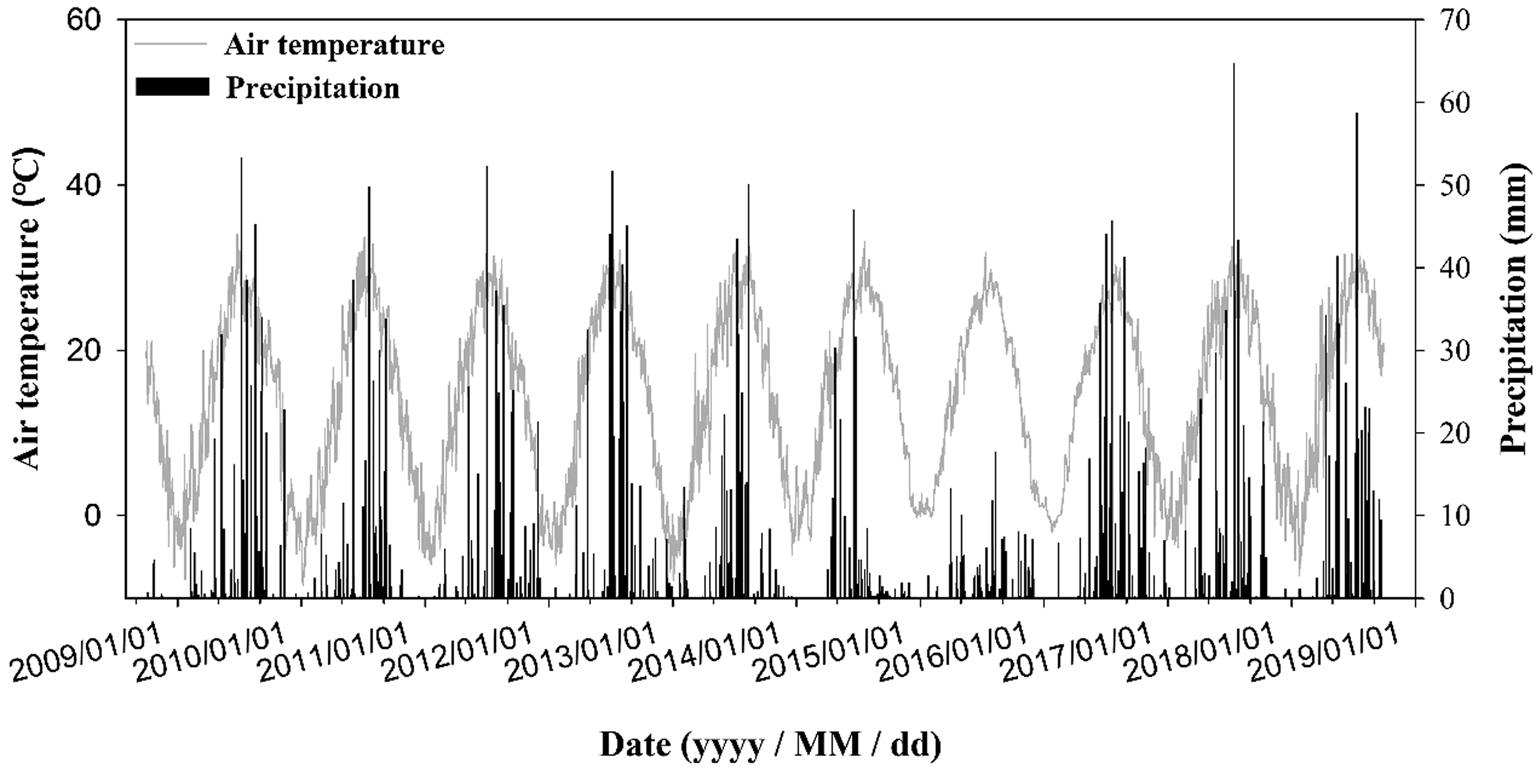
The study, with a winter wheat (Triticum aestivum L.) and summer maize (Zea mays L.) rotation system, was carried out in Quzhou county (36.5°N, 115.0°E), Hebei Province, in the centre of the NCP, initiated in Oct 2008. Annually, the mean precipitation was 473 (range of 234–792) mm, and with the mean temperature of 13.8 (range of 12.1–15.6) °C since 1980–2018. The daily precipitation and air temperature during the experiment are shown in Fig. 1. The soil was classified as a calcareous alluvial soil. Initial soil properties of 0–15 cm depth were as follows: soil pH (1 : 2.50 wt/vol) was 8.52, state SOC was 8.19 g/kg, TN was 1.27 g/kg, Olsen-P was 9.85 mg/kg and available-K was 160.00 mg/kg.
Daily air temperature and precipitation of the wheat–maize rotation system during 2008–2018.

Experimental design
The field experiment consisted of two biochar rates: 0 and 3.20 t C/ha/year; five N levels: 0 (N0), 60 (N60), 120 (N120), 180 (N180) and 240 (N240) kg N/ha/season. Totally, there are ten treatments, with three replicates in a randomized block design. The plot area was 50 m2 (4 × 12.5 m).
The wheat cultivar was Liangxing 99, sown at a rate of c. 102 kg/ha with a row spacing of 15 cm from the mid-Oct to early-Jun next year. The maize cultivar was ZhengDan 958, with a planting density of c. 75 000 seeds per ha with 60 cm row spacing and 22 cm planting distance from the mid-Jun to early-Oct.
The commercial-scale biochar was made from 70% maize straw and 30% straw dust through pyrolysis at 450–500°C (Che Er Ying Bioenergy Station, Beijing, China), with a pH of 8.30 and contained 686.3 g/kg total C and 12.6 g/kg TN. Biochar was annually applied at the beginning of the wheat growing seasons, together with 40% of total N fertilizer (the remaining were added as supplemental fertilizer at stem elongation stage) and all of the phosphorus (P) and potassium (K) fertilizer. Basal fertilizers were broadcast onto the soil surface and then incorporated to a depth of 15–20 cm through rotary tillage. In maize growing seasons, 1/3 of total N, 1/2 of total K and all of the P fertilizers were applied as seeding fertilizer, the remaining were added at twelfth leaf (V12) stage. There was no tillage throughout the growing season. The chemical fertilizers’ application rates and date, and other field management practices were described in detail in a previous study (Wei et al., Reference Wei, Yang, Fan, Chen, Guo, Cao and Kuzyakov2020). All treatments were treated with the same fertilization and management practices in every cropping rotation.
Yield determination and plant sample analysis
Wheat and maize grain yield were estimated during 2008–2018 as per the description in Wei et al. (Reference Wei, Yang, Fan, Chen, Guo, Cao and Kuzyakov2020). Briefly, a certain area in the centre of the individual plots was harvested manually for wheat and maize; then grains were oven-dried at 70°C and adjusted to appropriate moisture contents (14% for wheat; 15% for maize) to estimate crop yield. Spike/ear number per m2 was calculated by manually counting the tillers in a 1 m sample section. The number of grains/spike or ear was recorded by counting the grains on every spike/ear from 30 randomly selected plants. The 1000-kernel weight was determined from the weight of three sets of 500 kernels in each plot (Lu et al., Reference Lu, Lu, Yan, Cui and Chen2014; Yan et al., Reference Yan, Yue, Qiu, Chen, Cui and Chen2014).
Above-ground samples of the plant were obtained by harvesting a 1 m sample section at stem elongation, anthesis and maturity stages in wheat seasons, and six plants at six leaf (V6), V12, tasseling (Vt), milk (R3) and physiological maturity (R6) in maize seasons to determine crop biomass during 2008–2018. Plant N concentration was measured using the Kjeldahl procedure.
Soil sample collection and analysis
Soil samples of 0–100 cm (0–15, 15–30, 30–50, 50–75 and 75–100 cm) were collected from each plot at the critical crop growth stages mentioned above during 2010–2016. Fresh soil samples were homogenized and passed through a 5 mm sieve, then immediately extracted with 0.01 m CaCl2 solution (soil : CaCl2 solution = 1 : 10, wt/vol). Soil mineral N (Nmin) in the extracts was determined using a continuous flow analyzer (TRAACS 2000, Bran and Luebbe, Norderstedt, Germany). Soil samples of 0–15 cm were taken to measure SOC, TN, Olsen-P (0.50 m NaHCO3-extraction), available-K (1.00 m NH4OAc-extraction) and pH value in 2016. SOC and TN were determined using a C/N analyzer (Vario Macro, Elementar, Germany). Before measuring, samples were pretreated with 0.50 m HCl to remove carbonate (Chen et al., Reference Chen, Hou, Gong, Li, Fan and Kuzyakov2009), then oven-dried, ball-milled and instrument-tested.
Statistical analysis
The differences in crop yield and yield components, soil chemical property indicators among all treatments were determined by the least significant difference at a 0.05 level. The crop yield response curves to Nmin concentration without and with biochar were analysed using the NLIN procedure in SAS (SAS Institute INC., Cary, NC, USA). All data were plotted using SigmaPlot 12.0 software (Systat Software Inc., Erkrath, Germany).
Results
Wheat and maize growth responsiveness to fertilization
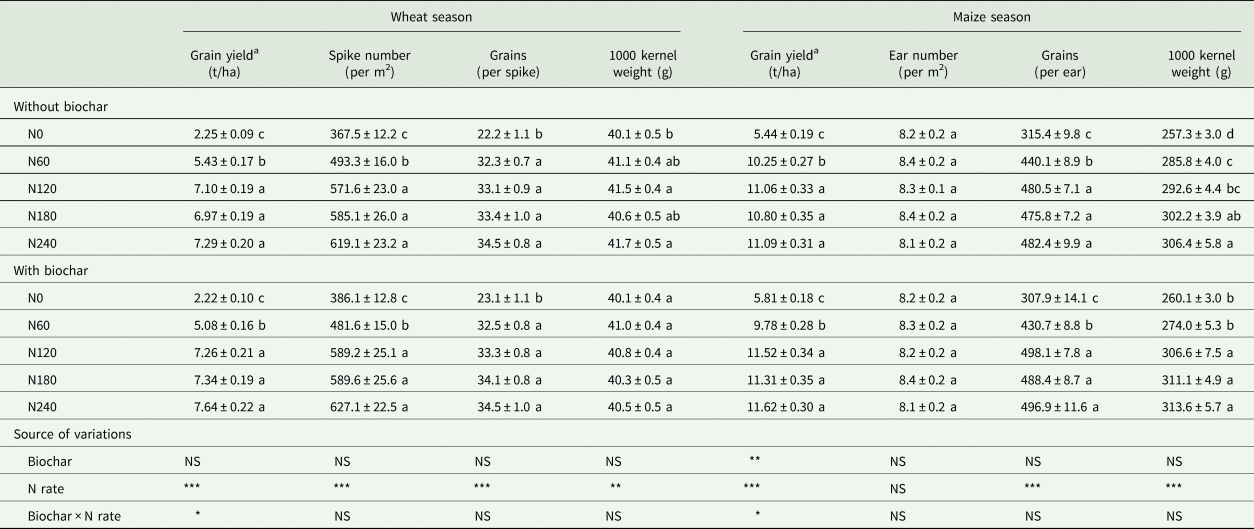
The mean crop grain yield and yield components during 2008–2018 are shown in Table 1. For wheat, the grain yield was enhanced along with the increase of N levels, and no significant differences were observed after N rate reached over 120 kg N/ha whether without or with biochar, in the order of N240, N180, N120 > N60 > N0. Biochar input did not have a significant impact on yield. On average, the yield was 5.81 t/ha without biochar, ranged from 2.09 t/ha at N0 to 7.29 t/ha at N240. It was 5.91 (2.22–7.64) t/ha with biochar.
Mean wheat, maize grain yield and yield components during 2008–2018

Date are mean ± s.e. (standard error) (n = 30). Different letters indicate significant difference among N levels without or with biochar at P < 0.05 level. NS indicate not significant, * indicate significant at P < 0.05, ** indicate significant at P < 0.01, *** indicate significant at P < 0.001.
a Data of grain yield in every year were reported in Wei et al. (Reference Wei, Yang, Fan, Chen, Guo, Cao and Kuzyakov2020).
The spike number was in the order of N240, N180, N120 > N60 > N0 with average spike number 527.3 (367.5–619.1) per m2 without biochar, and 534.8 (386.1–627.2) per m2 with biochar. Grains/spike at N0 was the lowest, whilst there were no significant differences among N60, N120, N180 and N240. Nitrogen application increased grains/spike by 50 and 45% in contrast to N0 for without and with biochar, respectively. However, negligible effects of N and biochar fertilization on 1000-kernel weight were observed.
For maize, the grain yield was affected by N application, biochar input and interaction between them. The yield of maize was in the order of N240, N180, N120 > N60 > N0 whether without or with biochar, the mean yields were 9.73 (5.44–11.09) t/ha and 10.01 (5.81–11.62) t/ha for without and with biochar, respectively.
Grains/ear and 1000-kernel weight became the significant positive factors for maize production. There were no significant differences among all treatments for ear number resulted from artificial engraftment. The change of grain number/ear and 1000-kernel weight showed a consistent trend with grain yield (Table 1).
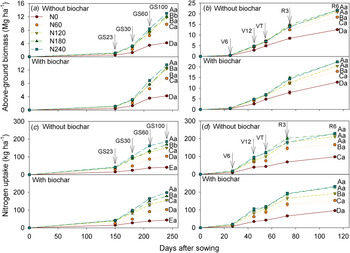
Dynamics of crop above-ground biomass are shown in Figs 2(a) and (b). Understandably, N0 showed the lowest growth rate over the entire crop growth period. For wheat, biomass accumulation was relatively small (<3 t/ha); before the stem elongation stage whether without or with biochar, it accounted for about 23–30% of the total biomass. More than 70% of total biomass accumulation at maturity was obtained for the next 2-months, and the differences among N levels were increased during this period. Biomass of different N levels at maturity was as follows: N240 (13.31 t/ha) > N180 (12.41 t/ha), N120 (12.09 t/ha) > N60 (9.61 t/ha) > N0 (4.22 t/ha), whilst there were tiny differences between without and with biochar (10.28 v. 10.73 t/ha, on average) excluding at N60 (Fig. 2(a)).
(Colour online) Mean accumulation of wheat biomass (a), maize biomass (b) and amount of nitrogen uptake in wheat (c) and maize seasons (d) of different nitrogen fertilizer rates and without and with biochar application through the growing seasons during 2008–2018. Date are mean ± s.e. (standard error) (n = 30). Different capital letters indicate significant difference among N levels at P < 0.05 level, different lowercase letters indicate significant difference between without and with biochar at P < 0.05 level at maturity stage of crops. Pre-winter, stem elongation, anthesis and maturity are indicated by GS23, GS30, GS60 and GS100, respectively; V6, V12, VT, R3 and R6 refer to the six-leaf, twelve-leaf, flowering, milk ripe and maturity stages, respectively.

For maize, biomass accumulation was relatively faster before R3 stage whether without or with biochar. Biomass at maturity of different N levels was as follows: N240 (21.99 t/ha), N180 (21.98 t/ha) > N120 (20.63 t/ha) > N60 (18.12 t/ha) > N0 (12.67 t/ha), and no significant difference between without and with biochar addition (19.03 v. 19.13 t/ha, on average) as well (Fig. 2(b)).
Dynamics of crop N uptake showed that N uptake was increased fast at first, and then became slow, which indicated that N uptake in the reproductive growth stage of crops mainly depends on within-plant N translocation. Overall, N uptake rates at maturity were enhanced along with the increase of N levels (N240 > N180 > N120 > N60 > N0 for wheat, and N240, N180 > N120 > N60 > N0 for maize). Biochar input could increase the amount of total N uptake in wheat season by 5 (3–7)% excluding at N60, but not in maize season (186.12 v. 180.35 kg/ha, on average) (Figs 2(c) and (d)).
Wheat and maize yield response to soil Nmin concentration of crop root layer
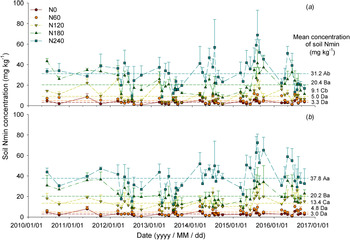
Soil Nmin concentration of crop root layer was measured at critical growth stages; the results showed that multiple changing points were occurred caused by fertilization and/or irrigation events during 2010–2016 (Fig. 3). Nitrogen application led to a significant increase in Nmin concentration whether without or with biochar (N240 > N180 > N120 > N60, N0). Among all critical growth stages at all N levels, N0 always maintains the lowest value of 3.30 mg/kg without biochar, and 2.97 mg/kg with biochar on average. N240 normally achieved the highest value reaching 68.85 and 72.43 mg/kg for without and with biochar, respectively. On average, biochar input significantly increased Nmin concentration by 21 and 47% at 120 and 240 kg N/ha, respectively, but not at low N levels.
(Colour online) Dynamics of soil Nmin concentration of crop root layer under various nitrogen fertilizer rates without (a) and with (b) biochar application through the wheat-maize growing seasons during 2010–2016. Date are mean ± s.e. (standard error) (n = 3). The black arrows represent irrigation events. Different capital letters indicate significant difference among N levels at P < 0.05 level, different lowercase letters indicate significant difference between without and with biochar at P < 0.05 level.

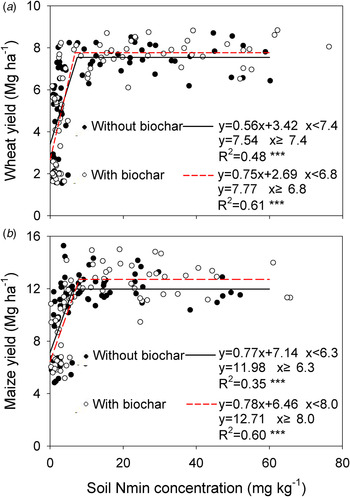
A linear plateau model was used to generate the mean yield response curve to soil Nmin concentration of crop root layer at maturity stage (Fig. 4). The results suggested that crop yield increased significantly with the increase of soil Nmin concentration, and then remained stable at a critical value. The critical points were 7.37 and 6.77 mg/kg for without and with biochar in wheat season, and 6.28 and 7.98 mg/kg for without and with biochar in maize season. A very slight positive response of crop yield to biochar addition was observed at high Nmin concentration, and the increment was 0.96 t/ha in a rotation based on the value of simulation.
(Colour online) Relationships of soil Nmin concentration of crop root layer at maturity stage and wheat (a) and maize (b) yields under various nitrogen fertilizer rates without and with biochar application.

Changes in soil chemical quality as affected by fertilization
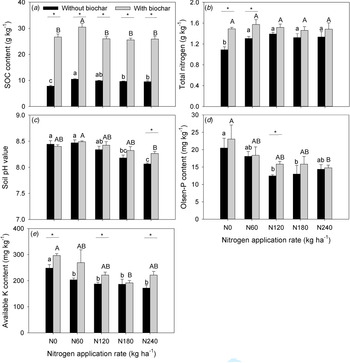
Soil chemical properties, including SOC, TN, Olsen-P, available-K and pH, were measured after eight rotations (Fig. 5). Nitrogen application increased SOC content significantly by 26% compared to N0 under without biochar. Compared to treatment without biochar, biochar input significantly enhanced SOC, reaching 26.89 g/kg on average. The highest SOC was obtained at N60 whether without or with biochar (10.79 v. 9.22 g/kg without biochar, 30.45 v. 26.00 g kg with biochar) (Fig. 5(a)).
Effects of nitrogen fertilizer rates and biochar application on SOC content, soil total nitrogen (N) content, pH value, soil Olsen-P and available-K to 15 cm depth after eight rotations. Different lowercase letters indicate significant difference among N levels without biochar at P < 0.05 level, different capital letters indicate significant difference among N levels with biochar at P < 0.05 level. *Indicate significant difference between without and with biochar at P < 0.05.

Nitrogen application also increased TN content significantly in contrast to N0 without biochar, but there were no differences among N60, N120, N180 and N240. Compared to treatment without biochar, biochar addition enhanced TN significantly only at N0 and N60, and no differences were observed among treatments with biochar at different N levels. Compared to the initial value, fertilization increased TN by 13% (ranged of 3–24%) excluded N0 without biochar, which caused the decline in TN by 14% (Fig. 5(b)).
Soil pH value showed a decline trend with the increase of N levels without biochar; the gap between N240 and N0 reached 0.38. The decline in soil pH caused by N application was minimized by biochar addition, especially at high N levels (Fig. 5(c)).
In terms of soil Olsen-P and available-K content, they remained at a high level (>12 mg/kg for Olsen-P, >171 mg/kg for available-K), although the trend of decrease was observed with the increase of N application. Biochar input increased soil Olsen-P and available-K content at several N levels (Figs 5(d) and (e)). These results led to an important implication that biochar might have a capacity to ameliorate soil properties to maintain soil productivity at N-deficient situation.
Discussion
Effects of N and biochar fertilization on crop production
In this study, because of the increase in both the spike number per area and grains per spike, N application increased wheat yield by 198 and 208% on average for without and with biochar, respectively (Table 1). Previous studies in the NCP supported our results (Lu et al., Reference Lu, Lu, Yan, Cui and Chen2014, Reference Lu, Yue, Lu, Cui, Liu, Zou and Chen2016). Among all wheat yield components, spike number was the most sensitive index response to management practices, which was strongly correlated with the grain yield (Ye et al., Reference Ye, Wang, Huang, Zhu, Meng, Chen, Zhang and Cui2011; Lu et al., Reference Lu, Yue, Lu, Cui, Liu, Zou and Chen2016), and the reduction in yield caused by it cannot be compensated by the other two factors (Sreenivasulu and Schnurbusch, Reference Sreenivasulu and Schnurbusch2012). However, the increase in maize yield caused by N application mainly resulted from the addition of grains per ear and 1000-kernel weight whether without or with biochar. No significant differences in crop yield components were observed between without and with biochar in wheat and maize seasons (Table 1). Crop yield showed a significant correlation with soil Nmin concentration of crop root layer at maturity, and the optimal concentration of soil Nmin based on crop yield was obtained around at 120 kg N/ha/season, especially with biochar, which led to an increase in crop yield by 0.96 t/ha in a rotation (Figs 3 and 4). Moreover, a slight decrease in crop yield at N60 with biochar was observed, as well as soil Nmin concentration of crop root layer (Table 1; Fig. 3). The reduction of available N resulted from the high C/N ratio of biochar in short term (Lehmann et al., Reference Lehmann, Gaunt and Rondon2006; Bruun et al., Reference Bruun, Ambus, Egsgaard and Hauggaard-Nielsen2012; Tammeorg et al., Reference Tammeorg, Simojoki, Mäkelä, Stoddard, Alakukku and Helenius2014) was the probable cause. Compared to the farmers' practices in Quzhou county, which were with 304 kg N/ha, irrigate and fertilize in spring at the standing stage in wheat season; and with 223 kg N/ha, and with planting density of 60 000 plants/ha in maize season, N120 increased wheat and maize yield by 11% (7.10 v. 6.40 t/ha) and 56% (11.06 v. 7.10 t/ha) without biochar, they were 13 and 62% with biochar, respectively. Meanwhile, the decline of N fertilizer rates were 61% (120 v. 304 kg/ha) in wheat season and 46% (120 v. 223 kg/ha) in maize season in contrast to farmers' practices in Quzhou county (this study; Zhang et al., Reference Zhang, Cao, Li, Zhang, Wang, Liu, Chen, Cui, Shen, Jiang, Mi, Miao, Zhang and Dou2016b).
The biomass accumulation and N uptake varied for different N levels at different crop stages (Fig. 2). Dressing N fertilizer could alleviate the competition for N to some extent and guarantee a higher tiller survival ratio of wheat (Xu et al., Reference Xu, Yu and Zhao2013; Lu et al., Reference Lu, Yue, Lu, Cui, Liu, Zou and Chen2016) for improving accumulation of crop biomass and N uptake. The relative higher and suitable air temperature and rainfall could promote the rapid accumulation of crop biomass and N uptake (Meng et al., Reference Meng, Sun, Chen, Cui, Yue, Zhang and Römheld2012; Lu et al., Reference Lu, Yue, Lu, Cui, Liu, Zou and Chen2016; Tian et al., Reference Tian, Zhu, Nie, Xu, Meng and Wang2019). Therefore, the changes in biomass accumulation in different crop stages could be explained by seasonal variability in weather: the mean air temperature and precipitation during stem elongation to maturity were 19°C and 74 mm; they were only 6°C and 58 mm during sowing to stem elongation in wheat season. The mean air temperature was 27 v. 21°C, and precipitation was 285 v. 42 mm of seeding to R3 and R3 to R6 in maize season (Fig. 1). However, there were imperceptible changes in biomass accumulation and N uptake between without and with biochar (Fig. 2).
Studies of Lu et al. (Reference Lu, Lu, Yan, Cui and Chen2014) and Yan et al. (Reference Yan, Yue, Qiu, Chen, Cui and Chen2014) found that the optimal Nmin concentration for wheat and maize production was around 10–15 mg/kg, which has been shown the favourable concentration for manipulating root growth (Shen et al., Reference Shen, Li, Mi, Li, Yuan, Jiang and Zhang2013), and regulating the biological potential of roots for mobilization and acquisition of soil nutrients efficiently (Shen et al., Reference Shen, Li, Mi, Li, Yuan, Jiang and Zhang2013; Qi et al., Reference Qi, Hu, Song and Zhang2019). These results indicate that the soil Nmin concentration at N180 and N240 addition was not a limiting factor for crop production, but that there must be other indirect indicators in action, such as soil biological and physical quality.
Effects of N and biochar fertilization on soil chemical quality
SOC and pH are important indexes to evaluate the effects of carbon and N inputs on soil health, which were affected by N and biochar fertilization in this study. Firstly, N fertilization was also an important factor to promote the increase of SOC content. Compared to the values of original and N0 without biochar, N application enhanced SOC by 21 and 26%, respectively. Biochar addition significantly enhanced SOC content by 189% on average compared to without biochar (Fig. 5(a)) due to the high content (686.30 g/kg) and high C/N ratio (55 : 1) of biochar (this study), as well as the stability of biochar (Lehmann et al., Reference Lehmann, Gaunt and Rondon2006). The result was supported by numerous previous studies (Lehmann et al., Reference Lehmann, Gaunt and Rondon2006; Laird et al., Reference Laird, Fleming, Davis, Horton, Wang and Karlen2010; Biederman and Harpole, Reference Biederman and Harpole2013; Agegnehu et al., Reference Agegnehu, Bass, Nelson and Bird2016; Jin et al., Reference Jin, Chen, Chen, Hopkins, Zhang, Han, Jiang and Billy2019; Shi et al., Reference Shi, Ju, Bian, Li, Joseph, Mitchell, Munroe, Taherymoosavi and Pan2020). The highest SOC was observed at N60 whether without or with biochar (Fig. 5(a)), which could be mainly explained by an increase in residue returning resulted from the promotion in root biomass and rhizodeposition under moderate N deficiency (Zang et al., Reference Zang, Blagodatskaya, Wang, Xu and Kuzyakov2017; Bowsher et al., Reference Bowsher, Evans, Tiemann and Friesen2018; Xiao et al., Reference Xiao, Zang, Ge, Chen, Zhu, Zhou, Atere, Wu, Su and Kuzyakov2019). Xiao et al. (Reference Xiao, Zang, Ge, Chen, Zhu, Zhou, Atere, Wu, Su and Kuzyakov2019) concluded that N application raised the belowground C input mainly by increasing root biomass (c. 60%) rather than rhizodeposition. In this study, the root phenotype and dry weight per plant under different N levels could also prove the root biomass returning at N60, which may contribute to the increase in SOC (Fig. S1). However, some study found that N levels showed no effect on total C content (Borges et al., Reference Borges, De Oliveira Bordonal, Silveira and Coutinho2019); they speculated that the acceleration of the decomposition rate induced by N fertilization may offset the enhanced SOC content in grassland of tropical regions. Moreover, because of the direct N input (c. 40 kg N/year, this study) and slower N cycling with a high C/N ratio (Lehmann et al., Reference Lehmann, Gaunt and Rondon2006), biochar addition significantly enhanced soil TN content at N0 and N60 (Fig. 5(b)).
Secondly, excessive application of N fertilizer is an important factor resulted in the acidification of agricultural soils in China (Guo et al., Reference Guo, Liu, Zhang, Shen, Han, Zhang, Christie, Goulding, Vitousek and Zhang2010; Zhu et al., Reference Zhu, De Vries, Liu, Hao, Zeng, Shen and Zhang2018). In this study, N fertilization declined soil pH from 8.46 of N0 to 8.06 of N240 without biochar. However, biochar addition partly offset the decrease in soil pH, especially under high N rate (N240), the decrease from N0 to N240 was only 0.13 units (Fig. 5(c)), which was one of the reasons to explain the increase in crop production of biochar addition in acidic soils (Jeffery et al., Reference Jeffery, Verheijen, Van der Velde and Bastos2011, Reference Jeffery, Abalos, Prodana, Bastos, Groenigen, Hungate and Verheijen2017). However, the increased soil pH caused by biochar addition could lead to a large increase in ammonia volatilization in alkaline soils (Dendooven et al., Reference Dendooven, Alcántara-Hernández, Valenzuela-Encinas, Luna-Guido, Perez-Guevara and Marsch2010; Sun et al., Reference Sun, Lu, Chu, Shao and Shi2017; Wei et al., Reference Wei, Yang, Fan, Chen, Guo, Cao and Kuzyakov2020). In terms of soil Olsen-P and available-K content, they are generally maintained at a high level due to soil foundation properties and fertilization strategies, and more or less, biochar addition showed an improvement in them resulting from its own nutrients application and adsorption to reduced losses (Figs 5(d) and (e); Biederman and Harpole, Reference Biederman and Harpole2013; Agegnehu et al., Reference Agegnehu, Bass, Nelson and Bird2016; Jin et al., Reference Jin, Chen, Chen, Hopkins, Zhang, Han, Jiang and Billy2019).
Additionally, biochar addition could also stimulate microbial activities, especially for fungi (Warnock et al., Reference Warnock, Lehmann, Kuyper and Rillig2007; Foster et al., Reference Foster, Hansen, Wallenstein and Cotrufo2016; Jin et al., Reference Jin, Chen, Chen, Hopkins, Zhang, Han, Jiang and Billy2019), boost root growth (Bruun et al., Reference Bruun, Ambus, Egsgaard and Hauggaard-Nielsen2012; Shi et al., Reference Shi, Ju, Bian, Li, Joseph, Mitchell, Munroe, Taherymoosavi and Pan2020), reduce bulk density and increase water-holding capacity (Asai et al., Reference Asai, Samson, Stephan, Songyikhangsuthor, Homma, Kiyono, Inoue, Shiraiwa and Horie2009; Obia et al., Reference Obia, Mulder, Martinsen, Cornelissen and Børresen2016). These changes in soil properties could enhance the growth of crops and crop yield by principle. Although no significant enhancements were observed in this study, which may be because that the mentioned soil properties above were not the key limiting factors for an irrigation system with rotary tillage. Further evidence on the changes in soil biological properties caused by biochar addition, such as microbial biomass, microbial composition and enzyme activity, should be focused based on the field experiment.
Overall, the reasonable N fertilization improved crop growth and soil chemical quality synchronously, whilst no acceleration of crop growth was observed with biochar, although it enhanced soil chemical properties, especially for SOC content and pH value (Figs 2 to 5; Table 1). The probable cause of the effects of N fertilization were that reasonable N fertilization could provide necessary nutrients for the growth of crops (unsuitable application of N fertilizer resulted in nutrient deficiency, or the waste of resources) (Zhang et al., Reference Zhang, Cao, Li, Zhang, Wang, Liu, Chen, Cui, Shen, Jiang, Mi, Miao, Zhang and Dou2016b; Cui et al., Reference Cui, Zhang, Chen, Zhang, Ma, Huang, Zhang, Mi, Miao, Li, Gao, Yang, Wang, Ye, Guo, Lu, Huang, Lv, Sun, Liu, Peng, Ren, Li, Deng, Shi, Zhang, Yang, Tang, Wei, Jia, Zhang, He, Tong, Tang, Zhong, Liu, Cao, Kou, Ying, Yin, Jiao, Zhang, Fan, Jiang, Zhang and Dou2018); and increase the amount of root returning and improve microbial structure in the field (Shen et al., Reference Shen, Li, Mi, Li, Yuan, Jiang and Zhang2013; Xiao et al., Reference Xiao, Zang, Ge, Chen, Zhu, Zhou, Atere, Wu, Su and Kuzyakov2019). However, biochar addition could increase N immobilization, and slowed N cycling (Lehmann et al., Reference Lehmann, Gaunt and Rondon2006; Thomazini et al., Reference Thomazini, Spokas, Hall, Ippolito, Lentz and Novak2015), especially under low N conditions. No increase in soil Nmin at N0 and N60 with biochar was observed. Meanwhile, due to the enhanced adsorption of NO3− and NH4+, biochar addition could reduce the leaching of soil Nmin to deep-soil at high N rates, especially in heavy rain years (Kanthle et al., Reference Kanthle, Lenka and Tedia2018; Wei et al., Reference Wei, Yang, Fan, Chen, Guo, Cao and Kuzyakov2020). Therefore, biochar addition significantly enhanced soil Nmin at N120 and N240. One extra caveat, the treatment of biochar amendment at N180 was designed as a split plot with another treatment, and there is no ridge between plots, which may result in N runoff loss during irrigation or rainfall events. Combined with the conclusions of the studies on optimal soil Nmin concentration for crop production (Lu et al., Reference Lu, Lu, Yan, Cui and Chen2014; Yan et al., Reference Yan, Yue, Qiu, Chen, Cui and Chen2014), it is not difficult to understand that biochar addition did not promote crop growth on calcareous alkaline soils in temperate regions. Even so, because of the characteristics of alkalinity, porosity and high C content of biochar (Lehmann et al., Reference Lehmann, Gaunt and Rondon2006; Wei et al., Reference Wei, Yang, Fan, Chen, Guo, Cao and Kuzyakov2020), it is beneficial to improve soil quality for sustainable agricultural production.
Conclusions
Nitrogen and biochar fertilization are important factors affecting crop yield and soil chemical quality. Because of the increase in both spike number per area and grains per spike for wheat, and grains per ear and 1000-kernel weight for maize, N application increased crop yield as linear plus platform model. Similar trends were observed in dynamics of crop above-ground biomass and N uptake. The optimal root-layer soil Nmin concentration to support high-yielding crop production was achieved around at N120. However, biochar addition showed a negligible effect on crop yield and crop growth, but enhanced SOC significantly, especially at N60, and improved other chemical properties to some extent. Overall, the results provided additional insights into the combined long-term impact of N and biochar fertilization for wheat and maize production on calcareous alkaline soils in temperate regions.
Supplementary material
The supplementary material for this article can be found at https://doi.org/10.1017/S0021859621000277
Financial support
This study was supported by the National Key Research and Development Program of China (2018YFD0300604) and the Foundation for High-level Talents of Qingdao Agricultural University (663/1119025).
Conflict of interest
None.