I. INTRODUCTION
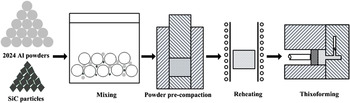
SiC particle-reinforced Al-based composites (SiCp/Al) are attractive in the military, aerospace, and automotive fields because of their high strength, light weight, low thermal expansion, and high wear resistance compared to Al matrix alloys. Reference Ted Guo and Tsao1 Generally, SiCp/Al composites are fabricated by powder metallurgy (PM), Reference Slipenyuk, Kuprin, Milman, Goncharuk and Eckert2 pressureless infiltration, Reference Cheng, Zeng and Liu3 and compound casting. Reference Sajjadi, Ezatpour and Torabi Parizi4 PM processing is known for producing composites with improved mechanical and physical properties because a large range of reinforcement constituents can be distributed homogeneously in the matrix powders. Reference Slipenyuk, Kuprin, Milman, Goncharuk and Eckert2 These improved properties have been demonstrated by experimental results Reference Kumai, Hu, Higo and Nunomura5 and theoretical studies. Reference Borbély, Biermann and Hartmann6 However, PM also increases the production costs because of the complex procedures required, Reference Zu and Luo7 and it is difficult to fabricate large components with complex shapes and compact microstructures. Reference Chen, Yang and Chao8 Thixoforming can increase the compactness of the microstructure and is suitable for the near-net-shape forming of large components with complex shapes. Reference Fan9 The key to this technology is to prepare semisolid ingots with fine spheroidal particles suspended uniformly in the liquid phase. Such a microstructure can be prepared after the green compact is partially remelted at a semisolid temperature. Reference Li, Chen, Zhang and Guan10 Combining the traditional blending and cold-pressing steps of PM with the partial remelting and thixoforging technologies of semisolid forming, a novel semisolid forming technology to prepare and form ceramic particle-reinforced metal matrix composites, powder thixoforming, was developed in the present study. The powder thixoforming process is shown schematically in Fig. 1.
Schematic illustration of powder thixoforming.

Previous investigations focused on the microstructural evolution during partial remelting of the 2024 Al matrix alloy and SiCp/2024 Al-based composites. Reference Li, Chen, Zhang and Guan10–Reference Li, Chen, Ma, Hao and Guan12 The results indicated that a semisolid ingot conducive for thixoforming can be obtained after a green compact is partially remelted. Composites fabricated by powder thixoforming have been reported to have relatively high tensile properties. Reference Chen, Chen, Zhang and Li13 The microstructure and tensile properties of the composites are mainly a function of the processing parameters, such as the reheating temperature, mold temperature, and SiCp volume fraction. Reference Xiong, Xu, Yan, Lu and Cai14 Therefore, the effect of the SiCp volume fraction on the microstructure and tensile properties of SiCp/2024 Al-based composites prepared by powder thixoforming was discussed in the present paper. The other parameters (reheating temperature and mold temperature) will be reported elsewhere.
II. EXPERIMENTAL
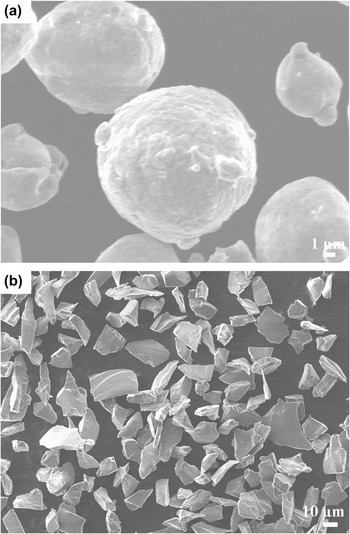
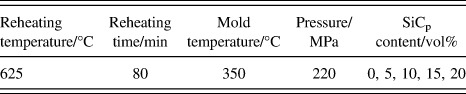
Inert gas-atomized 2024 Al alloy powders (Alp) with a mean particle size of approximately 20 µm were used as the Al matrix. The Alp had the following chemical compositions (wt%): Cu: 4.22, Mg: 1.35, Si: 0.5, Fe: 0.5, and the rest Al. Its solidification range was 498–663 °C. The 2024 Al matrix was reinforced with 5, 10, 15, and 20 vol% SiCp (approximately 15 µm). Figure 2 shows that the morphologies of the Alp and SiCp were spheroidal and angular, respectively. To enhance the wettability between the molten Al matrix and the SiCp and prevent the formation of Al4C3 at the SiC/Al interface, the SiCp were covered with a silicon oxide film obtained by oxidation in an air furnace at 930 °C with a holding time of 5 h. The initial Alp and the oxidized SiCp were blended in a planetary ball-milling machine. The ball-to-powder weight ratio, rotation speed, and milling time were 5:1, 100 rpm, and 30 min, respectively. Eighty grams of each mixture was cold-compacted under a pressure of 200 MPa for 300 s into a green compact which was 45 mm in diameter and 40 mm in height, creating the initial billets for thixoforging. For comparison with the SiCp/2024 Al-based composites, green compacts precompacted from Alp were also prepared under the same conditions. The green compacts were reheated at 625 °C for 80 min to obtain semisolid ingots. These ingots were quickly placed inside a forging mold with a cavity of Ø50 mm × 60 mm and thixoforged under a pressure of 220 MPa for 20 s. The detailed processing parameters are given in Table I.
Morphologies of (a) atomized 2024 Al powders and (b) SiC particles.

Processing parameters used in the present work.

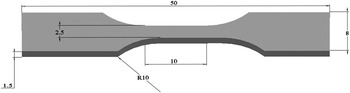
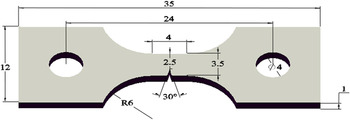
Four tensile specimens were machined from the center region of each thixoforged product, perpendicular to the forging direction. The detailed dimensions of the tensile specimens are shown in Fig. 3. The tensile tests were performed using a universal material testing machine at a loading velocity of 0.5 mm⋅min−1 to obtain the basic tensile properties, including the 0.2% offset yield strength and ultimate tensile strength (UTS). The tensile properties of each thixoforged component were obtained from the average of four testing values. To clarify the effect of the SiCp volume fraction on the fracture mechanisms of the thixoforged composites, the crack initiation and propagation during tensile testing were investigated using in situ tension testing under a scanning electron microscope (SEM). The dimensions of the in situ tensile specimens are given in Fig. 4. The specimens were polished and etched prior to the tensile tests. The in situ tension tests were performed at a loading velocity of 5.5 × 10⁻⁴ mm s−1.
Dimensions of the tensile-testing specimen (unit: mm).

Dimensions of the in situ tensile specimen (unit: mm).

Transmission electron microscopy (TEM) with an energy-dispersed spectroscope (EDS) was used to evaluate the SiC/Al interface. A TEM foil was prepared preferentially by mechanical grinding to a 50 µm thickness. The foil was perforated by sputtering argon ions at 4.5 kV at an incident angle of 5° using beam thinning, followed by final polishing at an incident angle of 3° for at least 2 h. In addition, the SiCp, along with the interfacial reaction products, was extracted electrochemically from the SiCp/2024 Al-based composite using an electrolyte comprising 30 vol% HNO3 in distilled water at a direct-current voltage of 7 V and a current of 5 A. These samples were observed using the SEM and examined by x-ray diffractometry (XRD) to identify the phase constituents of the products.
The fractured specimens were observed using the SEM equipped with an EDS. Specimens were also machined from the center region of the thixoforged products to study the metallographic microstructures and make density measurements. Metallographic samples were finished and polished using standard metallographic techniques and then etched using Keller's etchant. Subsequently, these specimens were observed using an optical microscope. The primary particle size and shape were examined quantitatively. The average particle size D was calculated using the equation:
 $$D = {{\left( {\sum {2\sqrt {{{{A_i}} \mathord{\left/ {\vphantom {{{A_i}} \pi }} \right. \kern-\nulldelimiterspace} \pi }} } } \right)} \mathord{\left/ {\vphantom {{\left( {\sum {2\sqrt {{{{A_i}} \mathord{\left/ {\vphantom {{{A_i}} \pi }} \right. \kern-\nulldelimiterspace} \pi }} } } \right)} N}} \right. \kern-\nulldelimiterspace} N}\quad .$$
The shape factor F of the primary particles was given as:
 $$F = {{\left( {\sum {{{P_i^2} \mathord{\left/ {\vphantom {{P_i^2} {4\pi {A_i}}}} \right. \kern-\nulldelimiterspace} {4\pi {A_i}}}} } \right)} \mathord{\left/ {\vphantom {{\left( {\sum {{{P_i^2} \mathord{\left/ {\vphantom {{P_i^2} {4\pi {A_i}}}} \right. \kern-\nulldelimiterspace} {4\pi {A_i}}}} } \right)} N}} \right. \kern-\nulldelimiterspace} N}\quad .$$
Here, A i and P i are the areas and perimeters of each primary particle, and N is the total number of the primary particles. The shape factor increases if the particles are less spherical.
The density was measured by applying Archimedes' principle. The relative density was calculated by comparing the measured density with the theoretical density. The values of the theoretical density were obtained using the rule of mixtures Reference Daoud15 :
 $${\rho _{\rm{c}}} = {V_{\rm{f}}}{\rho _{\rm{f}}} + {\rho _{\rm{m}}}\left( {1 - {V_{\rm{f}}}} \right)\quad .$$
Here, ρc is the theoretical density of the composite, ρf is the density of the SiCp, ρm is the density of the 2024 Al matrix, and V f is the volume fraction of the SiCp.
III. RESULTS AND DISCUSSION
A. Effect on microstructure
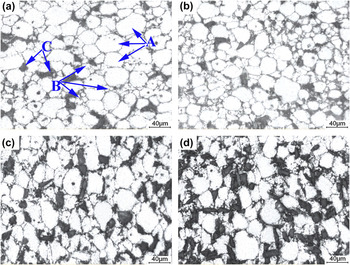
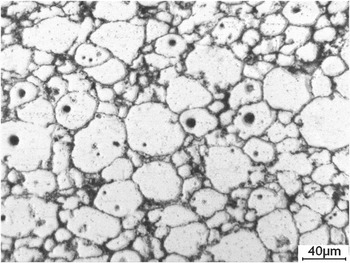
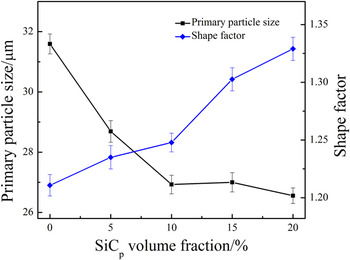
Figure 5 shows micrographs of the thixoforged composites containing different SiCp volume fractions. All of the microstructures were composed of fine primary particles [marked by arrows A in Fig. 5(a)], interparticle secondary solidified structures [marked by arrows B in Fig. 5(a)], and polygonal SiCp in the secondary solidified structures [marked by arrows C in Fig. 5(a)]. Fine spheroidal primary particles were suspended uniformly in the liquid phase in the composite containing 5 vol% SiCp [Fig. 5(a)]. As the volume fraction increased to 10%, the SiCp were still distributed homogeneously in the secondary solidified structures, and the primary particles became irregular [comparing Figs. 5(a) and 5(b)]. As the volume fraction exceeded 10%, the SiCp tended to segregate and cluster at the secondary solidified regions in some local regions [Figs. 5(c) and 5(d)]. Compared with the thixoforged 2024 Al matrix alloy, the primary particles became irregular and the primary particle size slightly decreased as the SiCp volume fraction increased [comparing Figs. 5 and 6]. These variations in the primary particle size and shape are more clearly observed in the quantitative examination results as shown in Fig. 7. Table II shows that the relative density of the thixoforged composites decreased gradually as the SiCp volume fraction increased.
Micrographs of the thixoforged composites containing (a) 5, (b) 10, (c) 15, and (d) 20 vol% SiCp.

Micrograph of the thixoforged 2024 Al matrix alloy.

Variations in the primary particle size and shape factor with SiCp volume fraction.

Variation in the relative density with SiCp volume fraction.

The coarsening mechanisms consisted of the coalescence of neighboring particles through boundary migration or particle rotation and Ostwald ripening realized through the dissolution of small particles and the growth of large particles during partial remelting. Reference Tzimas and Zavaliangos16,Reference Chen, Wang, Ma and Hao17 The addition of the SiCp was beneficial for splitting neighboring α-Al particles from each other, decreasing the contact between them and reducing the coarsening rate, specially the contribution resulting from coalescence. Reference Cai, Tan, Shen and Su18 The effect of Ostwald ripening not only increased the primary particle size, but also contributed to the development of spheroidal particles. The addition of unmelted reinforcing particles decreased the effective diffusion coefficient of the solute atoms in the liquid phase, Reference Chen, Hao and Sun19 impeding the Ostwald ripening. Based on these standpoints, it is easy to understand the present experimental results, the primary particles became irregular and their size decreased as the SiCp content increased. The starting green compacts were prepared by the traditional blending and cold-pressing steps of PM, and their microstructures had a large number of pre-existing pores. The liquid phase fills these pores during partial remelting because pore filling by the liquid phase is an important densification mechanism during the sintering of aluminum alloys. Reference Schaffer, Hall, Bonner, Huo and Sercombe20 A higher SiCp volume fraction yields a lower effective liquid fraction in the semisolid microstructure, weakening the role of pore filling by the liquid phase during partial remelting. In addition, the solidification shrinkage-feeding ability during thixoforging is also reduced because of the decreased effective liquid fraction, causing a decrease in the relative density (Table II). On the other hand, the number of micropores present in the composites increases with the SiCp content because of pore nucleation at the SiCp surfaces and the decreased fluidity of the liquid-phase metal. Reference Sajjadi, Ezatpour and Torabi Parizi4 Therefore, the microstructure compactness decreases gradually as the SiCp volume fraction increases.
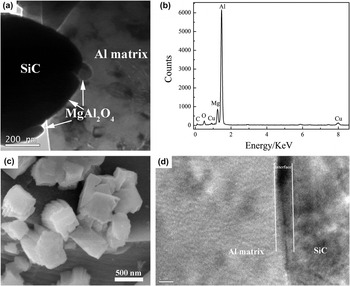
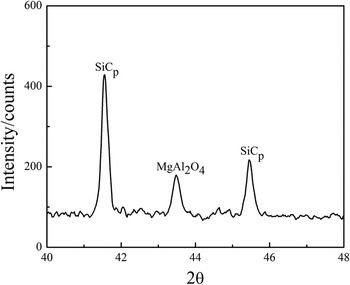
It is well known that the tensile properties of composites are affected significantly by the reinforcement–matrix interface. Figure 8(a) is a typical TEM micrograph of the SiC/A1 interface of the 10 vol% SiCp/2024 Al-based composite, showing the presence of an interfacial reaction product between the SiC and the matrix. EDS analysis indicated the enrichment of elemental Al, Mg, O, and a small amount of C and Cu present in the interfacial reaction layer [Fig. 8(b)]. Figure 8(c) shows a micrograph of the SiCp extracted electrochemically from the composite containing 10 vol% SiCp. A large number of polygonal-shaped reaction products are dispersed at the extracted SiCp surfaces. The XRD results of the extracted SiCp show a diffraction peak corresponding to MgAl2O4 but no diffraction peaks corresponding to Al4C3 (Fig. 9). It can be concluded that the interfacial product of the composite containing 10 vol% SiCp is MgAl2O4, and the silicon oxide covering on the SiCp acts as a diffusion barrier between the Al matrix and the SiCp, preventing the formation of Al4C3. The high-resolution TEM (HRTEM) micrograph indicates that the Al matrix bonds well with the SiCp [Fig. 8(d)]. The interfacial reactions mainly depend on the heating temperature. Reference Lee, Lee, Ahn, Shi and Kim21 It is expected that the SiC/A1 interface of the composites containing 5, 15, and 20 vol% SiCp is also good because those composites are thixoforged under the same reheating temperature of 625 °C.
(a) TEM bright-field micrograph of the SiC/A1 interface of the composite containing 10 vol% SiCp, (b) EDS spectrum of the interfacial product shown in (a), (c) micrograph of the extracted SiCp, and (d) HRTEM image of the interfacial microstructure.

X-ray diffractogram of the SiCp extracted from the 10 vol% SiCp/2024 Al-based composite.

Therefore, the SiCp volume fraction affected the effective liquid fraction, primary particle size and shape, and microstructure compactness. The interfacial product of the SiCp/2024 Al-based composite was MgAl2O4. For composites containing different SiCp volume fractions, the SiCp bonded well with the Al matrix.
B. Effect on mechanical properties
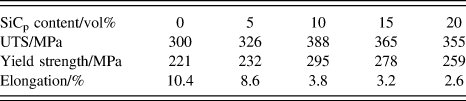
Table III shows the variation in the tensile properties of the thixoforged 2024 Al matrix alloy and SiCp/2024 Al-based composites containing different SiCp volume fractions. The table shows that the addition of SiCp improved significantly the UTS and yield strength of the 2024 Al matrix alloy but reduced the elongation. The tensile strength increased gradually when the SiCp content increased from 5 to 10 vol% and decreased continuously thereafter. The elongation decreased continuously as the SiCp content increased. The composite containing 10 vol% SiCp had the best comprehensive tensile properties, a UTS of 388 MPa, a yield strength of 295 MPa, and an elongation of 3.8%, representing increases of 29.3 and 33.5% and a decrease of 63.5%, respectively, compared with the thixoforged 2024 Al matrix alloy. A previous investigation indicated that a 10 vol% SiCp/2024 Al-based composite prepared by hot extrusion had a yield strength of 210 MPa and UTS of 308 MPa, Reference Hong, Kim, Huh, Suryanarayana and Chun22 which are lower than those of the thixoforged composites in this work, indicating that powder thixoforming is a feasible method for fabricating composites with good mechanical properties.
Variation in the mechanical properties with SiCp volume fraction.

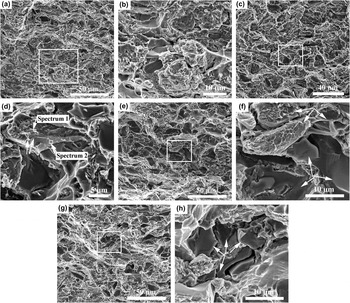
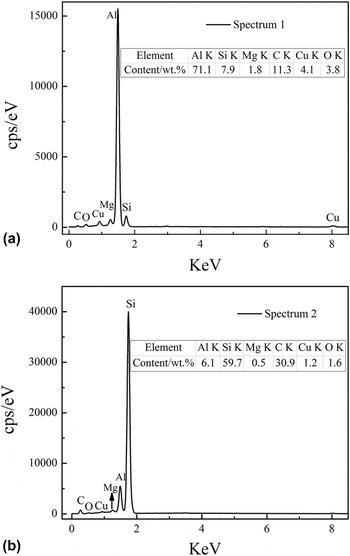
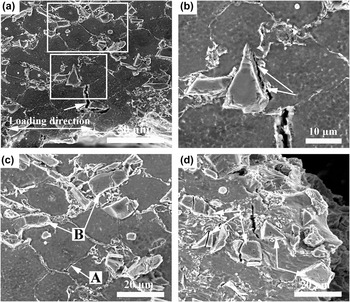
Figure 10 shows the fracture surfaces of thixoforged composites containing different SiCp volume fractions. The composite reinforced with 5 vol% SiCp shows numerous dimples on the 2024 Al matrix [Fig. 10(a)] and cracked and debonded SiCp from the Al matrix [Fig. 10(b)]. As the volume fraction increased to 10%, the amount of the cracked and debonded SiCp increased [comparing Figs. 10(a) and 10(c)]. The debonded SiCp were covered with white particles [marked by arrows in Fig. 10(d)]. Figure 11 shows the EDS spectra of the debonded SiCp in Fig. 10(d). The spectra indicate that these white particles are rich in elemental Al [comparing Figs. 11(a) and 11(b)], which reveals the ductile-tearing failure along the Al matrix near the SiC/Al interface as a result of the Al matrix adhering to the SiCp. It has been reported that the interfacial ductile-tearing failure is ascribed to the strong interfacial bonding, Reference Cheng, Zeng and Liu3 which verifies that the interface of the composite reinforced with 10 vol% SiCp was strong, as discussed in a previous section. The side view of the fracture surface indicates that cracks propagated along the primary particles [marked by arrows in Fig. 12(a)]. The strengthening mechanisms of the particle-reinforced composites include thermal mismatch stress and the Orowan effect. Reference Habibnejad-Korayem, Mahmudi and Poole23 The different coefficients of thermal expansion between the SiCp and the Al matrix result in high-density dislocations within the Al matrix during cooling from the processing temperature. Reference Sajjadi, Ezatpour and Torabi Parizi4 A higher SiCp content yields a higher dislocation density, resulting in greater work hardening of the composite. In addition to the former strengthening mechanism, the interaction of the dislocations with the reinforcements strengthens the composites according to the Orowan mechanism. Reference Habibnejad-Korayem, Mahmudi and Poole23 However, the contribution of Orowan strengthening was minor in this work because the used reinforcing particles were of micrometer-size.
Tensile fracture surfaces of the composites containing (a) 5, (c) 10, (e) 15, and (g) 20 vol% SiCp. (b), (d), (f), and (h) enlarged micrographs corresponding to the rectangular regions in (a), (c), (e), and (g), respectively.

EDS spectra obtained from the debonded SiCp.

Side views of the fracture surfaces of the thixoforged composites containing (a) 10 and (b) 20 vol% SiCp.

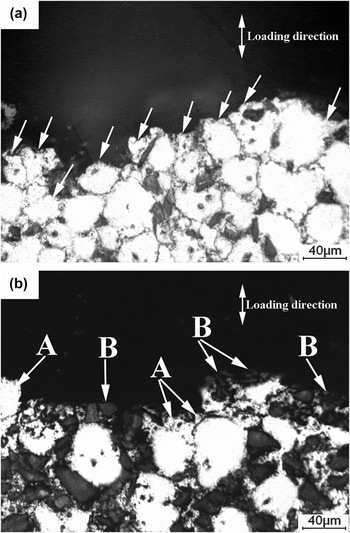
The amount of cracked and debonded SiCp continued to increase when the SiCp volume fraction exceeded 10% [Figs. 10(e) and 10(g)]. Simultaneously, the SiCp clustered together in some local zones [marked by arrows in Figs. 10(f) and 10(h)], which is consistent with the thixoforged microstructures shown in Figs. 5(c) and 5(d). The debonded SiCp were covered with the Al matrix, which is similar to the fracture surface of the composite reinforced by 10 vol% SiCp [comparing Figs. 10(d) and 10(f)]. The side view of the fracture surface shows that cracks propagated preferentially along the secondary solidified structures [marked by arrows A in Fig. 12(b)] and the agglomerated regions of SiCp [marked by arrows B in Fig. 12(b)]. As discussed in a previous section, for composites containing different SiCp volume fractions, the Al matrix bonds well with the SiCp. The differences between the various composites are the results of the clustering of the SiCp, which becomes gradually more serious, and the increase in the number of pores with the SiCp volume fraction. During tensile testing, voids and cracks initiated preferentially at the agglomerated zones of the SiCp. That is, the agglomerated SiCp, along with the increase in the number of pores in the composites containing higher SiCp volume fractions, neutralized the contributions of different strengthening mechanisms to the tensile strength. Therefore, the composites containing 15 and 20 vol% SiCp exhibited a lower UTS and yield strength than the 10 vol% SiCp/2024 Al-based composite. The results agree with the trends reported by other investigators. Reference Mazahery, Abdizadeh and Baharvandi24
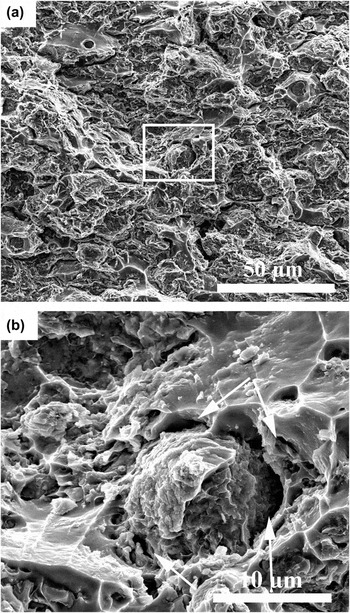
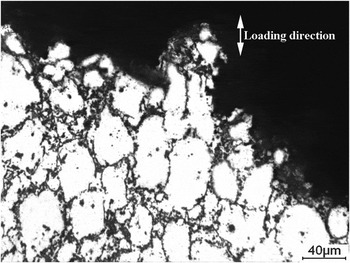
Figure 13 shows the fracture surfaces of the thixoforged 2024 Al matrix alloy. Compared with the SiCp/2024 Al-based composites, the number of generated dimples and debonded α-Al particles increased [comparing Figs. 10 and 13(a)]. The debonded primary particles were frequently surrounded by voids and cracks [marked by arrows in Fig. 13(b)]. The side view of the fracture surface indicates that cracks propagated along the secondary solidified structures that were close to the primary particles, with serious deformation parallel to the loading direction during tensile testing (Fig. 14). The plastic deformation harmony between the primary particles and the secondary solidified structures is poor because of the hard and brittle eutectics present in the secondary solidified sites. Reference Li, Dong, Zeng, Lu and Ding25 To maintain the plastic deformation harmony of the whole material as the loading increased, voids and cracks develop in the secondary solidified regions close to the deformed primary particles. Therefore, it can be supposed that the primary particles first deformed plastically, and then cracks initiated in and propagated along the secondary solidified regions close to the deformed particles during tensile testing.
Tensile fracture surfaces of the thixoforged 2024 Al matrix alloy: (a) low-magnification image and (b) high-magnification image corresponding to the rectangular region in (a).

Side view of the fracture surface of the thixoforged 2024 Al matrix alloy.

Consequently, the addition of SiCp improved significantly the tensile strength of the Al matrix alloy, whereas it decreased the elongation. The critical value of the SiCp volume fraction was 10 vol%. The tensile properties increased gradually as the SiCp volume fraction increased below this value because of the contributions of different strengthening mechanisms to the tensile strength. However, they began to decrease for SiCp volume fractions over this value because the increased number of defects (the agglomerated SiCp and increase in the number of pores) neutralized the contributions of the different strengthening mechanisms. The fracture modes of the thixoforged 2024 Al matrix alloy and the composites containing different SiCp volume fractions belonged to the interparticle regime.
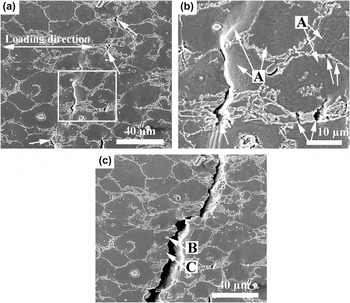
As described in Sec. II, the crack propagation of the thixoforged composites with different SiCp volume fractions was studied according to the fracture surfaces and side views of the fracture surfaces. To further investigate the failure mechanism of the composites, crack initiation and propagation were observed directly using in situ tension testing in SEM. Figure 15 shows the crack initiation and propagation of the 2024 Al matrix alloy. At the initial stage of loading, voids and cracks formed in the secondary solidified regions [marked by arrows in Fig. 15(a)]. The magnified micrograph indicates that slip bands developed within the primary particles [marked by arrows A in Fig. 15(b)] and that the voids always formed in the secondary solidified regions close to these slip bands [marked by arrows in Fig. 15(b)]. Thus, the plastic deformation of α-Al particles resulted in the formation of slip bands and led subsequently to the generation of voids and cracks in the secondary solidified regions because of the poor plastic deformation harmony between the α-Al particles and the secondary solidified structures. As the loading continued, cracks propagated along the secondary solidified structures, resulting in failure of the matrix alloy [Fig. 15(c)]. Such phenomenon corresponds to the interparticle regime, as shown by the side view of the fracture surface [comparing Figs. 14 and 15(c)]. In addition, cracks propagated occasionally across the primary particles in some local zones [marked by arrow C in Fig. 15(c)] and passed the white particle structures within the α-Al particles [marked by arrow B in Fig. 15(c)]. The white particle structures resulted from the solidification of liquid pools within the original primary particles. Reference Li, Chen, Zhang and Guan10 Pores developed easily in these sites because no extra liquid phase was available to feed the solidification shrinkage of the isolated liquid pools during thixoforging. Reference Chen, Huang, Huang, Ma and Hao26 Namely, the white particles within the primary particles were also the sites of crack initiation and propagation.
Sequential micrographs of the 2024 Al matrix alloy from the in situ tension testing in SEM: (a) crack initiation, (b) enlarged micrograph corresponding to the rectangular region in (a), and (c) the fracture of the matrix alloy.

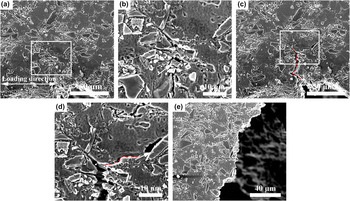
Figure 16 shows the crack initiation and propagation of the 10 vol% SiCp/2024 Al-based composite. Cracks developed preferentially in the secondary solidified structures [marked by arrow in Fig. 16(a)]. The magnified micrograph indicates that a crack formed between the SiCp and the Al matrix and that the Al matrix adhered to the SiCp [marked by arrows in Fig. 16(b)]. These results agree with the fracture surface shown in Fig. 10(d). Microcracks developed frequently in the secondary solidified structures [marked by arrow A in Fig. 16(c)], and the SiCp cracked [marked by arrows B in Fig. 16(c)]. Discontinuous cracks joined with adjacent cracks originating in the ductile-tearing SiC/Al interface, the cracked SiCp, and the microcracks formed in the secondary solidified regions as the loading further increased. However, in the present study, there was no case where the whole process of crack propagation occurred because the elongation of the composites was low, resulting in the instantaneous failure of the whole specimen with continued loading. The fractured composite showed that particulate cracks and debonded SiC/Al interfaces tended to join together with the fracture of the matrix [marked by arrows in Fig. 16(d)]. Figure 17 shows the crack initiation and propagation of the 20 vol% SiCp/2024 Al-based composite. The difference between the composite containing 10 vol% and that containing 20 vol% SiCp was that cracks initiated preferentially in the agglomerated zones of SiCp [Fig. 17(a)], as clearly shown by the arrows in Fig. 17(b). Then, cracks propagated along the secondary solidified structures as the loading increased, forming a main crack [marked by red line in Fig. 17(c)]. The main crack separated into a secondary crack [marked by red line in Fig. 17(d)], and SiCp debonded ahead of the secondary crack [marked by arrow in Fig. 17(d)]. As with the composite containing 10 vol% SiCp, the instantaneous failure of the whole 20 vol% SiCp specimen occurred with continued loading [Fig. 17(e)].
Micrographs of the composite containing 10 vol% SiCp from the in situ tension testing in SEM: (a) crack initiation, (b) and (c) enlarged micrographs corresponding to the rectangular regions in (a), and (d) the fracture of the composite.

Micrographs of the composite containing 20 vol% SiCp from the in situ tension testing: (a) and (c) crack initiation and propagation and (e) fracture of the composite. (b) and (d) high-magnification micrographs corresponding to the rectangular regions in (a) and (c), respectively.

Compared with the 2024 Al matrix alloy, the slip bands that formed in the composites were small or difficult to observe because the plastic deformation ability of the composites was worse than that of the Al matrix alloy because of the elastic constraint of the high-modulus SiCp and the high dislocation density of the Al matrix within the composite. Reference Cheng, Zeng and Liu3,Reference Wu and Arsenault27 During tensile testing, the SiCp tended to crack and debond. Reinforcement–matrix interfaces are incoherent because of the different crystal structures and lattice constants. Reference Daoud15 During tensile testing, the Al matrix deformed plastically, whereas the SiCp only deformed elastically. The SiCp constrained the deformation of the surrounding matrix, resulting in inhomogeneous deformation in the matrix of the composite. The stress concentration increased as the strain increased. The SiCp sheared and the Al matrix close to the SiCp was torn when the stress was larger than the fracture and debonding strength of the SiCp. This phenomenon has been observed in other studies. Reference Wu and Arsenault27
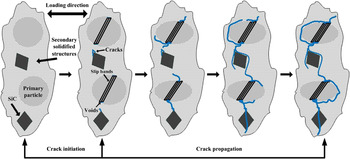
Consequently, during tensile testing, slip bands were first generated, and then cracks were initiated in and propagated along the secondary solidified structures close to the slip bands, the debonded interface, and the cracked SiCp. However, for composites containing over 10 vol% SiCp, the agglomerated SiCp provided additional zones of crack initiation and propagation. Schematic representations of the various steps for the crack initiation and propagation of the composites during tensile testing until failure are shown in Fig. 18.
Schematic illustration of crack initiation and propagation of the composites during tensile testing.

IV. CONCLUSIONS
-
(1) Powder thixoforming combined with the semisolid forming process and conventional PM was shown to be a novel and available technique for fabricating the ceramic particle-reinforced metal matrix composites.
-
(2) The SiCp volume fraction affected the effective liquid fraction, the size and shape of the primary particles, and the microstructure compactness.
-
(3) The addition of SiCp improved significantly the tensile strength of the Al matrix alloy, whereas the elongation decreased. The composite with 10 vol% SiCp had the best comprehensive tensile properties, a UTS of 388 MPa, a yield strength of 295 MPa, and an elongation of 3.8%.
-
(4) The reaction product of the SiCp/2024 Al-based composites was MgAl2O4. For composites containing different SiCp volume fractions, the SiCp bonded well with the Al matrix.
-
(5) During tensile testing, slip bands were first generated, and then cracks were initiated in the secondary solidified structures close to the slip bands, the debonded SiC/Al interface, and the cracked SiCp.
ACKNOWLEDGMENTS
The authors express thanks for the financial support from the Basic Scientific Fund of Gansu University (Grant No. G2014-07), the Program for New Century Excellent Talents of the University of China (Grant No, NCET-10-0023), and the Program for Hongliu Outstanding Youngth of Lanzhou University of Technology.