Introduction
Globally, crop yields are expected to decline by an average of 2% due to the negative impacts of climate change (Porter et al., Reference Porter, Xie, Challinor, Cochrane, Howden, Iqbal, Lobell, Travasso, Field, Barros and Dokken2014) against the predicted rise in the human population in the next century (UN, 2011). This means that an increase in global food production by more than 50% will be needed (Godfray et al., Reference Godfray, Beddington, Crute, Haddad, Lawrence and Muir2010). Crop wild relatives (CWRs) that are of relatively close genetic relationship to a crop (Maxted et al., Reference Maxted, Ford-Lloyd, Jury, Kell and Scholten2006) harbour valuable genetic diversity potentially important for crop improvement (Maxted and Kell, Reference Maxted and Kell2009). Despite the recognition of their profile and potential value in crop development, CWRs are highly threatened by factors which are impacting all wild plant species, such as habitat destruction, eutrophication and climate change (Kell et al., Reference Kell, Maxted, Bilz, Maxted, Dulloo, Ford-Lloyd, Frese, Iriondo and Pinheiro de Carvalho2012). Loss of populations of CWR can lead to a decline in the viability of plant communities, as well as a reduction in the evolutionary potential of the CWR species themselves, which can, in turn, eventually lead to species extinction and cause unforeseen changes in ecosystems. A decrease in the availability of CWR genes and alleles will also restrict the options of farmers and breeders and have a negative impact on future food security.
Zambia has vast agricultural potential in the Southern African Development Community (SADC) region. Of the 58% of land suitable for agricultural production, only 14% is currently under active cultivation (http://www.zda.org.zm). The main crops under production include maize, rice, sorghum and millets, sunflower, groundnut, beans, soybean, wheat, cotton and tobacco. Other important crops are cassava and sweet potato. These are also the crops that have active national breeding programmes, the thrust of which is in collaboration with the Consultative Group on International Agricultural Research (CGIAR) centres that often make available elite lines for use in the breeding programmes for maize International Maize and Wheat Improvement Centre (CIMMYT), sorghum and millet and groundnut International Crops Research Institute for Semi-Arid Tropics (ICRISAT) and beans International Centre for Tropical Agriculture (CIAT). Current national actions towards conservation of plant genetic resources do not adequately cover CWR occurring in Zambia. Currently, conservation action of CWR taxa in Zambia is focused on ex situ conservation through genebank storage. A novel approach that maximizes both in situ and ex situ conservation will enable increased CWR diversity conservation for crop improvement and promoting food security (Maxted et al., Reference Maxted, Ford-Lloyd, Hawkes, Maxted, Ford-Lloyd and Hawkes1997).
In this study, we outline the process of prioritization of CWR taxa, the identification of priority CWR sites that could form a basis for the development of a conservation strategy for priority CWR in Zambia.
Materials and methods
CWR checklist
A selected number of crops to be used for compiling wild relatives were prioritized through consensus by key national stakeholders from academia, civil society and public sector with background in biological science, advocacy and plant breeding. The list of crops was prioritized based on the following criteria: national socio-economic importance of the crops based on crop production and marketing statistics from the Central Statistics Office/Ministry of Agriculture and Livestock (CSO/MAL) crop survey reports and their importance for food security and industrial use, occurrence of CWR taxa in the country and local cultural and use value of a particular crop for food and/or medicinal uses. These crops included cereal, food legumes, vegetable, root and tuber, oil, fibre, pasture and forage and green manure crops. This list of crops includes both those that are native to Zambia and those that are introduced. The list of prioritized crop species was matched with a digitized checklist of 6305 Zambian vascular plants (Phiri, Reference Phiri2005), which was the taxonomic backbone for the generated checklist of CWR, using Microsoft Excel® and the taxa within the matching genera were selected. In order to allow maintenance of the CWR data, a database was created in Microsoft Excel® and published on Dataverse (https://dataverse.harvard.edu/dataset.xhtml?persistentId=doi:10.7910/DVN/8YXCFR). The CWR information generated in the database included: family, genus, species, species author and where appropriate and available sub taxon and sub taxon author.
CWR checklist prioritization and inventory
CWR taxa for consideration in the development of the national strategic action plan (NSAP) for their conservation were subjected to prioritization based on four criteria and a point scoring procedure (see Magos Brehm et al., Reference Magos Brehm, Maxted, Martins-Loução and Ford-Lloyd2010). The criteria were: (i) geographical distribution; (ii) utilization potential for crop improvement (based on the gene pool (GP) or and taxon group (TG) concepts); (iii) threat status and (iv) economic value of the associated crop species.
The geographic distribution criterion categorized the CWR into four categories: taxa endemic to Zambia (score of 4), taxa endemic to the SADC region (3), CWR taxa endemic at African continental level (2) and CWR with global distribution (1). In general, priority increases inversely to geographic range such that species with more restrictive distribution (e.g. national endemics) should be given higher priority than species occurring worldwide (Maxted et al., Reference Maxted, Magos Brehm and Kell2013). Data on the distribution of specific taxa were compiled from various sources, including literature survey, online databases (Tropicos, 2011; USDA, 2011) and the seed information database (Royal Botanic Gardens Kew, 2011).
The criterion relating to utilization potential of CWR taxa in crop improvement referred to the ease of crossability of the wild relative with the related crops according to the GP concept (Harlan and de Wet, Reference Harlan and de Wet1971) or the taxonomic relationship to the crop based on the TG concept (Maxted et al., Reference Maxted, Ford-Lloyd, Jury, Kell and Scholten2006). Based on the GP concept, the checklist taxa were either assigned the primary GP1 (score of 9) for the wild forms of the crop that cross easily with the crop or the secondary GP2 (score of 7) for the less closely related species from which gene transfer to the crop is possible but difficult using conventional breeding techniques or the tertiary GP3 (score of 3) for species from which gene transfer to the crop is impossible, or if possible, requires sophisticated techniques, such as embryo rescue, somatic fusion and genetic engineering. This information was sourced from the Harlan and de Wet Inventory (Vincent et al., Reference Vincent, Wiersema, Kell, Fielder, Dobbie, Castañeda-Álvarez, Guarino, Eastwood, Leon and Maxted2013 and http://www.cwrdiversity.org/) and Germplasm Resources Information Network (GRIN) Taxonomy for Plants (http://www.ars-grin.gov/~sbmljw/cgi-bin/taxcwr.pl). Where information on the TG concept of CWR taxa was available it was used as a proxy for taxon genetic relatedness and thus potential crossability (Maxted et al., Reference Maxted, Ford-Lloyd, Jury, Kell and Scholten2006). The CWR taxa that lacked this information were assigned the category ‘unknown’ (score of 1).
Threat status was based on the 1994 IUCN Red List categories and criteria (IUCN, 1994) as this was the only data available for Zambian CWR. This information was sourced from Golding (Reference Golding2002), and more specifically Bingham and Smith (Reference Bingham and Smith2002) and the online source at http://www:naturezambia.org/download/RedDatalistZambia. It should be noted that most taxa have been assessed at regional and global levels and very few at national level. This may explain the reason for most of the taxa being assigned the not evaluated category. Each taxon was assigned a score for each IUCN Red List category as follows: threatened taxa, i.e. Critically Endangered (CR), Endangered (EN) and Vulnerable (VU), were assigned with the high and equal score of 5, the Near Threatened (NT) taxa were assigned the score of 4, the Least Concerned (LC) and Lower Risk-Least Concern (LR-LC) taxa were assigned the score of 3, and finally the Data Deficient (DD) and Not Evaluated (NE) CWR were assigned the lowest score of 1. Although the Red List categories of DD and NE are assigned low scores, this may not imply that the taxa falling under these categories are not priority for conservation. It is for instance necessary to undertake further field assessments on these taxa in order to establish their conservation status.
The socio-economic use value of the associated crop species criterion divided the CWR in six categories and the scores assigned reflect the relative importance of the use value category of the related crop where the higher score indicates greater economic value. The categories were: human food (score of 7); livestock fodder (score of 5); soil fertility improvement (score of 4); herbal medicinal (score of 3); fibre (score of 2) and utensils (score of 1). Wild relatives of human food crops were assigned the highest score of 7 because they relate to human food security which is a priority objective in national regional and global human development policies and programmes.
Following the prioritization method of point scoring procedure, each CWR taxon was assigned a score for each criterion, and the scores were then summed. Scores for each CWR were summed up without any weighting to give a total score. The obtained range of total scores was 4–20. In order to group the taxa, ranges of scores were set as follows: total scores range between 16 and 20 was categorized high priority for conservation, 10–15 was considered medium priority and the low priority CWR taxa had a total score range between 4 and 9. In this regard, a total of 30 CWR taxa were considered high priorities for active conservation in Zambia. The priority list of CWR has been published online in Dataverse (https://dataverse.harvard.edu/dataset.xhtml?persistentId=doi:10.7910/DVN/8YXCFR).
Compilation of occurrence data
The occurrence data of the national high priority CWR taxa was compiled from a number of national and global sources. The national sources included data obtained from the national herbaria at the University of Zambia (UNZA), the Kitwe Forestry Research herbarium and the National Plant Genetic Resources Centre (NPGRC) database, of which the missing information was sourced from the physical collection records maintained in the genebank. The global sources included the Royal Botanic Garden Kew (https://www.kew.org/kew-gardens), the African Biodiversity Conservation Innovation Centre (ABCIC) (http://www.abcic.org/), the South African National Biodiversity Institute (SANBI) (https://www.sanbi.org/) and CGIAR centres, such as the International Centre for Tropical Agriculture (ICTA) (http://ciat.cgiar.org/), the International Institute of Tropical Agriculture (IITA) (http://www.iita.org/) and the International Rice Research Institute (IRRI) (http://irri.org/).
Preparation of occurrence data and quality check
A preliminary version of the occurrence data template (published in Dataverse: https://dataverse.harvard.edu/dataset.xhtml?persistentId=doi:10.7910/DVN/5B9IV5) was used in the compilation of occurrence data. For the 30 priority CWR taxa, a total of 1049 occurrence data records was assembled. Of these, 819 records were fully georeferenced and the remaining 230 records lacked georeferenced data or any descriptive collecting site information and hence were eliminated from the final dataset that were used for subsequent analyses. Records without coordinates but with descriptive collecting site data were georeferenced with the aid of paper maps and Google Earth (https://www.google.com/earth/index.html). The occurrence data were then subjected to a quality control: (i) first the records were checked for conformity with the requirement to have its geographic coordinates expressed in decimal degrees and to include also a locality description to allow an evaluation of the correctness of the geographic coordinates; (ii) then, consequently, all records with coordinates in a different format were converted into decimal degrees and (iii) finally, records of the same taxon that had the same geographic coordinates were eliminated from the analyses. A spatial layer with the political boundaries of Zambia was downloaded from a global source (http://www.statsilk.com/maps/download-free-shapefile-maps) and used to select those populations within the limits of the country boundaries which enabled to eliminate those occurrence records with erroneous coordinates falling in neighbouring countries or in the sea. The fully georeferenced 590 records with no duplicate passport data constituted the final dataset of 21 priority CWR taxa was used for the spatial and other analyses. The other taxa did not have data and therefore were not involved in the analyses.
Hotspot analysis of CWR diversity
Rarefaction analysis was used to assess species richness from the results of sampling. This technique allows the calculation of species richness for a given number of individual samples, based on the construction of the so-called rarefaction curves. Rarefaction analysis assumes that the individuals in an environment are randomly distributed, the sample size is sufficiently large, that the samples are taxonomically similar and that all of the samples have been performed in the same manner. If these assumptions are not met, the resulting curves will be greatly skewed. According to Petit et al. (Reference Petit, Mousadik and Pons1998) and Leberg (Reference Leberg2002), the rarefaction method has been developed to compare richness among cells that have a dissimilar number of observations or samples. The rarefaction method thus recalculates the richness measured in the different cells as if a standard number of observations were made in each cell. We applied rarefaction in our analysis which addressed the problem of skew. Using rarefaction analysis in DIVA-GIS, the size of the raster grids (in 5 km 05°) was used in order to correct for sample size bias. Following application of this analysis, priority CWR taxa distribution and species richness maps were produced.
In order to understand the influence of climatic and human population data on distribution of CWR species, three raster files, (i) bio 1, annual mean temperature whose values were obtained by multiplying a factor of 10, this means that to obtain values in °C the values could be divided by 10; (ii) bio 12, annual precipitation (values in mm) and (iii) pop_2015, population density for 2015 as number of people by cell, were used. Climatic files, bio 1 and bio 12, were sourced from Worldclim version 1.4 (http://worldclim.org/current) and human population data, pop_2015 files were obtained from Gridded population of the world, CIESIN (http://sedac.ciesin.columbia.edu/data/collection/gpw-v4). Species distribution maps of Oryza, Vigna, Eleusine and Dioscorea taxa were overlain with climate and human population raster files to obtain maps that are available as online Supplementary figures.
Complementarity analysis
Complementarity analysis was undertaken for the assessment of priority CWR taxa within and outside the protected areas and also as a basis for decision making on reserve selection. If there were several grids with similar number of CWR taxa, diverse locations and larger distance in relation to other sites were selected. This analysis first selects the location with the highest species richness; subsequently it selects an additional location containing the highest species richness upon exclusion those species already present in previously selected locations from the analysis. This selection process is repeated until the selection of further grid square would only duplicate taxa already in the previously selected ones (Rebelo and Riegfried, Reference Rebelo and Riegfried1992; Rebelo, Reference Rebelo and Huntley1994; Dietz and Czech, Reference Dietz and Czech2005; Riemann and Ezcurra, Reference Riemann and Ezcurra2005). The complementarity analysis was performed using a 10 × 10 km2 grid. This analysis permits the efficiency of an in situ conservation network to be maximized by gathering the highest number of focal CWR species in the lowest number of locations. The complementarity analysis was used as a basis for establishment of a network of in situ conservation sites because it covers most (if not all) target CWR. Complementa tool from the CAPFITOGEN toolset (Parra-Quijano et al., Reference Parra-Quijano, Torres, Iriondo and Lὁpez2014) was deployed together with a spatial layer of protected areas (http://www.protectedplanet.net/country/zmb) to identify potential complementary sites for active in situ conservation for priority CWR taxa in Zambia. The complementarity algorithm (based on Rebelo and Riegfried, Reference Rebelo and Riegfried1992 and Rebelo, Reference Rebelo and Huntley1994) captures the highest number of taxa in the smallest possible area. In this regard, complementarity was undertaken to detect the minimum number of grid cells that cover the priority CWR and afterwards using Complementa, complementarity analysis was run to: (i) see how well are priority CWR covered by existing protected areas (PA) and (ii) to identify which existing PA can be the target to set up genetic reserves that are complementary to each other to cover the priority CWR.
In situ and ex situ gap analysis
This analysis involved a comparison between the range of natural diversity and the diversity that is effectively represented in genebank collections (ex situ) or actively conserved in situ to identify in situ and ex situ conservation priorities, so that conservation actions (e.g. collection missions and establishment of protected areas with active management of CWR populations) can be appropriately targeted (Maxted et al., Reference Maxted, Dulloo, Ford-Lloyd, Iriondo and Jarvis2008a, Reference Maxted, Iriondo, De Hond, Dulloo, Lefèvre, Asdal, Kell, Guarino, Iriondo, Maxted and Dulloob). In situ and ex situ conservation gaps can be detected at the multi-taxon level through assessment of CWR taxa not conserved in situ or ex situ in comparison with CWR taxa for which active in situ conservation measures are already in place or for the case of ex situ CWR taxa, accessions are appropriately stored in genebanks (Magos Brehm et al., Reference Magos Brehm, Kell, Thormann, Gaisberger, Dulloo and Maxted2017)
The 590 occurrence records that were fully georeferenced constituted the final dataset that was used in situ gap analysis. Gap analysis was performed using DIVA-GIS 7.5 (http://www.diva-gis.org) according to the methods described by Hijmans et al. (Reference Hijmans, Guarino and Mathur2012) and Scheldeman and van Zonneveld (Reference Scheldeman and van Zonneveld2010).
The SADC Documentation and Information System (SDIS), developed through the NORDIC supported SADC Plant Genetic Resources Project (http://www.spgrc.org.zm/) (currently being used by the National Plant Genetic Resources Centres (NPGRCs) in the SADC region), was used to obtain ex situ accessions data that were matched with occurrence data of priority CWR taxa. CWR taxa that did not match with the ex situ accession data constituted a gap that have not been collected and conserved ex situ in the national genebank.
Results and discussion
CWR checklist and inventory
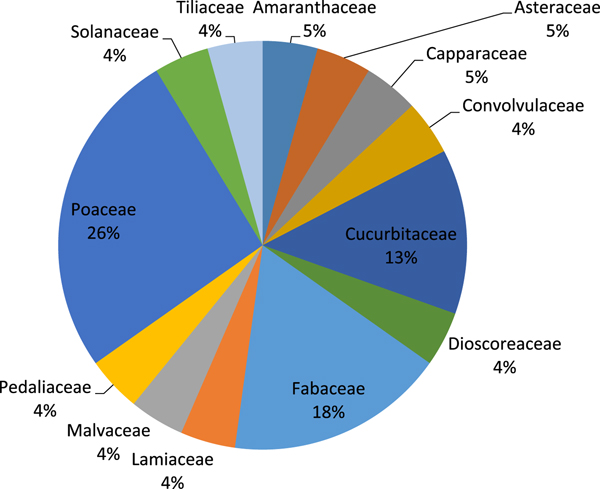
The checklist development resulted in a partial CWR checklist of 459 CWR taxa. The generated CWR taxa belong to 13 families (Fig. 1). Out of the total CWR generated and according to Phiri (Reference Phiri2005), 27 CWR taxa including mainly Crotalaria taxa, related to Crotalaria juncea widely grown throughout the tropics and subtropics as a source of green manure, fodder and lignified fibre obtained from its stem, were endemic to Zambia representing about 6% of the total CWR taxa. Among the total of 139 CWR taxa, 30% of which has narrow distribution to the southern Africa and some of these are native to Zambia. Some of the CWR taxa in the checklist are related to globally or regionally important food crops as reflected in Annex 1 of the International Treaty on Plant Genetic Resources for Food and Agriculture (ITPGRFA) (FAO, 2001) and regional important crops as outlined in the SADC Regional Agricultural Policy and SADC Agricultural Development plans (SADC, 2013). These include wild relatives of finger millet (Eleusine coracana L.), rice (Oryza sativa L.), sorghum (Sorghum bicolor L.), cowpea [Vigna unguiculata (L.) Walp] and sweet potato [Ipomoea batatas (L.) Lam.].
Percentages of the generated CWR taxa for the thirteen families.

Prioritization of CWR checklist
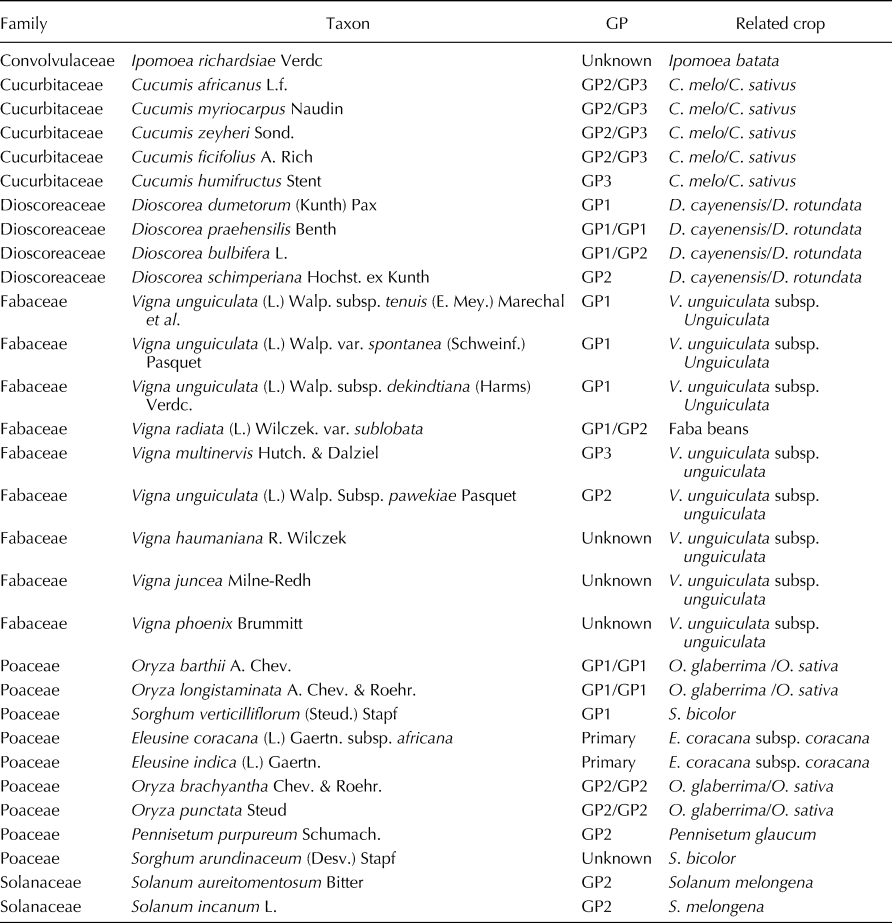
Prioritization of the CWR checklist generated 30 high, 216 medium and 213 low priority CWR taxa. The 30 high priority CWR taxa belongs to six families and nine genera, as follows: Fabaceae (Vigna – 9 CWR taxa), Poaceae (Oryza (4), Sorghum (2), Eleusine (2), Pennisetum (1)), Dioscorea (Dioscorea 4), Cucurbitaceae (Cucumis 5), Solanaceae (Solanum 2) and Convolvulaceae (Ipomoea (1)) (Table 1). According to the genepool concept (Harlan and de Wet, Reference Harlan and de Wet1971), of the high priority CWR taxa, 41%, were of primary GP, 34% of secondary GP and 9% of the taxa were of tertiary GP relatives. The active conservation of the CWR taxa of both of these two groups of genetic resources is important. However, this does not in any way suggest neglecting the CWR taxa in the tertiary and unclassified classes in terms of planning for their conservation because they may be harbouring the desired valuable traits that may not necessarily be available in the primary and secondary GP CWR taxa.
Priority CWR taxa, associated GPs and related crops

Compilation of occurrence data
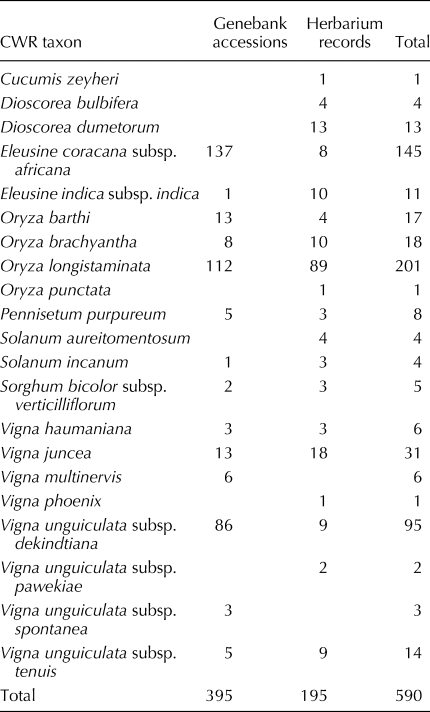
For the 30 priority CWR taxa, a total of 1049 occurrence records was assembled. Of these records, 819 records were fully georeferenced and the remaining 230 records lacked georeferenced data and therefore were eliminated from the final dataset as they could not be used for subsequent analyses. Five hundred ninety of the fully georeferenced records with no duplicate passport data were used for spatial and other analyses. Two main sources of information and data of priority CWR taxa used in these analyses were the genebanks and herbaria. Of the two sources, the genebanks accounted for 67% of these records and 50% (or 198) of these were obtained from the Zambian national genebank. The other genebank records were sourced from international genebanks that included the CIAT, IITA and IRRI. A total of 195 records were obtained from the herbaria that included the Royal Botanical Gardens Kew, ABCIC, SANBI, UNZA and Kitwe Forestry Research Herbarium. The number of records for each priority CWR taxon is provided (Table 2). Comparatively, Oryza longistaminata A. Chev. & Roehr. had the largest number of records (201), followed by E. coracana (L.) subsp. africana with 145 records. The lowest number recorded was obtained for Cucumis zeyheri Sond., Oryza punctata Steud and Vigna phoenix Brummitt with a single record each (Table 2).
Number of records for each priority CWR taxon from the genebanks and herbaria used in the analyses

The highest number of observations were recorded from Eastern province which was closely followed by Southern, Western and Luapula provinces (online Supplementary Fig. S1). This could be attributed to the comparable highest frequency of sampling times in those regions.
Distribution of priority CWR taxa
Species distribution maps for Oryza, Vigna, Eleusine and Dioscorea taxa overlain with layers of annual mean temperature, annual precipitation and human population density for 2015 were obtained (online Supplementary Fig. S2–S13). While O. longistaminata seem to be most widely distributed across a wide range of temperature regimes from 206 to 262 (or 20.6–26.2°C), the other Oryza taxa assume a narrower distribution limited only to specific regions of Zambia (online Supplementary Fig. S2). It is worthwhile to observe that on one hand O. brachyantha is narrowly restricted to the northern region and temperature range of 187–243 (or 18.7–24.3°C), on the other hand O. barthii and O. punctata are restricted to the South Luangwa National Park in the eastern region of the country (online Supplementary Fig. S2). Similarly, Vigna juncea Milne-Redh has shown to have wide distribution across all the regions of Zambia but at annual mean temperature range of 187–206 (18.7–20.6°C) (online Supplementary Fig. S3). The distribution of V. haumaniana and V. multinervis is restricted to South Luangwa in the Eastern province, V. unguiculata subsp. dekindtiana seems to have restricted distribution in Northern and Luapula provinces and to some extent the North-western province of the country. Analysis of occurrence data of E. coracana subsp. africana and E. indica, has revealed that their geographical distribution is restricted to the upper half of the country at the temperature range of 187–243 (or 18.7–24.3°C). The suitability map for the cultivated type, E. coracana subsp. coracana, following the same distribution pattern as the two CWR taxa. Based on the available occurrence data that was used in this analysis, the distribution pattern of Dioscorea bulbifera L. and D. dumetorum (Kunth) Pax is highly restricted to the Northern, Central, Lusaka, Southern and to some extent parts of Eastern provinces of Zambia. However, this inference is merely based on available data. With respect to annual precipitation, the distribution of Oryza taxa is restricted to the north and south of the country with annual precipitation range of 600–1515 mm (online Supplementary Fig. S6) along the natural water bodies. The pattern of distribution of Vigna taxa seems to follow a similar pattern as that of Oryza taxa (online Supplementary Fig. S7). Eleusine taxa and to some extent Dioscorea taxa have restricted distribution in the northern of the country with annual precipitation range of 783–1515 mm (online Supplementary Fig. S8). As regards population density, all the priority CWR taxa occur in regions with the lowest population density ranging from 0 to 5471 (online Supplementary Fig. S10–S13). This is indicative that increased human settlement and activity that usually lead to disturbance of natural habitat in turn adversely affecting occurrence of CWR taxa.
Areas of increased richness of priority CWR taxa
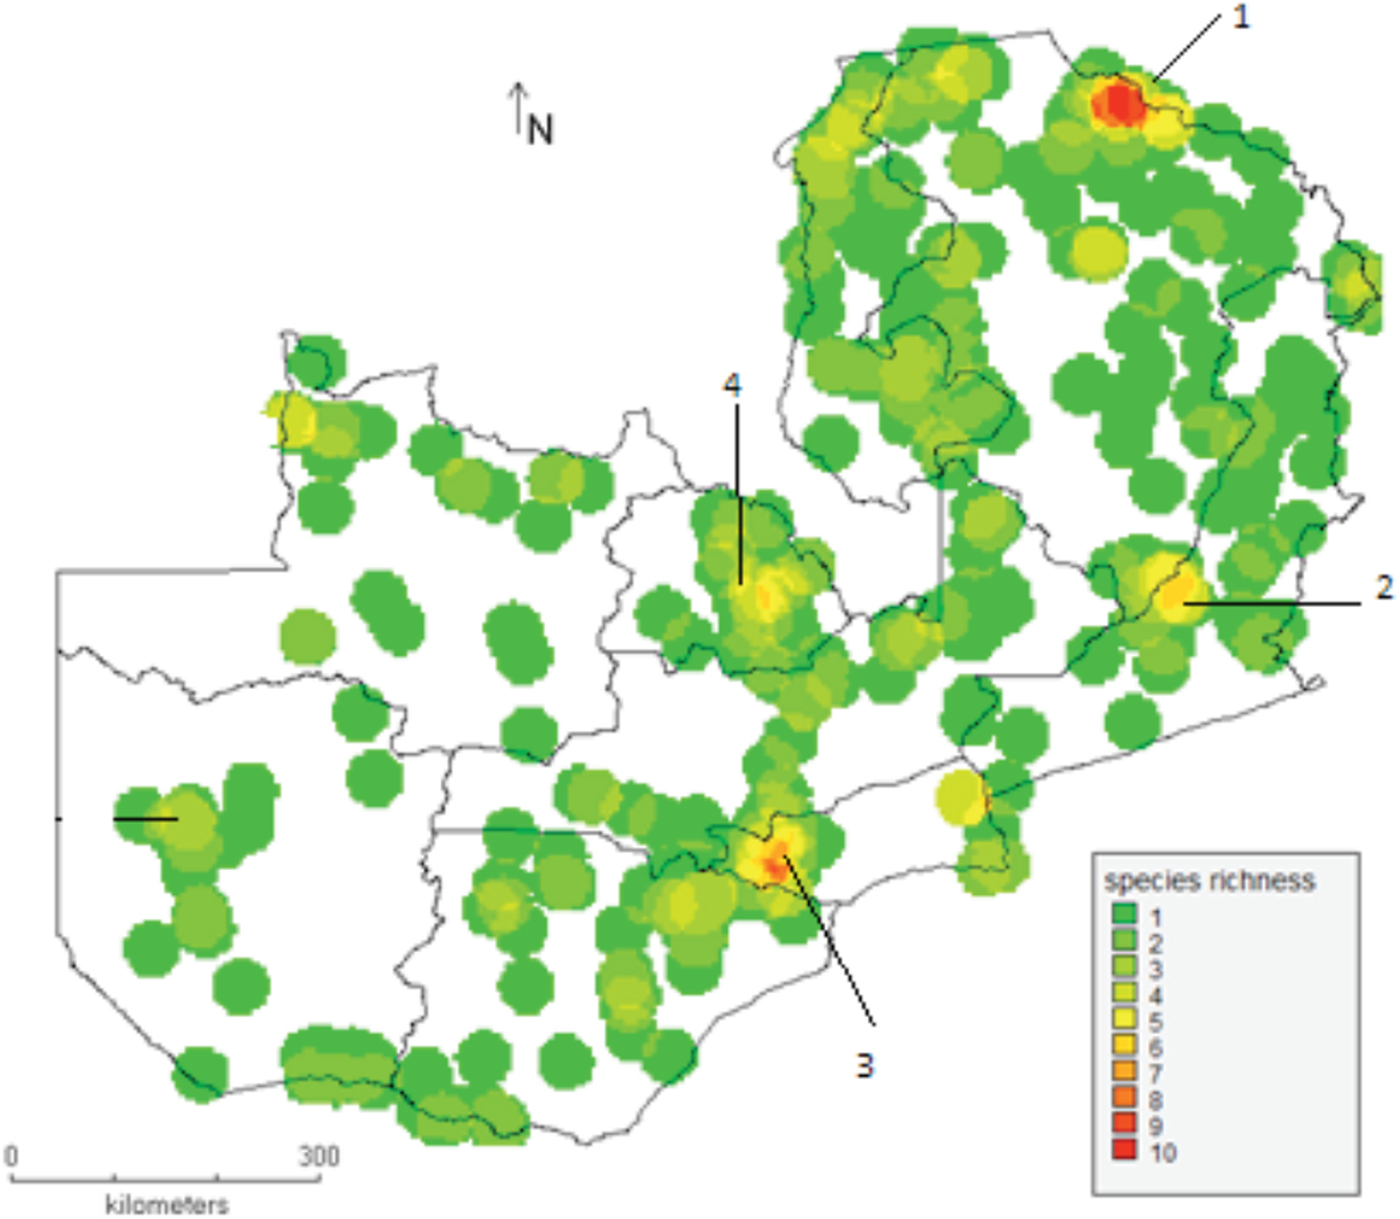
A priority CWR taxa richness analysis based on the occurrence data gathered revealed four areas of richness of priority CWR taxa (Fig. 2) as (i) Mbala district in the Northern province, (ii) South Luangwa National Park in Eastern province, (iii) east of Lusaka in Lusaka province and (iv) Mpongwe in the Copperbelt province. The Mbala site is located in the agro-ecological region III (JAICAF, 2008) that is characterized by annual rainfall of above 1000 mm and high elevation. The Tanganyika and Mweru wa Ntipa Ramsar sites occur within this region which is surrounded by flat wetland plains with itigi thickets and miombo woodlands. Riverine evergreen forests with Ficus bussei, F. sycomorus, Trichilia emetica and Acacia adenocalyx are found on the river and lake shores. Specific priority CWR taxa occurring in Mbala district in the Northern province are D. bulbifera, V. unguiculata subsp. dekindtiana, E. coracana subsp. africana, D. dumetorum, O. longistaminata and V. unguiculata subsp. pawekiae. The South Luangwa site occurs in flood plains that represent the major wetland types of Southern Africa. The site is dominated by rivers that recharge many springs, freshwater lakes, lagoons, marshes and streams. There are also hot springs and brackish cold springs. The main habitats include evergreen miombo woodlands (with wild mango, African ebony, fig and Natal mahogany) and the alluvial zone which sustains riverine vegetation. In South Luangwa National Park, O. punctata was the dominant taxa, whereas in Mpongwe on the Copperbelt province was V. unguiculata subsp. tenuis. The taxa occurring in Lusaka East are V. unguiculata subsp. pawekiae, V. haumaniana, V. juncea and O. longistaminata.
Hotspot analysis of priority CWR taxa. Red areas encompass the highest number of CWR species. 1 = Mbala district (Northern province), 2 = South Luangwa National Park (Eastern province), 3 = East of Lusaka (Lusaka province), 4 = Mpongwe (Copperbelt province).

Despite the low number of observations (online Supplementary Fig. S1), comparatively, Mbala district in the Northern province had the highest species richness which was followed by South Luangwa in Eastern province, Lusaka province and Mpongwe on the Copperbelt province (Fig. 2). The North-western and Copperbelt provinces are indicating high species richness based on the rarefaction method. These sites were least in terms of number of observations that were used for the analysis. South Luangwa in Eastern province which, was highly sampled but comparatively had the lower species richness than Mbala in Northern province.
A general management plan for the South Luangwa National Park and surrounding Game Management Areas (GMAs) developed by the Wildlife Authority exists mainly for protection and maintenance of the physical and ecological conditions of the area and promoting research work associated with wildlife.
Complementarity analysis
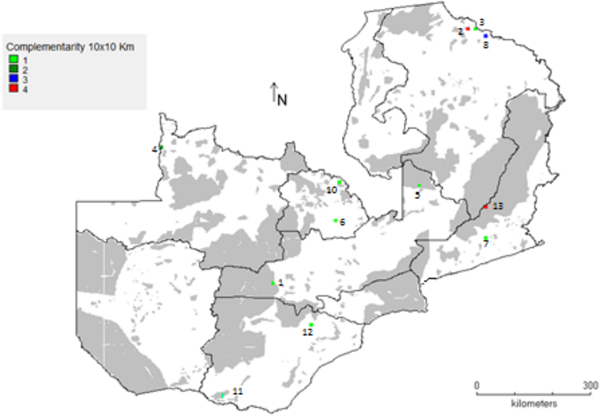
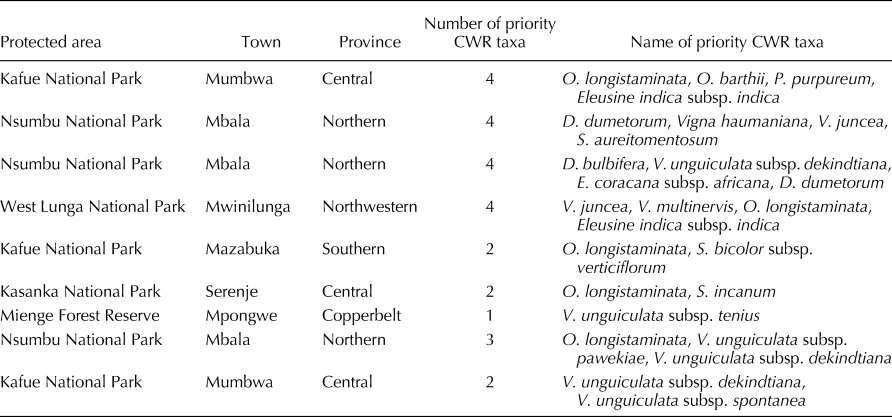
Complementarity analysis at the grid cell level indicated that 13 complementarity cells are needed to cover the 21 priority CWR covering a total of 27 populations (4.6% of the total number of populations) (Fig. 3). Some of these sites occur within existing protected areas where genetic reserve could be established. These are: Nsumbu National Park in Mbala covering cells numbered 2 and 3, the South Luangwa National Park covering cell numbered 13, Kasanka National Park covering cell numbered 5 and Mosi-Oa-Tunya National Park covering cell numbered 11 (Fig. 3) and to a variation of extent to which the populations of priority CWR taxa are covered in these protected areas (Table 3). However, there are proposed sites outside protected area that could be recommended for establishment of genetic reserve for conservation of priority CWR taxa that do not occur in existing protected areas. These include sites covering cell numbered 4 in North-western of the country at the source of Zambezi River and cell numbered 8 occurring in Mbala district of the Northern province. However, it will be necessary to undertake field surveys targeting the indicated sites to ascertain the feasibility of this proposed conservation work.
Complementarity analysis of the 21 priority CWR using a grid cell size of 10 × 10 km2. Grey areas in the map are the national protected areas.

Zambian priority CWR taxa occurring existing protected areas

The existing national protected areas cover a total of 222 populations out of a total of 590 populations of priority CWR (37.6%). Of the 30 priority CWR taxa, a total of 18 taxa are covered by the protection area network of Zambia representing 60% of the total priority CWR taxa. Therefore, from these statistics it can be deduced 40% of the total priority CWR taxa are not covered by the protected areas of the country.
In situ gap analysis
The gap analysis revealed that there were three priority CWR taxa, C. zeyheri, O. punctata and V. phoenix, did not occur within any of the existing protected areas of Zambia. These CWR taxa may be prioritized and targeted for conservation in the areas of their occurrence using less formal approaches as outlined by Maxted et al. (Reference Maxted, Iriondo, De Hond, Dulloo, Lefèvre, Asdal, Kell, Guarino, Iriondo, Maxted and Dulloo2008b). It is important to note that creation of national protection areas in Zambia was primarily targeted for the conservation of wildlife and therefore there has not been specific national strategic action plan in place for management and monitoring of CWR taxa occurring in these designated national protection areas.
Ex situ gap analysis
The ex situ gap analysis has shown that a total of six priority CWR taxa, Dioscorea dumetorum, D. bulbifera, C. zeyheri, O. punctata, Solanum aureitomentosum, V. unguiculata subsp. pawekiae and V. phoenix, are not conserved ex situ (Table 2). Twelve priority CWR taxa including Eleusine indica subsp. indica, Solanum incanum, S. bicolor subsp. verticilliflorum, Vigna haumaniana and V. unguiculata subsp. spontanea were under represented in ex situ collections with less than five accessions conserved. A minimum threshold of five accessions conserved ex situ has been suggested by Brown and Briggs (Reference Brown, Briggs, Falk and Holsinger1991) and Dulloo et al. (Reference Dulloo, Labokas, Iriondo, Maxted, Lane, Laguna, Jarvis, SP, Iriondo, Maxted and Dulloo2008) in order to sufficiently conserve the available genetic diversity of wild plant taxa and CWR. However, it is necessary that a detailed genetic/ecogeographic diversity analysis should be carried out in order to identify all the populations of priority CWR species to conserve ex situ if all the available diversity is to be captured and represented ex situ. One of the compelling reasons for this undertaking is that even if some of these priority CWR taxa may have been collected and conserved ex situ, they may represent only few populations of the total diversity occurring in situ. V. unguiculata subsp. spontanea, Eleusine indica subsp. indica, S. bicolor subsp. verticiflorum, V. unguiculata subsp. tenius, Pennisetum purpureum and S. incanum have five accessions held in the ex situ collection, and Oryza barthii, O. longistaminata, O. brachyantha, Vigna unguiculata subsp. dekindtiana, V. juncea, E. coracana subsp. africana and V. multinervis have more than five accessions conserved ex situ (Table 2).
Conclusion
Based on complementarity analysis, we have identified four locations in Sumbu, Kasanka, Mosi-Oa-Tunya and South Luangwa National Parks where CWR should be actively conserved in situ, as well as two locations in North western province at the source of Zambezi River and Mbala district in Northern province, where a less formal approach should be taken to in situ CWR conservation. In addition, we have identified three locations in Mpongwe district, Eastern and Lusaka provinces where further population sampling is required for ex situ genebank conservation, given the high risk of human encroachment and increased human activities such as land clearing for agriculture. However, prior to conservation of the priority CWR taxa at the identified locations for active conservation there is a need for field validation to confirm their presence considering that the analysis was based on data and information from past genebank and herbarium specimen.
Based on the results obtained, a National Strategy and Action Plan (NSAP) for conservation of priority CWR was developed and approved by the Zambian government and contains a number of concrete action points such as:
(i) integration of in situ conservation priorities consistent with the National Biodiversity Strategic Action Plans (NBSAP);
(ii) confirmation of occurrence of priority CWR taxa both within and outside identified protected areas before establishment of genetic reserves in the four identified locations;
(iii) establishment of a regular monitoring system to assess any short and longer term changes in CWR diversity, to help inform the management authority of the effectiveness of the management prescriptions of a CWR Action Plan and/or genetic reserve management plan;
(iv) targeted collection of priority CWR species such as C. zeyheri, D. bulbifera, D. dumetorum, O. punctata, Solanum aureitomentosum, V. phoenix and V. unguiculata subsp. pawekiae that are not represented or are underrepresented in the genebank should be undertaken. There should also be consideration for in vitro storage of priority CWR propagules and establishment of field genebanks for vegetative propagated priority CWR taxa such as S. aureitomentosum that may not be conserved in form of seed.
Supplementary material
The supplementary material for this article can be found at https://doi.org/10.1017/S1479262118000497.
Acknowledgements
The research accomplished in this project was conducted through the 3 years SADC Crop Wild Relatives project (http://www.cropwildrelatives.org/sadc-cwr-project/) with the financial support of the European Union/African Caribbean and Pacific through the Bioversity International in partnership with the University of Birmingham. Partner countries in the SADC Crop Wild Relatives project, Mauritius and South Africa, are also commended for the progressive regional collaboration during the 3 years of the project period.