1 Introduction
The aim of the paper is to identify the phonetic parameters used by Akan speakers to differentiate a Yes–No question from an otherwise string-identical declarative statement. A further aim is to investigate which of the attested phonetic parameters are perceptually relevant cues for the discrimination of the mode of a sentence. We argue that the cues that are functionally used in speech perception lead to establish a phonological representation of question intonation of Akan. The paper thus contributes to the discussion on the typology of question intonation proposed by Rialland (Reference Rialland, Riad and Gussenhoven2007, Reference Rialland2009) by providing controlled and quantitative data of an African tone language, the majority of which are (experimentally) understudied (Zerbian, Genzel & Kügler Reference Zerbian, Genzel and Kügler2010). To this end, a production experiment and two perception experiments are presented.
In the remainder of the introduction, a general background on the production of question intonation in tone languages is given in Section 1.1. Section 1.2 presents relevant experiments conducted on the perception of question intonation in tone languages. In Section 1.3, selected aspects of the typology of question intonation in African languages proposed by Rialland (Reference Rialland, Riad and Gussenhoven2007) are introduced. Finally, in Section 1.4, background on Akan tone and intonation is provided.
1.1 Production of question intonation in tone languages
Intonation is assumed to be a prosodic phenomenon that is linguistically structured and conveys sentence-level pragmatic meaning (Ladd Reference Ladd2008). The phonetic correlates of intonation are f0, duration and intensity. f0 is usually considered as the main correlate. We adopt the autosegmental–metrical (AM) framework of intonational phonology (see Ladd Reference Ladd2008), originally developed for the intonation language English in which all tones function to convey pragmatic meaning (see Pierrehumbert & Hirschberg Reference Pierrehumbert, Hirschberg, Cohen, Morgan and Pollack1990). Following the AM approach, the tonal structure of an English utterance consists of post-lexical phonological tones that appear as pitch accents within, and boundary tones at the edge of prosodic phrases. Pitch accents associate with metrically strong syllables. A syllable is the typical tone bearing unit (TBU). Boundary tones, which are of relevance here, are associated with a left and/or a right phrasal edge such as a phonological phrase (PhP) or an intonation phrase (IP), and are transcribed as either L(ow)% or H(igh)%. All tones are phonetically realized as tonal targets, and the intonation of an utterance is conceived of as a sequence of such targets and interpolation between them. Language-specific phonetic implementation rules determine the scaling and alignment of the tonal targets.
The tonal structure of an utterance in tone languages is mainly determined by the choice of words, i.e. the lexical tones determine the f0 contour. However, the investigation of whether and to which extend tone languages use intonation has been and remains an exciting area of research (e.g. Yuan Reference Yuan2004 on Mandarin; Hyman & Monaka Reference Hyman and Monaka2008 on Shekgalagari; Rialland Reference Rialland, Riad and Gussenhoven2007, Reference Rialland2009; Zerbian, Downing & Kügler Reference Zerbian, Downing and Kügler2009 and Downing & Rialland Reference Downing and Rialland2016 on different African tone languages; Kügler & Genzel Reference Kügler and Genzel2012 on Akan; Brunelle, Ha & Grice Reference Brunelle, Phương and Grice2012 on Northern Vietnamese; Michaud & Vaissière Reference Michaud and Vaissière2015 on different Asian tone languages).
Hyman & Monaka (Reference Hyman and Monaka2008: 269f.) summarize the range of possible interactions of tone and intonation under the headings ‘accommodation’, ‘submission’ and ‘avoidance’. ‘Accommodation’ refers to the situation in which lexical and post-lexical tones co-exist. For example Myers (Reference Myers1996) shows for Chichewa, a Bantu language with two tones that Yes–No questions are realized with an additional H%, which does not affect the presence and the identity of the lexical tones, and H tones are in general realized higher in questions than in statements. Additionally, downdrift, which refers to the lowering of a H tone by a preceding L tone (Connell Reference Connell, van Oostendorp, Ewen, Hume and Rice2011), is less in questions than in statements.
In the case of ‘submission’, lexical tones may be overridden by post-lexical tones. This has been documented for Yes–No questions in Shingazidja (Patin Reference Patin2016), a Bantu language with two tones. In Shingazidja syllables may be underlying (lexically) unspecified for tone and may receive their tonal specification via H tone shift. The Yes–No question is signaled by a super-high tone which appears on the penultimate syllable of the phrase affecting the underlying lexical tone. Additionally, the pitch register may be optionally raised in questions.
Finally, ‘avoidance’ refers to the scenario in which post-lexical tones are absent. This has been suggested for Yes–No questions in Yoruba, a Niger-Congo language with three tones (Connell & Ladd Reference Connell and Ladd1990) and Mambila, a Benue-Congo language with four tones (Connell Reference Connell and Akinlabi2005). In these languages, there is no phonetic indication of the presence of a boundary tone in Yes–No questions. ‘Avoidance’ may be complete as in Yoruba, or incomplete. In the latter case a post-lexical process applies which leads to the overriding of the tonal correlate(s) of intonation by lexical tones (Hyman & Monaka Reference Hyman and Monaka2008: 270).
These observations raise the question how post-lexical tones, in particular boundary tones, can be distinguished from lexical tones. As mentioned above, in the AM approach a boundary tone is phonologically associated with a phrase boundary, in the majority of the languages with the right edge of the IP (Pierrehumbert & Beckman Reference Pierrehumbert and Beckman1988). Given that (almost) each TBU is usually associated with a lexical tone in a tone language, and given the appearance of a boundary tone at the right edge of an IP, an utterance-final syllable may carry two tonal events (‘accommodation’), which need to be articulated. A boundary tone may affect the scaling of final tones, the duration and intensity of phrase-final segments, which we observe for Akan below. Additionally, a boundary tone may cause global effects like changes in the pitch register.
Concerning the scaling of tones, we may expect boundary tones to have an observable local effect in the terminal region of an utterance. However, the precise excursion is subject to language-specific tonal implementation rules (Pierrehumbert Reference Pierrehumbert1980). Possible scaling scenarios are listed in (1), based on Pierrehumbert & Hirschberg (Reference Pierrehumbert, Hirschberg, Cohen, Morgan and Pollack1990) and Rialland (Reference Rialland, Riad and Gussenhoven2007).
(1)


Clear effects like an f0 rise or f0 fall are expected if the final lexical tone and the boundary tone are distinct as in (1a) and (1b). The boundary tone may however not be distinguishable from the final lexical tone by its scaling if these are identical as in (1c) and (1d). If a final lexical H tone is adjacent to a H%, as in (1c), the f0 may stay at the same level or slightly rise, and if a lexical L tone is followed by a L% the f0 may stay at the same level or may fall to the baseline, see (1d).
Further phonetic effects, which have been reported with respect to questions, relate to the duration and/or the intensity of the utterance-final syllable or word. Concerning duration, Rialland (Reference Rialland, Riad and Gussenhoven2007: 42) remarks that lengthening of a phrase-final element may indicate the presence of a boundary tone. The addition of a tonal target to the tonal string may also cause an increase in intensity (see Vaissière Reference Vaissière, Cutler and Ladd1983: 65).
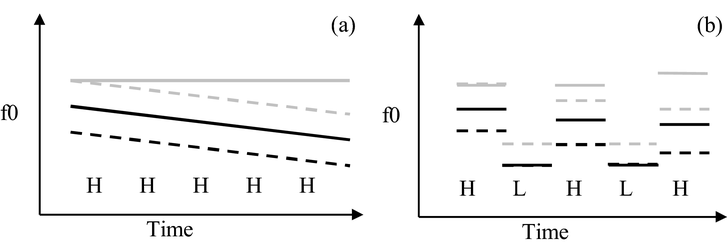
Apart from local phonetic effects, boundary tones can be distinguished from lexical tones by their sphere of action: since boundary tones associate with the edge of a prosodic phrase (Pierrehumbert & Beckman Reference Pierrehumbert and Beckman1988) they may cause global f0 effects affecting the entire prosodic phrase. The magnitude and domain is again under regulation of phonetic implementation rules, hence the effects are language-specific. Figure 1, based on Connell (Reference Connell and Akinlabi2005: 108), visualizes possible global register effects, either with a tonal string of the same lexical tone identity (H) as in Figure 1 panel (a), or with a string of alternating lexical HL tones as in Figure 1 panel (b). The solid black line represents the f0 of a statement and serves as baseline for comparison. The H tones in Figure 1 panel (a) are subject to declination, which refers to an observable downward trend of the f0 during the course of an utterance (Collier Reference Collier1975). The H tones in Figure 1 panel (b) exhibit downdrift. The dashed black line in Figure 1 panel (a) and panel (b) refers to the case in which a language signals a Yes–No question by lowering of the entire register (register lowering). The lexical tones of the Yes–No question are realized lower than in the statement while the declination pattern (Figure 1 panel (a)) or the downdrift pattern (Figure 1 panel (b)) is preserved. The dashed grey line in Figure 1 panel (a) and panel (b) describes the case of a Yes–No question realization in which the whole register shifts upwards (register raising). This may go together with a reduction or cancellation of declination as illustrated by the solid grey line in Figure 1 panel (a), and a reduction or suspension of downdrift in Figure 1 panel (b).
Schematic representation of f0 contours illustrating global f0 effects; (a) sentence with lexical tones of the same tonal identity (H tones only), (b) sentence with alternating lexical HL tones; solid black line – statement, dashed black line – question with lowered register, dashed grey line – question with raised register, and solid grey line – question with raised register and with suspended declination (a) and with suspended downdrift (b).

As an alternative analysis, Cruttenden (Reference Cruttenden1997: 9f.) and Yip (Reference Yip2002: 275f.) consider ‘superimposed intonation’ or ‘pitch range adjustments’ as discrete properties of some tone languages. However, the global f0 effect in most of the experimentally investigated cases (e.g. Myers Reference Myers1996 for Chichewa) is assimilatory with regard to a right-aligned H% (see Myers Reference Myers, Bel and Marlien2004). As noted by Rialland (Reference Rialland, Riad and Gussenhoven2007), register expansion together with downdrift reduction also appears together with a L%. As shown in Section 1.4, Akan has been claimed to be a language that combines L% with a higher register and downdrift reduction amongst other phonetic parameters. The presence and possible interactions of the aforementioned parameters are investigated and analyzed in this paper.
1.2 Perception of question intonation in tone languages
The perception of intonation in tone languages is even more understudied than its production. However, the existing studies show that local phrase-final phonetic parameters are relevant for the identification of sentence mode. Ma, Ciocca & Whitehill (Reference Ma, Ciocca and Whitehill2011) investigated the perception of sentence mode in Cantonese, a Sino-Tibetan language with six tones, using the identification task. Cantonese Yes–No questions are characterized by a final rise and an optional raised pitch register. The perception experiment revealed that the f0 characteristics of the sentence-final region are crucial for the identification of the mode of a sentence, whereas the raised register of questions is secondary. Mixdorff et al. (Reference Mixdorff, Mohasi, Machobane and Niesler2011) studied Sesotho, a Southern Bantu language with two tones. In Sesotho, Yes–No questions are produced with a higher speech rate, a raised pitch register and a shorter penultima in comparison to statements. Mixdorff et al. found that all three factors contribute to the perception of sentence mode, though the shorter penultima is the most important cue. The only gating experiment we are aware of investigates the perception of Yes–No questions in Xhosa, a Southern Bantu language with two tones. The production data of Jones, Louw & Roux (Reference Jones, Louw and Roux1998a) showed that Xhosa uses a higher speech rate, a shorter penultima, a higher f0 on the penultima, a raised pitch register and a higher intensity in Yes–No questions in comparison to statements. The data of the perception experiment revealed that the f0 and the duration of the penultima are decisive for the identification of the mode of the sentence (Jones, Louw & Roux Reference Jones, Louw and Roux1998b). The raised pitch register can trigger question identification from the beginning of a sentence, but the phonetic parameters of the penultimate can override an earlier decision.
The above mentioned studies show that primarily the language-specific, local phrase-final parameters are decisive for the correct identification of the sentence mode. Interestingly, the three languages employ a raised pitch register in questions irrespective of the local and usually sentence-final phonetic parameters of question intonation. These observations may point in the direction that Yes–No question prosody exhibits a language-specific component and a universal one, see also Cahill (Reference Cahill, Kramer, Zsiga and Boyer2015). From the few studies and languages investigated, we would suggest a provisional scale in (2) below, which arranges global and local cues in relation to their perceptual relevance in determining the mode of a sentence.
(2)

In (2), we would propose that a language-specific cue has more perceptual relevance than a global, presumably universal, cue. A global effect, like pitch register raising, should be of low perceptual relevance if language-specific local cues are present (see Genzel Reference Genzel2013: Chapter 6).
1.3 Typology of question intonation from an African perspective
Research on intonation in tone languages has substantiated that phonetic parameters involving high or higher f0 in interrogatives are by no means universal (Rialland Reference Rialland, Riad and Gussenhoven2007, Reference Rialland2009; Downing & Rialland Reference Downing and Rialland2016). In particular, Rialland (Reference Rialland, Riad and Gussenhoven2007, Reference Rialland2009) classifies the question intonation of African languages, based on production data, along two main categories: H-pitched and non-H-pitched question intonation. Some selected indicators of both categories, which are relevant for the current paper, are summarized in Table 1. A language may use one or more of the indicators to signal a Yes–No question. For instance, Gã, another Kwa language with two tones spoken in Ghana, has been reported to use the H-pitched parameters register expansion and/or reduction of downdrift, cancellation or reduction of final lowering and the non-H-pitched parameter: final polar tone (Rialland Reference Rialland, Riad and Gussenhoven2007: 59). Hence, Gã presents a prime example of a language that constitutes a ‘hybrid’ system in which H-pitched and non-H-pitched question intonation markers are used alongside to differentiate a Yes–No question from a statement.
Selected indicators of H-pitched and non-H-pitched question intonation based on Rialland (Reference Rialland, Riad and Gussenhoven2007: 37f.).

Rialland (Reference Rialland, Riad and Gussenhoven2007: 51; Reference Rialland2009: 929) further proposes that H-pitched question intonation can be described as a ‘tense’ prosody, which is characterized by rising intonation, vocal cord tension and glottal adduction, opposed to a ‘lax’ prosody, which goes together with vocal cord abduction and little longitudinal tension (relaxation) in the terminal region of an utterance. This laryngeal setting results in breathy voice quality and f0 lowering. However, at the same time Rialland suggests to view lengthening as a form of enhancement, to make other non-H-pitched indicators more salient.
One of the most striking outcomes of Rialland's survey has been the observation that there are languages which only use non-H-pitched question parameters. Among the language families belonging to this camp are most Gur, Mande and Kru languages, some Benue-Congo languages and importantly also most of the Kwa languages including Akan (Asante). Hence, Rialland (Reference Rialland, Riad and Gussenhoven2007, Reference Rialland2009) classifies Akan as ‘lax’ prosody language, which uses non-H-pitched markers only. Cahill (Reference Cahill, Kramer, Zsiga and Boyer2015) investigated the intonation of Yes–No questions in selected Gur and Kwa languages, which are not part of Rialland's survey, and confirmed the presence of non-H-pitched indicators or ‘lax’ prosody characteristics such as falling f0 and final lengthening. However, at the same time all languages of his sample also showed H-pitched question intonation characteristics in terms of register raising. Register raising was accompanied by a register expansion in three out of five investigated languages. Hence, at least some Gur and Kwa languages may be better classified as ‘hybrid’ systems on production-based phonetic parameters along the lines of Rialland's typology. This indicates that the meritorious classification of Rialland may be refined or extended. Our study on Akan question intonation contributes to the refinement of Rialland's classification in that we add perceptual data which we suggest to take as the crucial criterion for the classification of a language.
1.4 Background on Akan tone and intonation
Akan is a Kwa language that belongs to the Niger-Congo family spoken in the central and southern regions of Ghana by about 8.3 million speakers (Simons & Fennig Reference Simons and Fennig2017). Several dialects are covered by the term Akan (Dolphyne & Kropp Dakubu Reference Dolphyne, Kropp Dakubu and Kropp Dakubu1988), which may differ segmentally and/or tonally (Schachter & Fromkin Reference Schachter and Fromkin1968, Dolphyne Reference Dolphyne1988 among others). The speakers and listeners contributing the data for this paper speak one of the three major dialects, Asante Twi. We use the name Akan throughout the paper.
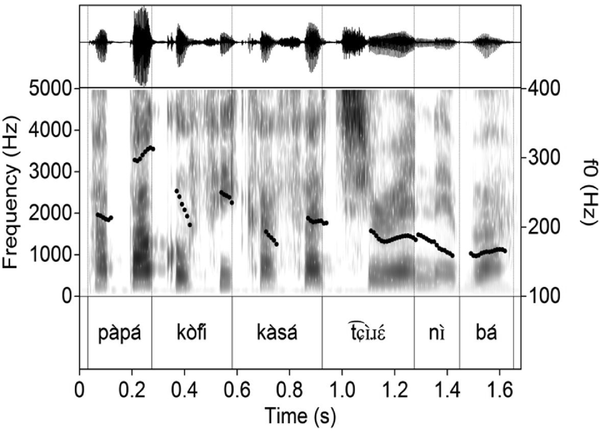
Akan is a level tone language according to the definition of Hyman (Reference Hyman, Goldsmith, Riggle and Yu2011: 199) without lexical stress (but see Christaller Reference Christaller1933). It exhibits two contrasting tones (e.g. Stewart Reference Stewart1965, Dolphyne Reference Dolphyne1988). H tone is marked by an acute accent and L tone, by a grave accent. We assume that the syllable can be taken to be the TBU in Akan (but see Paster Reference Paster2011). The average duration of a syllable depends, among other things, on its tone: syllables that carry a L tone are by about 80–100 ms shorter than syllables that carry a H tone (Manyah Reference Manyah, Belotel-Grenié and Grenié2006). Tone has both lexical and grammatical function in Akan (e.g. Dolphyne Reference Dolphyne1988, Paster Reference Paster2011). Syntactically, Akan is an SVO language with head-initial properties. Nouns precede determiners, adjectives, and numerals and adverbial modifiers follow adjectives, etc. (e.g. Saah Reference Saah1988, Boadi Reference Boadi2005). Uttered in a sentence, the tones show a considerable amount of f0 lowering. In sequences of alternating tones downdrift applies. This is illustrated in Figure 2, which shows the sentence displayed in (3). The glossing abbreviations are listed in Appendix A. Downdrift in Akan has been widely acknowledged and has led to the classification of Akan as a terraced-level tone language (Welmers Reference Welmers1959, Reference Welmers1973; Clements Reference Clements1979; Dolphyne Reference Dolphyne1988; Abakah Reference Abakah2000; Genzel & Kügler Reference Genzel, Kügler, Lee and Zee2011).
(3)

Waveform, spectrogram and f0 contour of a sentence with alternating LH tones (3); female speaker 18.

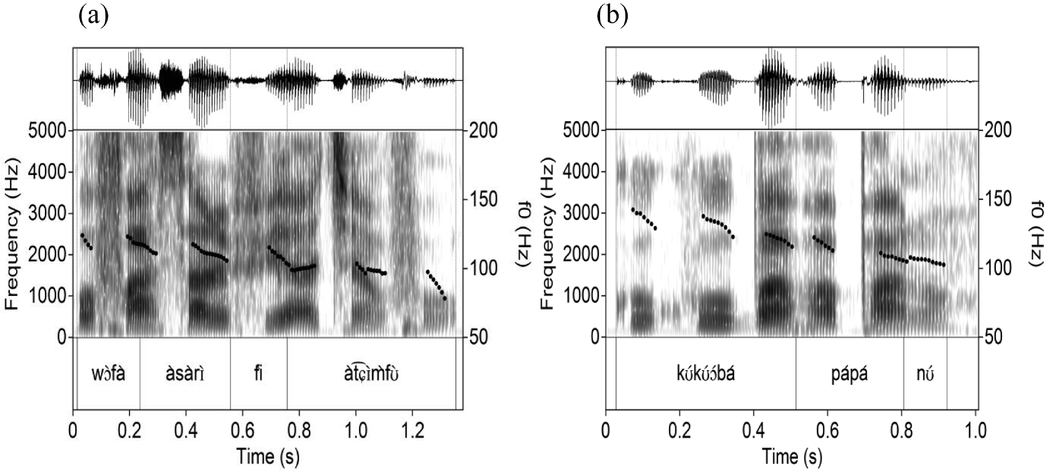
The lowering of f0 throughout an utterance is not limited to sentences with alternating tones, it also occurs in sentences containing L tones only or H tones only (Genzel Reference Genzel2013). The declination effect is illustrated in Figure 3 with a sentence containing L tones only (4a) and a sentence containing H tones only (4b).
(4)

Waveform, spectrogram and f0 contour of sentences with the same tonal identity ((4a) and (4b)); (a) L tones; (b) H tones; both panels show data from male speaker 23.

According to Dolphyne (Reference Dolphyne1988: 56), final L tones in Akan show final lowering, which is generally characterized as an abrupt fall in f0 in the last centiseconds of an utterance (Liberman & Pierrehumbert Reference Liberman, Pierrehumbert, Aronoff and Oehrl1984, Pierrehumbert & Beckman Reference Pierrehumbert and Beckman1988, Herman, Beckman & Honda Reference Herman, Beckman, Honda, Bunnell and Idsardi1996). Final lowering is visualized on the final vowel of the sentence containing only L tones, see (4a), in Figure 3 panel (a).
Akan exhibits two levels of phrasing, the level of the IP and the lower level of the PhP (Kügler Reference Kügler2015). According to Kügler (Reference Kügler2015), a simple SVO sentence as in (4a) is phrased in two PhPs, as shown in (5).
(5)

The subject noun phrase forms one PhP and the verb phrase including the object noun phrase forms the second PhP. There are no phrasal tones that indicate prosodic phrasing in Akan, however PhP boundaries block a process of regressive vowel harmony between words (Kügler Reference Kügler2015). As for duration, Genzel (Reference Genzel2013: 229) showed that there is no evidence for pre-boundary lengthening in Akan.
To summarize, the default intonation in a declarative sentence is falling. The PhP and the IP are not tonally marked (Genzel Reference Genzel2013, Kügler Reference Kügler2016), though the PhP becomes evident by blocking of a segmental phonological process (Kügler Reference Kügler2015). Declination and downdrift apply throughout the sentence and sentence-final lexical L tones exhibit final lowering whereas sentence-final lexical H tones do not (see Genzel Reference Genzel2013 for further details and Kügler Reference Kügler2016 for an overview).
Yes–No questions display the same word order as statements and can be expressed without a question particle. An example of a statement and the corresponding Yes–No question is presented in (6a) and (6b), respectively. It shows that the lexical tones do not differ (Dolphyne Reference Dolphyne1988: 55f.).
(6)

However, a number of phonetic parameters have been observed to distinguish the two. These parameters occur both locally on the final syllable and globally over the whole utterance. The local parameters comprise f0 excursion, duration, intensity and phonation (Christaller Reference Christaller1875; Dolphyne Reference Dolphyne1988; Boadi Reference Boadi1990; Abakah & Koranteng Reference Abakah and Koranteng2007; Rialland, Reference Rialland, Riad and Gussenhoven2007, Reference Rialland2009; Genzel Reference Genzel2013). The global parameter refers to a generally raised pitch register, i.e. both L and H tones are realized higher in Yes–No question compared to statements (Berry & Aidoo Reference Berry and Aidoo1975: 18; Dolphyne Reference Dolphyne1988: 55; see Figure 1 in Genzel Reference Genzel2013: 183). Dolphyne (Reference Dolphyne1988: 56) additionally notes that the difference of the register raising effect is smaller if the sentence contains only L tones. Also from a global perspective, Gussenhoven (Reference Gussenhoven2004: 84), remarks that downdrift in Akan is suspended in Yes–No questions which results in an f0 pattern that is represented by the solid grey line in Figure 1. He further cites Hyman's (Reference Hyman, Haspelmath, König, Oesterreicher and Reible2001) tentative observation on the suspension of downdrift in questions. However, Genzel (Reference Genzel2013: 185) shows that the downdrift pattern is not suspended in Yes–No questions and that the step down exhibits a constant amount between sentence modes. As for local parameters, there is agreement that f0 excursion on an utterance final H tone exhibits a falling f0 movement in Yes–No questions, which is not present in statements. Dolphyne (Reference Dolphyne1988: 56) claims that final lowering on a final L tone is reduced or cancelled in Yes–No questions. A clear property of Yes–No questions is the lengthening of the sentence-final syllable (Christaller Reference Christaller1875: 97; Boadi Reference Boadi1990: 72; Rialland Reference Rialland, Riad and Gussenhoven2007, Reference Rialland2009; Genzel Reference Genzel2013). In particular, Genzel (Reference Genzel2013: 188) measured the duration of sentence-final vowels in statements and questions and calculated a lengthening of approximately 19% in Yes–No questions. Besides the lengthening effect, Boadi (Reference Boadi1990: 72) further observes that the sentence-final syllable in Yes–No questions is accompanied by ‘a peculiar kind of phonation, possibly the Akan equivalent of one feature specification of Voicing or Glottalisation’. Boadi additionally mentions ‘extra voicing’, which he however does not explain further. We may interpret this as higher amplitude/higher intensity. Genzel (Reference Genzel2013: 190) measured intensity on the final syllable of Yes–No questions and corresponding statements and found a higher intensity in Yes–No questions. The intensity measure was a relative one, which we use in this study as well. It sets the intensity of the sentence-final syllable in relation to the intensity of the whole utterance. The phonetic parameters distinguishing Yes–No questions from statements in Akan are classified along the lines of Rialland's (Reference Rialland, Riad and Gussenhoven2007) H-pitched and non-H-pitched questions intonation markers in Table 2.
H-pitched and non-H-pitched question prosody parameters of Akan based on impressionistic observations in the literature.

What emerges from Table 2 is that the Yes–No question parameters impressionisticly reported for Akan are distributed both in the ‘tense’ and in the ‘lax’ prosody camp. A production experiment quantitatively investigating which of the above mentioned phonetic parameters Akan speakers use to differentiate Yes–No questions from statements is reported in Section 2. Two perception tests that examine which of the phonetic parameters of Yes–No question found in the production data are functionally used as cues for question identification are reported in Section 3.
2 Production experiment
2.1 Method
2.1.1 Speech materials
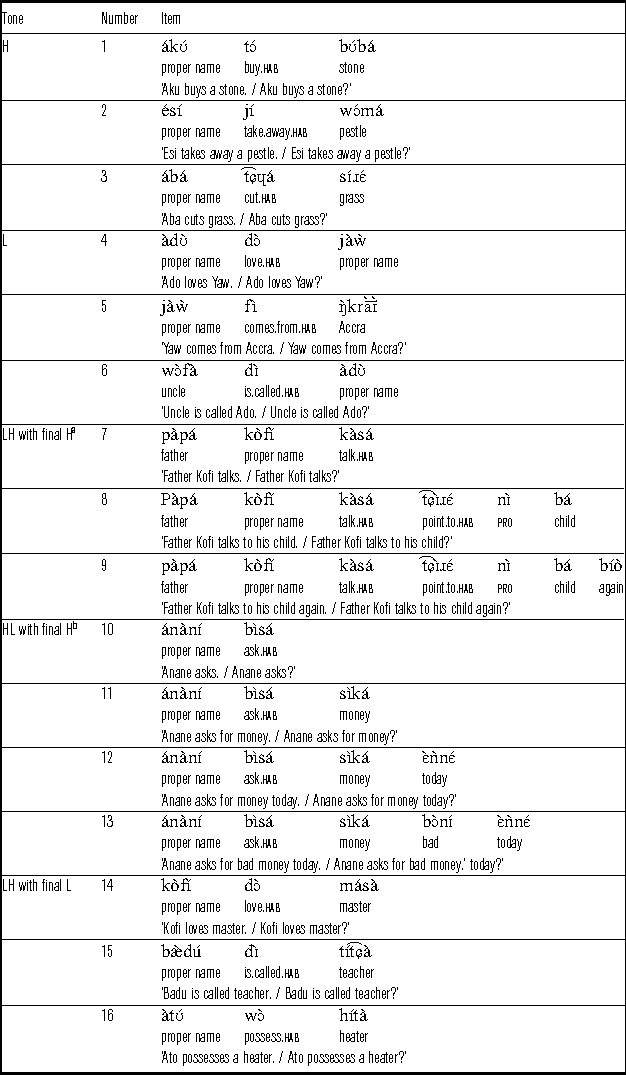
The materials used for the production experiment consist of 16 string-identical statement-question pairs listed in Table 3. Sentences had five different tonal configurations: H tones only, L tones only, alternating LH tone sequences ending in a sentence-final H tone or in a sentence-final L tone and alternating HL tone sequences ending in a sentence-final H tone. The different tonal configurations of the sentences were constructed to test for register effects of initial H and L tones, to examine downdrift and declination, and to observe the behaviour of final H and L tones. Since the sound system of Akan consists of only a few sonorant consonants (see Dolphyne Reference Dolphyne1988) most words used in this study contain obstruents, although sonorant sounds are usually desired in intonation research.
Speech materials divided by five tonal configurations.

a These three items were recorded by Genzel (Reference Genzel2013).
b These four items were recorded by Genzel (Reference Genzel2013), though only statements were discussed.
2.1.2 Speakers
Altogether, 23 native speakers of Asante Twi participated in the recordings. All participants declared English as their second language. Six native speakers (one female and five male) living in Minot (US) were recorded. All of them were students with higher university degree and their average age was 28 years. They used Akan on a daily basis since they knew each other and met each other frequently at the university, in the church and at a shared apartment where four out of six lived together. All six originated from in and around Kumasi. Further 17 native speakers (seven female, ten male) were recorded. All of them were students at the Universities of Accra and Kumasi (Ghana) and their average age was 25 years. Each speaker was paid a small fee for participation.
2.1.3 Recordings
Parts of the recordings were carried out in 2010, in Minot (US) as part of Genzel's (Reference Genzel2013) dissertation. The remaining and completed data set was recorded in 2012 in Accra and Kumasi (Ghana). All speakers were recorded at a sampling frequency of 44.1 kHz and 32 bit resolution, using Audacity and a headset (Logitech Internet Chat Headset) that was connected to an Edirol UA-25 sound card plugged in to a laptop (Levono R61). The experiments were carried out in a quiet room. The material was presented in a pseudo-randomized order with the use of presentation software. Each sentence was presented on a separate slide. Items from other unrelated experiments were interspersed as fillers. The target to filler ratio was 1:1 to 1:5 on average. All test sentences were prepared in Akan orthography with English translation below the target sentence, since the orthography lacks marking for tone. Sentence mode was signaled visually by either a question mark (?) or a full stop (.). The participants were instructed to read the sentence on the slide silently and consult the English translation in case of tonal ambiguities. After this step, they were asked to produce the sentence aloud. The presentation flow was self-paced. Each recording session took about 25 minutes on average. In case of mistakes or slips of the tongue, the experimenter asked the speakers to repeat their reading of that sentence. In total, 558 sentences were recorded (first set, 2010: 6 speakers × 3 repetitions × 7 sentences × 2 conditions = 252 sentences; second set, 2012: 17 speakers × 3 tone sequences × 3 items × 2 conditions = 306 sentences).
2.1.4 Data pre-processing
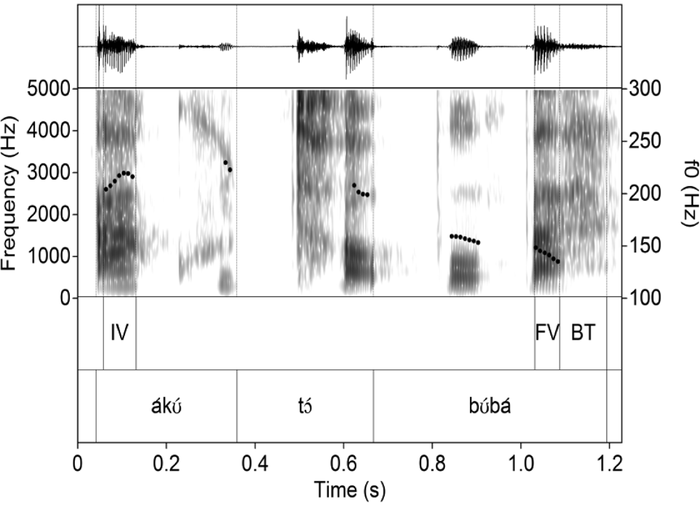
For each statement and question, the initial vowel (IV) and the final vowel (FV) were labelled in Praat (Boersma & Weenink Reference Boersma and Weenink2015). An example is presented in Figure 4. Standard cues for segmental labelling were used (Turk, Nakai & Sugahara Reference Turk, Nakai, Sugahara, Sudhoff, Lenertova, Meyer, Pappert, Augurzky, Mleinek, Richter and Schliesser2006). If IV was followed by a sonorant onset, as in ánànɪ́ ‘Anane’, the boundary was set at the temporal mid of the onset of the following syllable, because the H tone reached its maximum very late; see Figure 9. For FV, the end of regular F2 was chosen as an endpoint for the modal phonation of the final sonorant.
Waveform, spectrogram and f0 contour of a sentence with H tones (Table 3, number 1) with domains of measurement: initial vowel (IV) and modal phonation part of final vowel (FV); BT refers to breathy termination of the final vowel; female speaker 18.

The initial vowel represents the domain in which the global Yes–No question parameter (Berry & Aidoo Reference Berry and Aidoo1975, Dolphyne Reference Dolphyne1988, Genzel Reference Genzel2013, and Table 2) may be realized. It is the TBU of the initial lexical tone which has been found to serve as reference value for the scaling of the following tone(s). We therefore assume that the f0 of the initial lexical tone can be regarded as an indicator of the choice of the pitch register of an utterance (e.g. Huang Reference Huang and Jensen1980, Reference Huang and Goyvaerts1985; Liberman & Pierrehumbert Reference Liberman, Pierrehumbert, Aronoff and Oehrl1984). This assumption is also reflected in the use of sentence-initial f0 in the investigation of preplanning effects (e.g. Rialland & Somé Reference Rialland, Somé, Carstens and Parkinson2000, Laniran & Clements Reference Laniran and Clements2003, Connell Reference Connell, Bel and Marlien2004, Genzel Reference Genzel2013).
FV represents the domain in which the local parameters of Yes–No questions may be realized (Rialland Reference Rialland, Riad and Gussenhoven2007, Genzel Reference Genzel2013, and see Table 2). It is the TBU of the final lexical tone which is expected to interact with a potential boundary tone; see Section 1.1 for further details and references. A note is due on the characterization of Akan as belonging to the ‘lax’ question intonation group (Rialland Reference Rialland2009, Table 2). According to Rialland (Reference Rialland, Riad and Gussenhoven2007: 50), Yes–No questions in ‘lax’ question prosody languages may end in breathy phonation. For Akan however, Rialland did not report the presence of breathy termination (BT). Previous work by Genzel (Reference Genzel2013) showed that BT occurred optionally in Akan in both statements and Yes–No questions, and there was no systematic difference between the two. Therefore, we decided to restrict our measuring domain to the modal part of FV.
f0, duration and intensity of IV and FV were extracted with the help of ‘ProsodyPro’ (Xu Reference Xu, Bigi and Hirst2013), a script running under Praat (Boersma & Weenink Reference Boersma and Weenink2015). The script was executed with default settings. It extracted mean values for f0 (Hz) and intensity (dB) via Praat's ‘Get mean’ function for IV and FV from a Pitch object and an Intensity object, respectively. Additionally, the values for the final f0 were extracted by the script using the default stetting, which is 0.03 sec before the final offset. The final offset was defined as the end of the modal phonation of FV. Finally, the script extracted the f0 difference between the highest f0 and lowest f0 in FV. The following measures were compared between Yes–No questions and statements:
i. Mean f0 values of IV in Hz, to assess differences in the global pitch register (Berry & Aidoo Reference Berry and Aidoo1975, Dolphyne Reference Dolphyne1988, Genzel Reference Genzel2013).
ii. Duration of FV in ms, to assess the local lengthening effect (Christaller Reference Christaller1875, Boadi Reference Boadi1990, Genzel Reference Genzel2013).
iii. Mean intensity of FV in relation to the mean intensity of IV in dB, to assess the local effect of intensity (Genzel Reference Genzel2013) or ‘extra final voicing’ (Boadi Reference Boadi1990). Following Remijsen & van Heuven (Reference Remijsen and van Heuven2005), the mean intensity of FV was subtracted from the mean intensity of IV. The assumption for this relative measure is that the smaller the difference in intensity between IV and FV, the higher the absolute intensity of FV. Note that an absolute higher intensity of FV in Yes–No questions would thus be expressed by a lower value of relative intensity.
iv. Final f0 point of FV in Hz, to assess the local scaling effect caused by a potential boundary tone in Yes–No questions (e.g. Dolphyne Reference Dolphyne1988, Abakah & Koranteng Reference Abakah and Koranteng2007, Genzel Reference Genzel2013), see (1) above.
v. f0 excursion of FV in semi-tones (st) was calculated by the script with a reference value of 1. f0 excursion substantiates potential local interaction effects, see Section 1.1. and (1), between the final lexical tone and the potential boundary tone in Yes–No questions and tests for cancellation/reduction of final lowering in cases of final lexical L tones (Dolphyne Reference Dolphyne1988). This measurement is equivalent to the f0 range measurement in Ma et al. (Reference Ma, Ciocca and Whitehill2011).
We report standard values emitted by ‘ProsodyPro’ to ensure comparability with other studies using the script.
2.1.5 Predictions and statistical analysis
Generally, we predict that Yes–No questions differ prosodically from statements. The specific predictions are listed in (7) and (8) for global and local parameters separately.
(7) Global parameter
The pitch register is higher in Yes–No questions.
(8) Local parameters at FV
a. Duration of FV is longer in Yes–No questions.
b. Intensity of FV is higher in Yes–No questions, i.e. relative intensity is lower in Yes–No questions.
c. Final f0 of FV is lower in Yes–No questions if the final lexical tone is H. Final f0 of FV is higher in Yes–No questions if the final lexical tone is L.
d. f0 excursion of FV is larger in Yes–No questions if the final lexical tone is H. f0 excursion of FV is smaller in Yes–No questions if the final lexical tone is L.
The results of the phonetic analysis were evaluated against the fixed factor sentence mode with the two levels, statement (S) and Yes–No question (YNQ) in R (R Development Core Team 2015) using linear mixed models from the lme4 package (Bates et al. Reference Bates, Maechler, Bolker, Steven and Walker2015). The reference level for sentence mode was S. Random intercepts for speaker and repetition, and by-speaker and by-repetition random slopes (Barr et al. Reference Barr, Levy, Scheepers and Tily2013) for sentence mode were added to the models assuming that speakers might differ with regard to how they react to the experimental manipulation and that the reaction might also differ for items/repetitions. To access p-values, we constructed an intercept-only model and tested it against the full model with sentence mode as fixed factor. Both models had an equal random factor structure. The two models were compared with the help of a likelihood ratio test. A p < .05 was taken to indicate significance. Since we expected final L and final H tones to differ in their response towards the experimental manipulation with regards to the f0 parameters, two separate models were calculated for each tonal entity.
2.2 Results of the production experiment
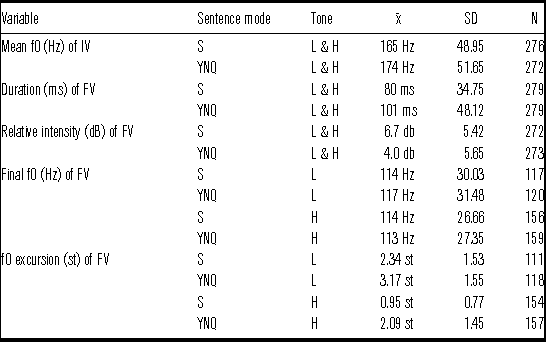
Table 4 presents the results of the statistical analysis. In line with our prediction, the pitch register, measured as mean f0 of IV, is significantly higher in Yes–No questions than in statements. The duration of FV is significantly longer and the relative intensity is significantly lower in Yes–No questions than in statements. Contrary to the expectations, the final f0 value of the final H tone does not differ systematically between the conditions nor does the final f0 value of the final L tone. As predicted, f0 excursion is larger in Yes–No questions ending in a H tone than in statements ending in a H tone. Contrary to the expectations, we found the same effect, i.e. a significantly larger f0 excursion in Yes–No questions ending in a L tone than in statements ending in a L tone. The means aggregated over speakers and items and their standard deviations are given in Table 5.
Report of the linear mixed effects models, specified in Section 2.1.5.

IV = initial vowel, FV = final vowel; S = statement; YNQ = Yes–No question
Mean values aggregated over speakers (n = 23), tonal configuration (identical /alternating) and items/repetitions with the standard deviation and the number of observation.

IV = initial vowel, FV = final vowel; S = statement; YNQ = Yes–No question
Figure 5 shows that the significant difference of the mean f0 in IV concerns both lexical H and lexical L tones. Both tones are higher in Yes–No questions than in statements. The aggregated mean values for the initial H tones in the statement condition amounts to 184 Hz and to 193 Hz for the Yes–No question condition. The aggregated mean value for the initial L tone in the statement condition is at 149 Hz and at 159 Hz for the Yes–No question condition.
Box plot of mean f0 of the initial vowel (IV) in Hz broken down by sentence mode (YNQ = Yes–No question, S = statement) and tone (H/L) aggregated over speakers (n = 23), items/repetitions and tonal configurations.

Figure 6 shows the absolute mean intensity values for IV and FV separately comparing Yes–No questions and statements. Generally, IV has a higher mean intensity than FV in both Yes–No questions and statements. Mean intensity differs at FV. It is on average lower in statements than in Yes–No questions.
Box plot of mean intensity in dB broken down by sentence mode (YNQ = Yes–No question, S = statement) and position (IV = initial vowel, FV = final vowel) aggregated over speakers (n = 23), items/repetitions, tonal configurations and tones.

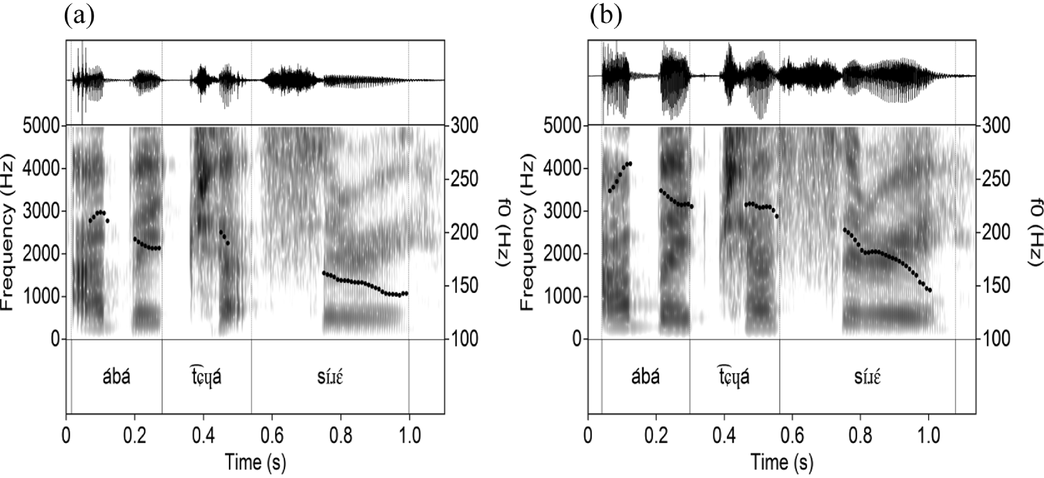
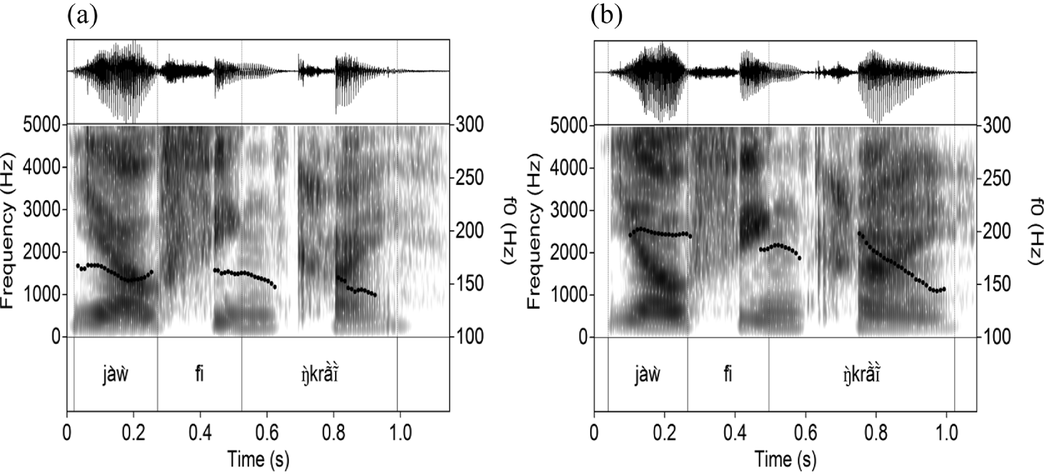
Figures 7–9 show representative examples of sentences containing H tones only (Figure 7), of sentences containing L tones only (Figure 8) and of sentences containing alternating LH tones (Figure 9) comparing statements in panel (a) to Yes–No questions in panel (b). Throughout, the higher pitch register in questions than in statements is visible. FV is longer and articulated with more energy in the question than in the statement. The f0 excursion of FV is overall larger in Yes–No questions. As an impressionistic observation, it should be noted that in Figures 7 and 8 declination is preserved in Yes–No questions. Figure 9 shows that downdrift is maintained in Yes–No questions as well.
Waveform, spectrogram and f0 contour of a sentence with H tones (Table 3 number 3); (a) statement; (b) Yes–No question; both panels show data from female speaker 4.

Waveform, spectrogram and f0 contour of a sentence with L tones (Table 3 number 5); (a) statement; (b) Yes–No question; both panels show data from female speaker 4.

Waveform, spectrogram and f0 contour of a sentence with alternating HL tones and final H tone (Table 3 number 11); (a) statement; (b) Yes–No question; both panels show data from male speaker 3.

2.3 Summary and discussion of the production experiment
The acoustic analysis revealed that Yes–No questions differ in several phonetic parameters from statements. Regarding the global parameter, the mean f0 of IV, which is assumed to be an indicator of the pitch register (Huang Reference Huang and Jensen1980, Reference Huang and Goyvaerts1985; Liberman & Pierrehumbert Reference Liberman, Pierrehumbert, Aronoff and Oehrl1984), is about 10 Hz on average higher in questions than in statements. This finding confirms the impressionistic observations of Berry & Aidoo (Reference Berry and Aidoo1975) and Dolphyne (Reference Dolphyne1988) that Yes–No questions in Akan are realized in a higher pitch register; quantitatively, the higher register is in accord with the findings in Genzel (Reference Genzel2013: 191). In addition, this finding adds evidence to the observation by Cahill (Reference Cahill, Kramer, Zsiga and Boyer2015) that register raising is a common characteristic of the question prosody of the languages of the Gur and Kwa family. Register raising applies to initial L and H tones to a comparable amount contrary to Dolphyne's (Reference Dolphyne1988) observation that the raising effect is less pronounced for initial L tones, see Figure 5. Since the initial tone can be considered as reference value for the scaling of the following tone(s) (e.g. Huang Reference Huang and Jensen1980, Reference Huang and Goyvaerts1985; Liberman & Pierrehumbert Reference Liberman, Pierrehumbert, Aronoff and Oehrl1984), the height of L and H tones in questions is also higher throughout the sentence, see Genzel (Reference Genzel2013: 183) for Akan. Therefore, we can conclude that Yes–No questions are realized in a raised pitch register as illustrated schematically in Figure 1 by the solid grey line. It has been further shown in Genzel (Reference Genzel2013), and impressionistically in this study, that the downdrift pattern in statements with alternating LH/HL tones is maintained in questions and that the size of the step down remains equal contrary to claims found in Hyman (Reference Hyman, Haspelmath, König, Oesterreicher and Reible2001) and Gussenhoven (Reference Gussenhoven2004). Thus, Akan behaves like Chumburung (Kwa) in this respect but differently from other Gur (Buli and Safaliba) and Kwa (Adele) languages which additionally exhibit register expansion (Cahill Reference Cahill, Kramer, Zsiga and Boyer2015).
Turning to the local phonetic properties of FV, we can confirm the impressionistic observation by Christaller (Reference Christaller1875) and Boadi (Reference Boadi1990) as well as the quantitative data in Genzel (Reference Genzel2013) that FV in Yes–No questions is lengthened. Quantitatively, the lengthening amounts to 20 ms on average, which means that the final vowel is by about 30% longer on average in Yes–No questions than in statements. Additionally, the results confirm the expectation about the relative intensity. It is on average by about 2.7 dB lower in Yes–No questions than in statements. Generally, IV has a higher mean intensity than FV in both Yes–No questions and statements. However, the crucial difference in mean intensity appears at FV (see Figure 6). This finding substantiates Boadi's (Reference Boadi1990) observation that the final vowel in Yes–No questions exhibits extra voicing, if Boadi's extra voicing is what we refer to as intensity.
The f0 endpoint did not differ as a function of sentence mode contrary to the expectations and findings presented in Genzel (Reference Genzel2013) that questions exhibit a lower final f0Footnote 1 than statements. The current data shows that the final f0 values are stable and independent of the observed register effect in Yes–No questions (see Liberman & Pierrehumbert Reference Liberman, Pierrehumbert, Aronoff and Oehrl1984 for similar findings in English). However, the data confirms the prediction that the f0 excursion of FV in Yes–No questions is larger than in statements if the final lexical tone is H. The difference amounts to 1 st on average. Contrary to the expectation that Yes–No questions that end in a L tone exhibit a smaller f0 excursion than statements due to the lack or reduction of final lowering (see Dolphyne Reference Dolphyne1988), our data shows also a larger f0 excursion of FV in Yes–No questions. The difference amounts to 0.8 st on average. This unexpected similarity in the excursion of the final fall for Yes–No questions for final H and final L tones appears to be due to the raised pitch register. f0 falls down to a final f0 endpoint, which is identical in statements and questions.
We conclude that Akan speakers employ a global parameter, the raised register and local parameters, vowel lengthening, higher intensity and a larger f0 excursion on the sentence-final vowel, in the production of Yes–No questions in comparison to statements. The production data therefore speak in favor of a classification of Akan as a hybrid question prosody language (see Rialland Reference Rialland, Riad and Gussenhoven2007, Reference Rialland2009). In order to test whether and how the global parameter and the local parameters confirmed by the production study contribute to the perception of Yes–No questions in Akan, we conducted a forced choice identification experiment and a gating experiment which are reported next.
3 Perception experiments
3.1 Forced-choice identification task
The forced-choice identification task has been successfully applied to investigate the impact of different phonetic parameters to the identification of the mode of a sentence (Ma et al. Reference Ma, Ciocca and Whitehill2011, Mixdorff et al. Reference Mixdorff, Mohasi, Machobane and Niesler2011). We used two types of stimuli, natural and cross-spliced. The cross-spliced stimuli contained either the raised question pitch register combined with the final local parameters of a statement or the statement pitch register combined with the final local parameters of a Yes–No question. We use cross-spliced stimuli to test whether the local or the global parameter(s) alone are sufficient for the identification of the mode of a sentence. The motivation to use the original Yes–No question and statement stimuli was twofold: firstly, it allows us to test whether the data from the production experiment involves the necessary phonetic information to identify the sentence mode of a sentence as intended; secondly, the comparison of the identification rates of natural and cross-spliced stimuli allows us to assess the impact of the global parameter and the local parameters for the identification.
3.1.1 Method
3.1.1.1 Stimuli
Two naturally spoken sets of stimuli produced in the production experiment by a female and a male speaker were chosen. The criterion for the selection was a maximal difference between question and statement realization in the parameters initial and final f0. The f0, duration and intensity values of all stimuli used in this experiment are listed in Table A1 (Appendix B). One set of items consisted of alternating LH tones with final H tone, see number 8 in Table 3, and the other one consisted of alternating HL tones with final H tone, see number 11 in Table 3.
The amplitude of the sounds was modified with Praat (Boersma & Weenink Reference Boersma and Weenink2015), using the standard value of 70 db, to equalize for differences between the realizations and between speakers. In a second step, the maximal amplitude of the first H tone and/or the final vowel were manipulated, if necessary, in such a way that the difference (relative intensity) between the two maximal intensity values was at around 10 db for the statements and at around 5 db for the questions; this measure is based on the mean relative intensity values presented in Genzel (Reference Genzel2013).
Beside the natural stimuli, two cross-spliced stimuli were created. The final word of the stimuli was cut off. In case of stimuli with alternating LH tones the final word was the monosyllabic word bá ‘child’; in case of stimuli with alternating HL tones the final word was the disyllabic word sìká ‘money’. Following that, the fragments were put together in such a way that the resulting output contained a question fragment with a final word that was extracted from a statement or a statement fragment with a final word that was extracted from a question. The amplitude was normalized as explained above, but the relative intensity was manipulated with reference to the statement value of 10 db. All stimuli were checked for their naturalness by a native speaker.
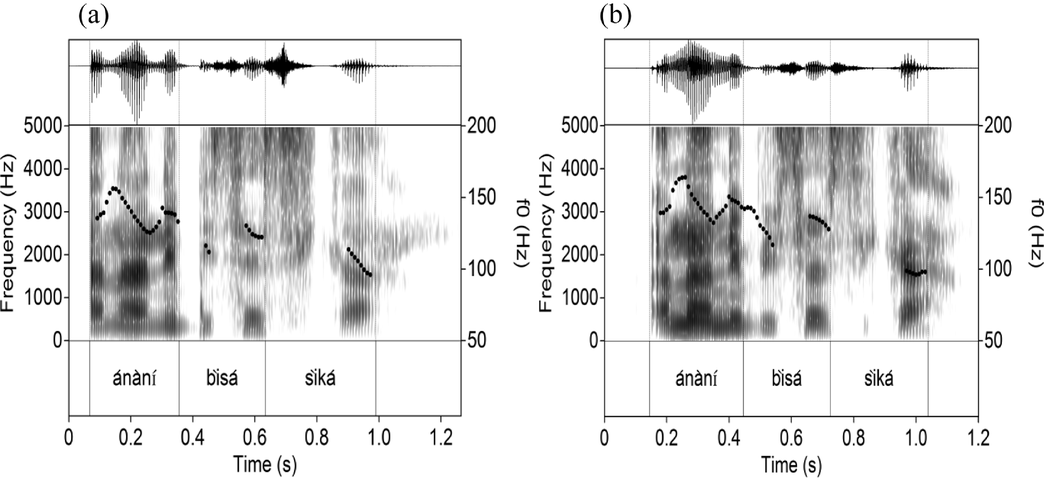
The experiment thus contained 16 stimuli (2 speakers × 2 sentence mode × 2 tonal configurations/items × 2 stimulus types). Examples of the cross-spliced stimuli of the male speaker are presented in Figure 10. A statement–question (SQ) stimulus is displayed in Figure 10 panel (a). It is characterized by a normal register (global parameter) and the sentence-final local questions parameters such as a sharply falling terminal f0 and a longer final duration. A question–statement (QS) stimulus is displayed in Figure 10 panel (b). It is characterized by a raised global register and the sentence-final local statement parameters such as a slightly falling terminal f0 and normal final length. The cross-spliced stimuli can be compared to the original stimuli in Figure 9.
Waveform, spectrogram and f0 contour of a sentence with alternating HL tones and final H tone (Table 3 number 11); (a) cross-spliced stimulus StatementQuestion; (b) cross-spliced stimulus QuestionStatement; both panels show data from male speaker 3.

3.1.1.2 Participants
Nineteen participants took part in the experiment out of which 17 also took part in the production experiment. The other two participants were a 28-year-old male student, and a 50-year-old female speaker. The speakers from which the stimuli for the perception tests were chosen did not participate in the perception tests. In an interview about their social and language background, all participants declared that they were native speakers of Akan and had no speech or hearing impairment. The participants were naive as to the purpose of the experiment. Each participant was paid a small fee.
3.1.1.3 Procedure
Both perception experiments were carried out in a quiet room at the university campus of Ghana University, Legon (Accra), and at the Kwame Nkrumah University of Science and Technology, Kumasi, in 2012. The order of the two perception experiments was counterbalanced (with half of the participants doing the identification experiment first and the other half doing the gating experiment first, see Section 3.2). In between the two perception experiments participants conducted other unrelated production studies.
The identification experiment was carried out using Praat's ExperimentMFC function (Boersma & Weenink Reference Boersma and Weenink2015). As instructions, participants were asked to indicate whether the sentence they heard was a question or a statement by clicking either on the button showing a question mark or on the button showing a full stop. Stimuli were played through Sennheiser HD 25 headphones connected to an Edirol UA-25 sound card which was plugged-in to a laptop (Levono R61). The rectangles containing the response categories were displayed on the lower half of the screen. The button containing the full stop was located at the left hand side and the button containing the question mark was located at the right hand side. Their order was not counterbalanced which may bias the results. Above the response category rectangles was a replay button. The participants were allowed to replay the sounds. If they decided for one category, the selected response category rectangle changed its colour from yellow to red and an OK button appeared on the lower left side of the screen. Clicking on the OK button resulted in continuation of the experiment. The stimuli were repeated three times each. After clicking the OK button, each stimulus had an initial duration of silence of 4.0 seconds such that participants could read the sentence displayed on screen. The experiment lasted approximately 15 minutes.
3.1.1.4 Design, predictions and statistical analysis
The experiment had a 2 × 2 within-subject design with sentence mode (S/QS vs. Q/SQ) and stimulus type (natural vs. cross-spliced) as fixed factors. According to the provisory scale of perceptual relevance introduced in (2) above, we expect that the local parameters of the final vowel are perceptually more relevant than the global parameter. Hence, natural statement and cross-spliced QS stimuli should be identified as statements, whereas the natural question and cross-spliced SQ should not be identified as statements, but as questions (main effect of sentence mode). Cross-spliced stimuli have been shown to contain mismatching phonetic information which may hinder phonological processing (Steinberg, Truckenbrodt & Jacobsen Reference Steinberg, Truckenbrodt and Jacobsen2012). Furthermore, it has been suggested that statement intonation has to be regarded as the default (Yuan Reference Yuan2004, Peters & Pfitzinger Reference Peters and Pfitzinger2008). Hence, we expect that listeners identify cross-spliced stimuli more often as statements because they encounter ambiguous information and chose the default option (main effect of stimulus type). The statement bias should mainly play a role for the response rates of the SQ stimuli. As a consequence, we expect an interaction of sentence mode and stimulus type.
The responses obtained from the forced-choice identification task served as dependent variable. It was evaluated against the fixed factors sentence mode with the two levels, statement (S/QS), which serves as reference level, and question (Q/SQ) and stimulus type with two levels, natural, which serves as reference level, and cross-spliced (with interaction term) in R (R Development Core Team 2015) using generalized linear mixed models (glmer) from the lme4 package (Bates et al. Reference Bates, Maechler, Bolker, Steven and Walker2015). We incorporated random intercepts for participant and item (tone) and by-subject and by-item random slopes for sentence mode*stimulus type, assuming that the participants might differ with regard to how they react to the experimental manipulation and that the reaction might also differ between the items.
3.1.2 Results
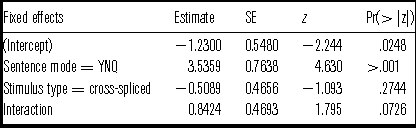
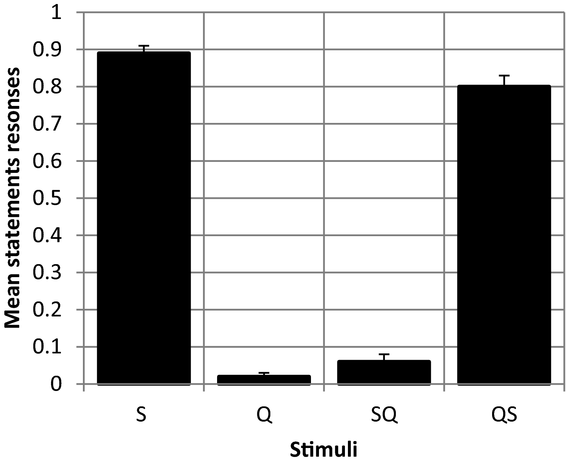
Table 6 presents the results of the statistical analysis. There was a significant effect of sentence mode, S/QS stimuli were more often identified as statements (x = 0.84, SD = 37, n = 456) than Q/SQ stimuli (x = 0.04, SD = 0.19, n = 456). No effect of stimulus type occurred. Natural stimuli (x = 0.45, SD = 0.5, n = 456) were rated as often as statements as the cross-spliced stimuli (x = 0.43, SD = 0.5, n = 456). The interaction of sentence mode and stimulus type was not significant.
Report of the linear mixed effects model, specified in Section 3.1.1.4, with response as dependent variable.

YNQ = Yes–No question
Figure 11 displays the mean statement responses split by stimuli. It shows that the majority of participants identified S and QS as statements, whereas Q and SQ were identified as questions.
Mean statement responses split by stimuli, aggregated over participants (n = 19), tones (n = 2), speakers (n = 2) and repetitions (n = 3); error bars indicate the standard error. S = original statements, Q = original question, SQ = statement plus final question fragment, QS = question plus final statement fragment.

3.1.3 Discussion
As expected, the data revealed a main effect of sentence mode. S/QS stimuli were identified as statements and Q/SQ stimuli as questions. Contrary to the expectations, there was no main effect of stimulus type on the response. Natural and cross-spliced stimuli did not differ in their response rate. The expected bias towards statements as the unmarked sentence mode (Yuan Reference Yuan2004, Peters & Pfitzinger Reference Peters and Pfitzinger2008) was not detected. It should be noted that the lack of counterbalancing of the response buttons (see above), i.e. the statement button appeared always left and the question button appeared always right on the screen, appears not to lead to a bias of either one of the response categories. Moreover, sentence mode and stimulus type did not interact. The results of the forced-choice experiment suggest that the natural stimuli contain the necessary information for an appropriate identification of the mode of a sentence. The comparison of the natural and cross-spliced stimuli has shown that listeners reliably categorize the mode of a sentence according to the information provided by the local prosodic cues. This finding is comparable to Ma et al. (Reference Ma, Ciocca and Whitehill2011) on Cantonese, Mixdorff et al. (Reference Mixdorff, Mohasi, Machobane and Niesler2011) on Sesotho and Jones et al. (Reference Jones, Louw and Roux1998b) on Xhosa. The results suggest that the presence of the global question cue in the cross-spliced QS stimuli alone is not sufficient to identify an utterance as question.
However, the categorization in the forced-choice identification experiment took place after the sentences were heard. From this method, we do not know whether local prosodic cues may have overridden initial parsing decisions, i.e. it is possible that listeners initially perceived QS stimuli, which contain the global raised register question parameter, as questions but changed their decision when they encountered the information on the final vowel, see Xhosa for such an effect (Jones et al. Reference Jones, Louw and Roux1998b). In order to further disentangle the impact of the global parameter and the local parameters on the identification of the mode of a sentence in Akan, we conducted a gating experiment which is outlined in the next section.
3.2 Gating experiment
3.2.1 Method
3.2.1.1 Stimuli
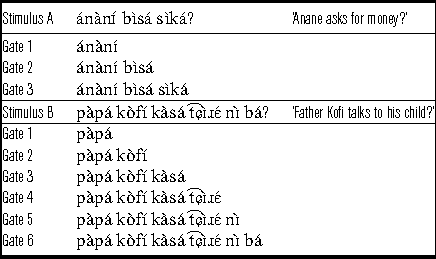
Since we were interested in potential early question identification effects due to a raised pitch register, we only tested natural question stimuli. We used the same two natural question stimuli from the same two speakers used in the forced-choice identification experiment. The two question stimuli differed in length, three words and six words. The target sentences were cut into smaller pieces, the individual gates, which are shown in Table 7. Altogether, 36 stimuli were used (2 speakers × 2 tonal configurations/items × 3/6 gates).
Stimuli and gates of the gating experiment.

3.2.1.2 Participants
The stimuli were presented to the 18 participants involved in the first perception experiment.
3.2.1.3 Procedure
As the forced-choice experiment, the gating experiment was carried out using Praat's ExperimentMFC function (Boersma & Weenink Reference Boersma and Weenink2015) using the same equipment. The instructions told the participants that they would hear parts of a sentence. They were asked to indicate whether the part they heard was belonging to a question or a statement by clicking either on the button showing a question mark or on the button showing a full stop, as in the previous experiment. Subsequent to the choice of response category, they had to rate their level of confidence on a five-point scale ranging from 1 = unsure to 5 = sure. The design of the screen was comparable to that used in the previous perception experiment. Additionally, five red-framed concatenated rectangles containing the confidence categories appeared below the response buttons. No replay button was present. The stimulus initial duration of silence after the OK button amounted to 0.5 seconds. The experiment lasted approximately ten minutes.
3.2.1.4 Design, predictions and statistical analysis
The experiment contains the independent variable Gate, which originally had 3 and 6 levels (short stimuli A and long stimuli B). We reduced the levels of this factor to 2, i.e. the initial and final gate, since the initial gate (gate 1) is taken to be an indicator of the pitch register (see the production experiment above) and the final gate (gate 3 in stimuli A/gate 6 in stimuli B) contains the relevant local question parameters. As before, according to the provisory scale of perceptual relevance introduced in (2) above, we expect that the final local parameters to be perceptually more relevant for the identification of the mode of a sentence than the global parameter. Hence, we predict that listeners categorize the natural question stimuli as statements at the initial gate and the natural question stimuli as question at the final gate (main effect of Gate). Furthermore, we expect listeners to be rather unconfident (unsure) at the initial gate and rather confident (sure) at the final gate since the final local parameters are expected to be decisive (main effect of Gate).
As before, the statistical analysis was performed in R (R Development Core Team 2015) using the lme4 package (Bates et al. Reference Bates, Maechler, Bolker, Steven and Walker2015). A glmer model was calculated for the dependent variable response. Gate 1 served as reference level. We incorporated random intercepts for participant and item (stimuli A and B) and by-subject and by-item random slopes for gate, assuming that the participants might differ with regard to how they react to the experimental manipulation and that the reaction might also differ between the items. The influence of the dependent variable confidence was analysed with a cumulative link mixed model (CLMM) from the ‘ordinal’ package (Christensen Reference Christensen2015). We incorporated participant as random intercept and by-subject random slopes for gate. A p < .05 is taken to indicate significance.
3.2.2 Results
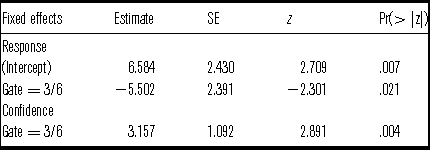
The statistical results comparing the responses and confidence of the responses at the initial gate and final gate are shown in Table 8. For the categorization of the stimuli as statement or question, we find a main effect for gate with significantly less statement responses at the final gate (x = 0.17, SD = 0.38, n = 72) than at the initial gate (x = 0.71, SD = 46, n = 72). Concerning the confidence of the responses, we find a higher probability of observations in the high categories at the final gate (x = 4.89, SD = 0.43, n = 72) than at the initial gate (x = 3.47, SD = 1.64, n = 72).
Report of the linear mixed effects model and the cumulative link mixed model, specified in Section 3.2.1.4, with response and confidence as dependent variables.

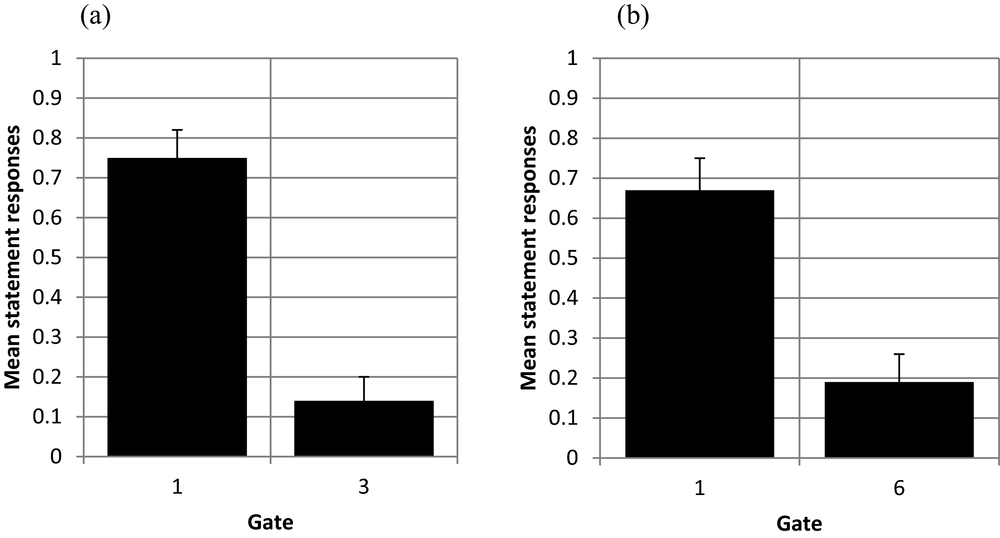
Figure 12 displays the mean statement responses at the initial and final gate split by stimulus. It shows that the majority of participants identified the fragments at the initial gate as statements; the identification rates differed somewhat between the stimuli. However, for both stimuli the amount of statement responses decreases noticeably at the final gate.
Mean statement responses split by gate (initial and final), aggregated over participants (n = 18) and speakers (n = 2); error bars indicate the standard errors; (a) the short sentence with alternating HL tones; (b) long sentence with alternating LH tones.

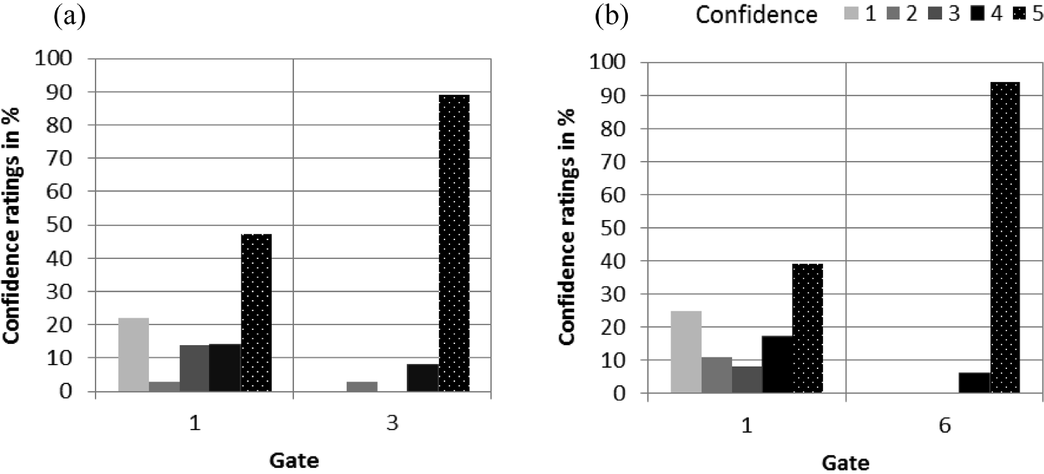
Figure 13 illustrates the distribution of confidence ratings in per cent at the initial and final gate. The confidence ratings (from 1 = unsure to 5 = sure) for the short stimuli A are shown in panel (a) and the confidence ratings for the long stimuli B are shown in panel (b). Overall, participants tended to rate their decision as sure (black–with–white–dots bar), i.e. the confidence category 5 was favored over all other categories at both gates. At the final gate, participants were almost always sure about their choice.
Confidence responses in per cent (%) split by gate (initial and final) and confidence category (1 = unsure; 5 = sure), aggregated over participants (n = 18) and speaker (n = 2); (a) short sentence with alternating HL tones; (b) long sentence with alternating LH tones.

3.2.3 Discussion
As expected, the gating experiment revealed that the gated question stimuli were systematically misidentified as statements at the initial gate. Participants changed their decision towards question interpretation at the final gate. The expected effect of Gate on the confidence rating was borne out. Hence, the correct identification of the stimuli as questions at the final gate was accompanied by high confidence. The results of the gating experiment together with the results of the forced-choice experiment indicate that in Akan, the sentence-final local phonetic cues are decisive for the identification of sentence mode. The outcome that local phonetic cues (final gate) are primary for the correct identification of the mode of a sentence is in line with the findings for Cantonese (Ma et al. Reference Ma, Ciocca and Whitehill2011), Sesotho (Mixdorff et al. Reference Mixdorff, Mohasi, Machobane and Niesler2011) and Xhosa (Jones et al. Reference Jones, Louw and Roux1998b). However, contrary to the aforementioned studies, Akan listeners did not start with a question interpretation if they were exposed to a raised pitch register. The raised pitch register was not used as secondary cue for question identification. It did not trigger unsure question decisions, but rather sure statement identifications which could be due to the unmarked (statement) sentence mode bias at the initial gate as reported by Yuan (Reference Yuan2004) and Peters & Pfitzinger (Reference Peters and Pfitzinger2008) which was eventually changed at the last gate. We thus conclude the local prosodic parameters function as cues for the identification of the mode of the sentence in Akan.
4 General discussion
4.1 Perceptual relevance of phonetic question parameters
The study was concerned with the production and perception of prosodic marking of sentence mode in Akan, a tone language of the Kwa family. On the basis of the results, we argue in this section that the local phonetic question cues are language-specific and perceptually more relevant than the global question cue.
The acoustic analysis of the production data revealed a number of phonetic parameters that differ between Yes–No questions and statements. Besides the global pitch register raising in Yes–No questions, we detected local phonetic parameters like a larger final f0 fall and a longer and more intense final vowel. Other quantitative studies on the prosodic marking of Yes–No questions in tone languages also revealed both global, pitch register raising or register expansion (see Myers Reference Myers, Bel and Marlien2004 also on non-tonal languages, Genzel Reference Genzel2013: 44; Cahill Reference Cahill, Kramer, Zsiga and Boyer2015), and local parameters (Jones et al. Reference Jones, Louw and Roux1998a, Ma et al. Reference Ma, Ciocca and Whitehill2011, Mixdorff et al. Reference Mixdorff, Mohasi, Machobane and Niesler2011). Perceptually, the forced-choice identification experiment and the gating experiment have shown that the local cues, which are realized sentence-finally in Akan, are decisive for the correct identification of the sentence mode, in line with findings on other tone languages (Jones et al. Reference Jones, Louw and Roux1998b, Ma et al. Reference Ma, Ciocca and Whitehill2011, Mixdorff et al. Reference Mixdorff, Mohasi, Machobane and Niesler2011). Unlike in Xhosa (Jones et al. Reference Jones, Louw and Roux1998b), where a raised register triggered question identification from the beginning of a sentence, or unlike in Cantonese (Mixdorff et al. Reference Mixdorff, Mohasi, Machobane and Niesler2011) where the pitch register information played a secondary role, it did not play a decisive role in sentence mode identification in Akan.
Based on the aforementioned studies and our results, we can conclude that the local cues are functional, hence language-specific and belong to the phonology of the particular language, see Section 4.2. Whereas the global pitch register effect is less functionally relevant and may thus be regarded as universal. Our results thus provide evidence for the scale of perceptual relevance of prosodic cues of question marking introduced in (2) above.
However, we cannot conclude that raised pitch register may not have relevance for the perception of sentence mode in Akan at all. An indication of the fact that the raised register may play a role for the perception of the mode of a sentence is that the responses to cross-spliced SQ stimuli showed a tendency to differ from the responses to natural Q stimuli in the forced-choice experiment, and that ratings at the initial gate were less confident than at the final gate in the gating experiment. This may be taken as an indication that listeners chose the statement category as default option in absence of conclusive phonetic information, supporting observations of a statement bias by Yuan (Reference Yuan2004) and Peters & Pfitzinger (Reference Peters and Pfitzinger2008). However, no direct evidence of a statement bias could be observed, i.e. natural stimuli were rated correctly as statements or as questions, contrary to observations made by Yuan (Reference Yuan2004) for Mandarin Chinese.
Since it is generally agreed that register is a relative notion, it is possible that in the experimental settings presented here, listeners may have not had enough auditory input of each speakers’ voice to build up a mental representation of the speakers’ pitch range to access the register information. More research is needed to further sustain this claim.
4.2 Phonological representation
In this section, we argue that Yes–No questions in Akan are phonologically marked by a low boundary tone (L%), and that longer duration and higher intensity of the sentence-final TBU are a consequence of L%.
The magnitude and the direction of changes in f0 have been found to be perceptually highly relevant for the identification of the sentence mode (e.g. Ma et al. Reference Ma, Ciocca and Whitehill2011). We have observed a larger final falling f0 in Yes–No questions than in statements in the production data and more confident question responses if the information at the final vowel was available in the perception experiments. Furthermore, on the production side, the final vowel was louder (had greater intensity) in Yes–No questions that in statements, which may indicate the existence of an addition of a tonal target at the right edge of the tonal string (see Vaissière Reference Vaissière, Cutler and Ladd1983: 65). The difference in intensity was, however, normalized in the cross-spliced stimuli; nonetheless the majority of SQ stimuli were identified as questions. Hence, we want to capture the importance of the larger f0 fall for the perception of the sentence mode in Akan by suggesting that it employs a L boundary tone at the right edge of the IP in Yes–No questions. This is illustrated in (9) with the Yes–No question ‘Anane asks?’.
(9)

This question is phrased in an IP that contains two PhPs according to the phrasing principles introduced in Section 1.4. The IP is marked by squared brackets and the PhP by round brackets. It has been argued in Genzel (Reference Genzel2013), that the right edge of the IP in declaratives is tonally not specified as in (9b).
A lengthening effect may be either caused by the addition of a TBU, by inherent turn-yielding features, or by the presence of a boundary tone. It is generally agreed that a lengthening caused by the addition of a TBU should bring about a greater lengthening effect than the sole presence of a boundary tone (e.g. Rialland Reference Rialland, Riad and Gussenhoven2007). If lengthening in Akan Yes–No questions would be due to an additional sentence-final TBU, we would expect a lengthening of about 80% to 100%. Forty-three out of 279 questions exhibit such a lengthening of 80% or more. At the same time, 79 questions did not show any lengthening, or only a slight lengthening ranging from 0% to 48%. Such a variation would not be expected if Akan would add a TBU at the end of Yes–No questions. A lengthening may further be caused solely by the sentence mode and not by the presence of a boundary tone as noted by Smith (Reference Smith2002) for French. Lengthening might be more required in questions than in statements to mark the end of a conversational turn; see also Callier (Reference Callier2011) for Mandarin Chinese. However, the statements and the questions were uttered under controlled experimental settings; each sentence was presented on a separate slide and no interlocutor was present. Given this rather ‘non-conversational’ setting, we argue that the observed lengthening effect is not due to turn taking. As a conclusion it can be said that neither an insertion of a TBU nor a conversational turn causes the lengthening but that the L% is responsible for it. We assume that the lengthening is not phonologized but caused by tonal crowding on the final TBU (see also Arvaniti, Ladd & Mennen Reference Arvaniti, Robert Ladd and Mennen2006a, b and Arvaniti & Ladd Reference Arvaniti and Ladd2009 on alignment and scaling effects due to tonal crowding).
The non-exploitation of the raised register as a cue to question interpretation in the perception experiments presented here raises the question of its origin, its representation and its function. Early effects of boundary tones in terms of higher register and/or reduction of downtrends and/or absence of final lowering have been widely attested for languages that have been analyzed as having H%, i.e. global effects are assimilatory (Myers Reference Myers, Bel and Marlien2004). To capture global effects of boundary tones, Pierrehumbert & Beckman (Reference Pierrehumbert and Beckman1988) suggested an association of the boundary tone with the IP node. Early effects of H% might be viewed as a by-product of its phonetic implementation (van Heuven & Haan Reference van Heuven, Haan, de Hoop and van der Wouden2000). However, as we have shown here Akan does not employ H% but L% as question marker in combination with a raised pitch register. This suggests that dissimilatory effects may also be possible. An analytical possibility would be to propose that the raised pitch register in Yes–No questions is caused by a H boundary tone at the left edge of the IP in Akan (%H) (see Genzel Reference Genzel2013: 196 for a discussion). Based on the perception data of this study, we however provide evidence that the raised pitch register is not functionally used as a cue for question identification. A phonological category like %H should have such a perceptual effect. We therefore decided not to analyze the high register in Yes–No questions in terms of an additional post-lexical tonal category. More research is needed to determine why speakers employ early f0 parameters, how they are perceived and which interpretations they evoke, but see Sicoli et al. (Reference Sicoli, Stivers, Enfield and Levinson2014) for the claim, based on various languages, that marked initial f0 in questions signals marked communicative function. For Akan, it seems that the higher register and the L% conspire to make the final fall salient.
4.3 Typological classification
Recall that Rialland (Reference Rialland, Riad and Gussenhoven2007, Reference Rialland2009), whose typology is based on production data, classifies Akan as ‘lax’ prosody language, which uses non-H-pitched markers only. In Table 9 which revisits Table 2, the experimentally approved phonetic parameters are arranged according to Rialland's (Reference Rialland, Riad and Gussenhoven2007) typology of H-pitched/tense and non-H-pitched/lax question markers. Overall, the production experiment has shown that Akan uses a global and a local H-pitched/tense parameter in combination with local non-H-pitched/lax parameters in Yes–No questions. Hence, from the production side, Akan would better be reclassified as a ‘hybrid’ system along the lines of Rialland's typology.
H-pitched and non-H-pitched question intonation indicators of Akan based on the current production experiments.

This suggestion is in line with Cahill's observation that ‘hybrid’ systems are quite common in the Kwa and Gur language family but seem to have gone unnoticed so far (Cahill Reference Cahill, Kramer, Zsiga and Boyer2015). However, we would like to argue that the typological classification should rather rest on the functional relevant, phonological, aspects of the signal. The results of the perception experiments suggest that the local cues (final lengthening and final falling f0), i.e. the non-H-pitched question cues, are sufficient to trigger a question interpretation. Thus, a reclassification of Akan would not be required, and Rialland's (Reference Rialland, Riad and Gussenhoven2007) original classification as Akan being a ‘lax question prosody’ language could be maintained. However, our results further suggest that the term ‘lax’ question prosody language related to the phonetic characteristics of the question prosody of Akan should be discussed. Rialland (Reference Rialland2009) cites Ní Chasaide & Gobl (Reference Ní Chasaide, Gobl, Hardcastle and Laver1997: 451) who claim that lax voice is accompanied by lesser tension in the vocal tract which leads to breathy phonation and a softer and lower pitched sounding than modal voice. However, Akan speakers may optionally use breathy termination in Yes–No questions and statements (Genzel Reference Genzel2013). Furthermore, we observe an intensity increase in the final sonorant in Yes–No questions in comparison to the statements. We suggest that the increase in intensity is brought about by the additional tonal target (L%) in Yes–No questions. The articulation of the final vowel of Yes–No questions in Akan does not convey a soft sounding but rather a tense powerful sound, see Genzel (Reference Genzel2018) for a substantiation of this claim in terms of vowel quality measures. We hence suggest that the partition into H-pitched/‘tense’ andnon-H-pitched/‘lax’ (Rialland Reference Rialland, Riad and Gussenhoven2007, Reference Rialland2009) should be refined since the addition of a boundary tone, be it L (non-H-pitched) or H (H-pitched), leads to articulatory features that can be described as tensed whereas the absence of a boundary tone leads to articulatory features that can be described as lax. A tentative extension of Rialland's classificatory system could thus include a feature referring to the presence or absence of a boundary tone.
5 Conclusion
The paper has shown that the tone language Akan uses intonation to distinguish statements from string-identical Yes–No questions. On the production side, Yes–No questions have been shown to differ in a global parameter and in local, sentence-final, parameters from statements. Globally, the lexical tones of the Yes–No question have been found to be realized in a raised pitch register compared to the lexical tones of the statement. Locally, the sentence-final element is longer, has a higher intensity and the f0 fall aligned to it is larger. The observed phonetic effects in Yes–No questions are similar for both initial and final H and L tones. On the perception side, the local cues have been shown to be functional for the identification of the mode of a sentence. The global cue could not be assessed for an early identification. We acknowledged the relevance of sentence-final prosody by proposing a low boundary tone (L%) as question marker of Akan and suggested that the raised pitch register and L% conspire to make the final fall salient. We conclude that Akan can be described as ‘accommodative’ type in the sense of Hyman & Monaka (Reference Hyman and Monaka2008). The TBU bearing the final lexical tone makes room for the post-lexical L% to allow for a ‘peaceful’ co-existence. Our proposal for question intonation typology was that it would be more appropriate to base the typological classification of a language on the perceptually relevant phonetic cues and not solely on the phonetic parameters used in the production.
Acknowledgements
The research was funded by research grants from the DFG, SFB 632 Information structure, project D5, and KU 2323/3-1. We would like to thank Prof. Dr. Kofi Saah, Dr. Nana Aba Appiah Amfo, Dr. Reginald Duah, Dr. Kofi Dorvlo, Dr. Kofi Manyah, Prof. Dr. Charles Marfo, Kwasi Adomako, Monica Amoah Appenteng, and Dr. Afua Blay. Our gratitude goes to the Editor Amalia Arvaniti and two anonymous reviewers for their valuable comments on previous versions of the paper.
Appendix A. Linguistic glossing abbreviations
The glossing conventions follow the Leipzig Glossing Rules (Bickel, Comrie & Haspelmath Reference Bickel, Comrie and Haspelmath2008). det = determiner, dim = diminutive, hab = habitual aspect, pro = pronoun.
Appendix B. Values of the stimuli used in the forced-choice identification experiment
It should be noted that the location of the maximum intensity of the utterance usually coincides with the first H tone. Furthermore, the difference of the maximal f0 of the first tone, which is L in the sentences with alternating LH tones, was more pronounced for the first H tone in the utterance (female Q = 317.8 Hz, S = 285 Hz; male Q = 162.9 Hz, S = 155.6 Hz).
Initial f0 in Hz, duration of the final vowel in ms, maximal intensity of the utterance and maximal intensity of the final vowel in db, split by tonal configuration and sex for the natural and cross-spliced stimuli used in the forced-choice identification experiment.

IV = initial vowel, FV = final vowel; S = statement, YNQ = Yes–No question, SQ = statement plus final question fragment, QS = question plus final statement fragment