Introduction
Fedorite is a rare mineral occurring in alkaline rocks of Turiy and Murun complexes, Russia (Kukharenko et al., Reference Kukharenko, Orlova, Bulakh, Bagdasarov, Rimskaya-Korsakova, Nefedov, Il'inskii, Sergeev and Abakumova1965; Konev et al., Reference Konev, Vorobjov and Bulach1993, Reference Konev, Vorob'ev and Lazebnik1996) with formula (K,Na)2.5(Ca,Na)7Si16O38(OH,F)2⋅3.5H2O according to the official International Mineralogical Association Commission on New Minerals, Nomenclature and Classification (IMA–CNMNC) List of Mineral Names (Pasero, Reference Pasero2023).
The empirical formula of fedorite was first given by Kukharenko et al. (Reference Kukharenko, Orlova, Bulakh, Bagdasarov, Rimskaya-Korsakova, Nefedov, Il'inskii, Sergeev and Abakumova1965) as K0.27(Ca1.02Na0.93)(Al0.20Si3.80)O9.05(OH)0.95⋅1.5H2O. Other formulae were subsequently given by several authors (Sokolova et al., Reference Sokolova, Kashaev, Drits and Ilyukhin1983; Joswig et al., Reference Joswig, Drits and Sokolova1988; Blackburn and Dennen, Reference Blackburn and Dennen1997; Mitchell and Burns, Reference Mitchell and Burns2001; Kaneva et al., Reference Kaneva, Shendrik, Radomskaya and Suvorova2020a). In particular, Mitchell and Burns (Reference Mitchell and Burns2001) revised the fedorite chemical formula as Na3(Ca4Na3)[Si16O38]F2⋅3.5H2O (as cited in Hawthorne et al., Reference Hawthorne, Uvarova and Sokolova2019). More recently, Kaneva et al. (Reference Kaneva, Shendrik, Radomskaya and Suvorova2020a) reported more complex formulae on fedorite from three Russian localities, with a range of values for H2O as well as different content and possibly different structural roles for the OH groups. It is thus apparent that there are still open questions about the actual definition of fedorite.
From a structural viewpoint, this mineral has been included in the group of silicates with stacked modules consisting of sheets of tetrahedra and octahedra (Ferraris, Reference Ferraris and Merlino1997; Ferraris and Gula, Reference Ferraris, Gula, Ferraris and Merlino2005; Rastsvetaeva and Aksenov, Reference Rastsvetaeva and Aksenov2011) and is considered as belonging to the reyerite–gyrolite group (Bonaccorsi and Merlino, Reference Bonaccorsi, Merlino, Ferraris and Merlino2005). Hawthorne et al. (Reference Hawthorne, Uvarova and Sokolova2019) described fedorite as a double-layer sheet silicate based on an upper 3-connected net (63) with an arrangement of upward-pointing tetrahedra (u) and downward-pointing tetrahedra (d) showing (d6)1(d2ud2u)3 configuration and 1:2.38 T:O ratio. The fedorite interstitial complex consists of one MO62–, two MO52–F– and one MO42–F2– octahedra with M = Ca2+ and Na+ and additional disordered sites occupied by Na+ and K+ cations coordinated by O2– and partly disordered H2O.
The crystal structure of fedorite was solved by Sokolova et al. (Reference Sokolova, Kashaev, Drits and Ilyukhin1983) and then refined by a number of authors (Joswig et al., Reference Joswig, Drits and Sokolova1988; Mitchell and Burns, Reference Mitchell and Burns2001; Kaneva et al., Reference Kaneva, Shendrik, Radomskaya and Suvorova2020a; this work). It consists of 4 octahedral independent sites (M sites), 8 tetrahedral sites (T sites), 19 oxygen sites, one F site and a variable number of large disordered sites (labelled A or K sites) as well as sites occupied by oxygens of H2O (labelled W or Ow sites). Previous structure refinements report difficulties in modelling the position and disorder of interlayer cations and H2O. For example, Joswig et al. (Reference Joswig, Drits and Sokolova1988) found elongated displacement ellipsoids for one of the two interlayer cations occupying the A1 and A2 sites. These sites were split into A1 and A1a and also into A2 and A2a in the structure refinement of the Turiy and Murun fedorite, respectively (Mitchell and Burns, Reference Mitchell and Burns2001). Other problems were reported by the latter authors (correlations between site occupancy factors and displacement parameters for one of the three H2O sites, labelled W3; short distance between W3 and A1a sites; and short distance between A1a and A2 sites) and different explanations were given (W3 locally vacant when A1a is occupied; A2 locally vacant when A1a is occupied; A2 containing H2O if locally occupied). Kaneva et al. (Reference Kaneva, Shendrik, Radomskaya and Suvorova2020a) associated elongated displacement parameters for interlayer cations and oxygen of the H2O with mixed cationic–anionic sites occupancy in fedorite from three districts of the Murun complex. In particular, four K-occupied interlayer sites (K1 to K4) were identified: one (K2) or more of them (K2 to K4) were split into two or three new positions. From one (O20w) to four (O20w to O24w) H2O were also identified by those authors.
The hydration degree of the alkaline cations in the interlayer of sheet silicate phases may strongly affect their chemical and physical properties, especially in relation to temperature changes. Specifically, the dehydration process of fedorite has not been previously explored.
In the present study, data from in situ high-temperature single-crystal X-ray diffraction (HT-SCXRD) as well as ex situ high-temperature Fourier-transform infrared spectroscopy (HT-FTIR) experiments of fedorite are provided. Results from electron probe microanalysis (EPMA), differential thermal analysis (DTA), thermogravimetry (TG) and derivative thermogravimetry (DTG) are also reported. This work follows other papers aimed at gaining insights on the crystal chemistry (Kaneva et al., Reference Kaneva, Lacalamita, Mesto, Schingaro, Scordari and Vladykin2014, Reference Kaneva, Vladykin, Mesto, Lacalamita, Scordari and Schingaro2018, Reference Kaneva, Shendrik, Mesto, Bogdanov and Vladykin2020b, Reference Kaneva, Shendrik, Vladykin and Radomskaya2021, Reference Kaneva, Radomskaya and Shendrik2022, Reference Kaneva, Bogdanov, Radomskaya, Belozerova and Shendrik2023a, Reference Kaneva, Radomskaya, Belozerova and Shendrik2023b; Mesto et al., Reference Mesto, Kaneva, Schingaro, Vladykin, Lacalamita and Scordari2014; Lacalamita et al., Reference Lacalamita, Mesto, Kaneva, Scordari, Pedrazzi, Vladykin and Schingaro2017; Schingaro et al., Reference Schingaro, Mesto, Lacalamita, Scordari, Kaneva and Vladykin2017; Lacalamita, Reference Lacalamita2018; Bogdanov et al., Reference Bogdanov, Kaneva and Shendrik2021; Kaneva and Shendrik, Reference Kaneva and Shendrik2022) as well as on the structural modifications of some rare minerals from Russian alkaline rocks under non-ambient conditions (Schingaro et al., Reference Schingaro, Lacalamita, Mesto and Della Ventura2018; Comboni et al., Reference Comboni, Lotti, Gatta, Lacalamita, Mesto, Merlini and Hanfland2019; Lacalamita et al., Reference Lacalamita, Cametti, Mesto and Schingaro2019).
Geological background and sample description
The geological context of Malyy Murun massif (Murun alkaline complex located in the NW Aldan Shield, Siberia, Russia, dated 137–128 Ma) is reported elsewhere (Vladykin, Reference Vladykin2009; Vladykin et al., Reference Vladykin, Borokovikov, Dokuchits and Thomas2018; Borovikov et al., Reference Borovikov, Vladykin, Tretiakova and Dokuchits2018) and is only briefly summarised here. The Murun massif geological history is characterised by four igneous phases or stages (early intrusive, main intrusive, volcanic and late intrusive) as well as by hydrothermal activity represented by quartz veins with rutile–brookite–anatase mineralisation (Ivanov et al., Reference Ivanov, Vladykin, Demonterova, Gorovoy and Dokuchits2018).
According to Kaneva et al. (Reference Kaneva, Shendrik, Radomskaya and Suvorova2020a), fedorite has been found in different districts of the Murun massif: the Gavrilovskaya zone, the Irkutskiy and Yakutskiy districts. Fedorite from the Gavrilovskaya zone was found in brookite–anatase–quartz–feldspar rocks whereas fedorite from Irkutskiy and Yakutskiy districts is associated with charoite mineralisation. Mineral associations are as follow: aegirine–apatite–rutile–fedorite–pyrite–galena–quartz (Gavrilovskaya zone); apatite–fedorite–microcline–steacyite–quartz–charoite (Yakutskiy district); aegirine–tinaksite–galena–copper–fedorite–microcline–steacyite–quartz–charoite (Irkutskiy district). Melt and fluid-inclusion studies have shown that low temperature of formation occurred for mineral assemblages of brookite–anatase–feldspar–quartz rocks (from 210 to 280°C) with respect to those from charoite rocks (>800°C for early stage and 450 to 600°C for final stages of crystallisation). Kaneva et al. (Reference Kaneva, Shendrik, Radomskaya and Suvorova2020a) concluded that fedorite from the Gavrilovskaya was formed at a lower temperature with respect to fedorite of the other districts, as also testified by the larger amount of H2O found in the crystal structure of their sample Gav-43.
The fedorite-bearing sample of the present work is labelled Gav-33 (Fig. S1, in Supplementary material – see below) and was taken from brookite–quartz–feldspar rocks of the Gavrilovskaya zone (same locality as sample Gav-43 from Kaneva et al., Reference Kaneva, Shendrik, Radomskaya and Suvorova2020a). The zone is situated at the watershed of the Davan and Atbastakh Rivers, Irkutsk region, Bodaibo district (58°19'51“N, 119°5'45”E).
The host rock has a holocrystalline coarse- and medium-grained structure and uniform texture (massive). In the thin section, the sample mainly consists of fedorite (92 vol.%), with minor components such as quartz (5 vol.%), microcline (<1 vol.%), aegirine (<1 vol.%), amphibole (<1 vol.%), calcite (<1 vol.%), pectolite (<1 vol.%); accessory minerals are apatite and rutile (Fig. S2).
The sequence of mineral crystallisation in the Gav-33 sample from early to late is: aegirine, apatite, amphibole, fedorite, microcline, rutile, quartz, pectolite and calcite (Table S1).
Experimental
Chemical analysis
A fedorite single crystal was embedded in epoxy resin, polished and carbon coated before carrying out electron probe microanalysis. A JEOL JXA-8200 electron microprobe in full wavelength dispersive spectrometry mode was used. Operating conditions were: 15 kV accelerating voltage, 5 nA sample current, ~1 mm spot size and 40 s counting time. The standards used were: grossular (Si, Al and Ca); omphacite (Na); olivine (Mg); K-feldspar (K); rhodonite (Mn); fayalite (Fe); celestine (Sr); sanbornite (Ba); scapolite (Cl) and hornblende (F).
A Phi-Rho-Z routine (Pouchou and Pichoir, Reference Pouchou, Pichoir and Armstrong1985) was employed for the conversion from X-ray counts to oxide weight percentages (wt.%).
Thermal analysis
Simultaneous differential thermal, thermogravimetric and derivative thermogravimetric analysis (DTA/TG/DTG) were carried out with a Seiko SSC 5200 thermal analyser equipped with an ESS GeneSys Quadstar 422 quadrupole mass spectrometer which allowed the analysis of gases evolved during thermal processes. The measurements were performed both in air at a heating rate of 10°C/min in the temperature range 25–1075°C and in ultrapure He at 20°C/min in the heating range 25–1100°C. Mass analyses were done in multiple ion detection mode measuring the m/z ratios (ratio between the mass number and the charge of an ion) 17 to 20 for H2O/HOD/D2O isotopes and 19 for F.
X-ray diffraction analysis
Single crystals of fedorite were selected under an optical microscope and glued on the tip of a glass fibre. The crystal (0.60 × 0.59 × 0.05 mm) with the best diffraction behaviour was used for the in situ high-temperature X-ray diffraction experiment by means of a Bruker AXS APEX II diffractometer equipped with MoKα radiation (λ = 0.71073 Å) and a CCD area detector. The measurements were carried out in air from 25 to 600°C using a home-made heating device (Zema et al., Reference Zema, Ventruti, Tarantino and Micelli2022). Seven data collections were performed at temperatures of 25, 100, 200, 300, 400, 500 and 600°C; each data collection lasted ~11 hours. Before starting a new data collection, the crystal was equilibrated for ~30 min. Data reduction was done using the software SAINT (Bruker, Reference Bruker2007); empirical absorption corrections were applied by means of SADABS (Bruker, Reference Bruker2009); structure refinements were performed with the program CRYSTALS (Betteridge et al., Reference Betteridge, Carruthers, Cooper, Prout and Watkin2003) in the triclinic space group P $\bar{1}$ using reflections with I > 3σ(I) and starting from the atomic coordinates of fedorite (Gav-43 sample) reported in Kaneva et al. (Reference Kaneva, Shendrik, Radomskaya and Suvorova2020a). Overall scale factor, atomic positions and atomic displacement parameters were refined. At room temperature all cation and H2O occupancies (O20w–O24w oxygen atoms) were refined, whereas, starting from 100°C and for all data collected at higher temperatures the cation site occupancies were kept fixed, and only the H2O site occupancies were varied to avoid unstable refinements, unreasonable cation occupancies and/or high correlations with displacement parameters. The occupancies of the tetrahedral and octahedral sites were constrained to 1. The attempts to anisotropically refine the interlayer Na cations and the oxygen of the H2O resulted in physically unreasonable refinement parameters. Therefore, in the final refinement they were modelled isotropically. The analysis of the difference-Fourier maps showed the presence of residual electron density peaks less than 1 e –/Å3 which may be ascribed to the positional disorder of Na atoms. The modelling of this disorder, however, did not lead to a significant improvement of the refinement and was not included in the final structure model. The effective coordination numbers (ECoN) of the cations were calculated using the ECoN21 software (Ilinca, Reference Ilinca2022) considering the bond lengths that give a contribution >0.05 vu to the bond-valence sum (BVS) of the central cation (Brown, Reference Brown2006).
The crystallographic information files have been deposited with the Principal Editor of Mineralogical Magazine and are available as Supplementary material (see below) together with details on structure analysis (Tables S2 to S4).
Fourier-transform infrared spectroscopy
The infrared absorption spectra of fedorite were measured using an FT-801 spectrometer (Simex, Novosibirsk, Russia). Powdered samples were mixed with anhydrous KBr, pelletised and analysed at a resolution of 1 cm–1. A total of 32 scans were collected in the wavenumber range 500 to 4000 cm–1. The IR spectrum of an analogous pellet of pure KBr was used as a reference.
Infrared spectra for variable temperatures, aimed at the study of fedorite dehydration were carried out ex situ, in the temperature range 25–700°C, in steps of 50°C following the procedure described in Kaneva et al. (Reference Kaneva, Shendrik, Radomskaya and Suvorova2020a) and Sapozhnikov et al. (Reference Sapozhnikov, Tauson, Lipko, Shendrik, Levitskii, Suvorova, Chukanov and Vigasina2021), summarised briefly here. Fedorite and KBr were ground in a crucible, held at a given temperature for 5 min in a muffle furnace, and then quenched to room temperature. Afterwards, two pressed pellets were prepared: one consisting of a mixture of fedorite and KBr and another one of the pure KBr. Next, powders of both samples were heated to the next temperature in the interval 25–700°C, and the procedure was repeated. All pressed pellets were prepared and measured under the same conditions of low relative humidity (<20%). This preparation means that water adsorption in heated samples can be ignored.
Results and discussion
Chemical composition
The average chemical composition of the fedorite (wt.%) from the Gav-33 rock sample, determined over ten spots, is: SiO2 (65.74), Al2O3 (0.07), CaO (16.74), SrO (0.83), MnO (0.11), MgO (0.02), FeO (0.03), BaO (0.01), Na2O (8.58), K2O (2.28), F (2.46), Cl (0.21), total 94.68 wt.%. This composition is similar to that provided for fedorite from Gav-43 sample by Kaneva et al. (Reference Kaneva, Shendrik, Radomskaya and Suvorova2020a) with the only exception for Na2O 6.2(7) and K2O 5.8(5) wt.%.
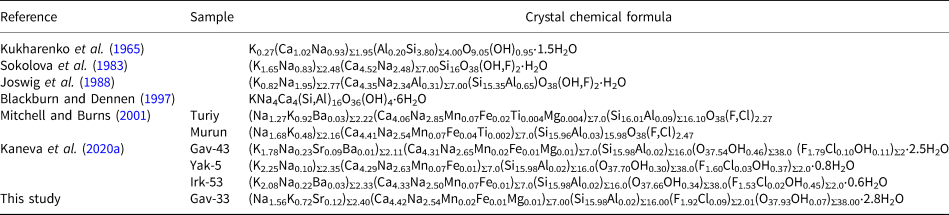
The crystal chemical formula of the sample studied, calculated on the basis of 16(Si+Al) and assuming the H2O content derived by the structure refinement (see below) is reported in Table 1, where it is compared with those reported from previous investigations on fedorite.
Crystal chemical formulae of the studied and literature fedorite.

It can be noted that Kukharenko et al. (Reference Kukharenko, Orlova, Bulakh, Bagdasarov, Rimskaya-Korsakova, Nefedov, Il'inskii, Sergeev and Abakumova1965) report only K+ as interlayer cation whereas Sokolova et al. (Reference Sokolova, Kashaev, Drits and Ilyukhin1983), Blackburn and Dennen (Reference Blackburn and Dennen1997) and Kaneva et al. (Reference Kaneva, Shendrik, Radomskaya and Suvorova2020a) found K+ and Na+ with K+ ≥ Na+. On the contrary, fedorite in Joswig et al. (Reference Joswig, Drits and Sokolova1988), Mitchell and Burns (Reference Mitchell and Burns2001) and in this study shows Na+ > K+.
The octahedral cations are essentially Ca2+ and Na+, except for minor amounts of Al3+, Mn2+, Fe2+, Ti4+ and Mg2+ reported by Joswig et al. (Reference Joswig, Drits and Sokolova1988), Mitchell and Burns (Reference Mitchell and Burns2001), Kaneva et al. (Reference Kaneva, Shendrik, Radomskaya and Suvorova2020a) and in this work.
The fedorite of Kukharenko et al. (Reference Kukharenko, Orlova, Bulakh, Bagdasarov, Rimskaya-Korsakova, Nefedov, Il'inskii, Sergeev and Abakumova1965) and Blackburn and Dennen (Reference Blackburn and Dennen1997) has no fluorine content, whereas other authors report (OH–, F– and Cl–) substitutions (Sokolova et al., Reference Sokolova, Kashaev, Drits and Ilyukhin1983; Joswig et al., Reference Joswig, Drits and Sokolova1988; Kaneva et al., Reference Kaneva, Bogdanov and Shendrik2020c). The fedorite of the present work shows only (F– and Cl–) substitution and is similar to the samples in Mitchell and Burns (Reference Mitchell and Burns2001). OH– groups substituting oxygen atoms are present in the formula of the crystal studied (0.07 groups per formula unit, gpfu) and in Kaneva et al. (Reference Kaneva, Shendrik, Radomskaya and Suvorova2020a), from 0.30 to 0.46 gpfu, possibly indicating substitutions of bridging tetrahedral–octahedral oxygen atoms (O1–O6). More specifically, Kaneva et al. (Reference Kaneva, Shendrik, Radomskaya and Suvorova2020a) provided direct evidence of the occurrence of OH– groups from FTIR analysis. In our case, the single crystal shows almost negligible OH– content whereas the FTIR spectrum collected from the powdered sample reveals vibrations matching OH-stretching (see below) indicating some heterogeneity of OH– concentrations in fedorite crystals.
Fedorite is also affected by different degrees of hydration. The H2O content derived from structure refinement was found to be 0.6 gpfu to 2.5 gpfu in Kaneva et al. (Reference Kaneva, Shendrik, Radomskaya and Suvorova2020a), 3.47 and 3.69 gpfu in Mitchell and Burns (Reference Mitchell and Burns2001) and 2.8 gpfu in the present work, but higher values are also reported in Blackburn and Dennen (Reference Blackburn and Dennen1997). The water content in fedorite from the Murun massif is consistent with the different temperature in the crystallisation environment of the relevant host rock as discussed in Kaneva et al. (Reference Kaneva, Shendrik, Radomskaya and Suvorova2020a), see the Geological background and sample description above.
Thermal data
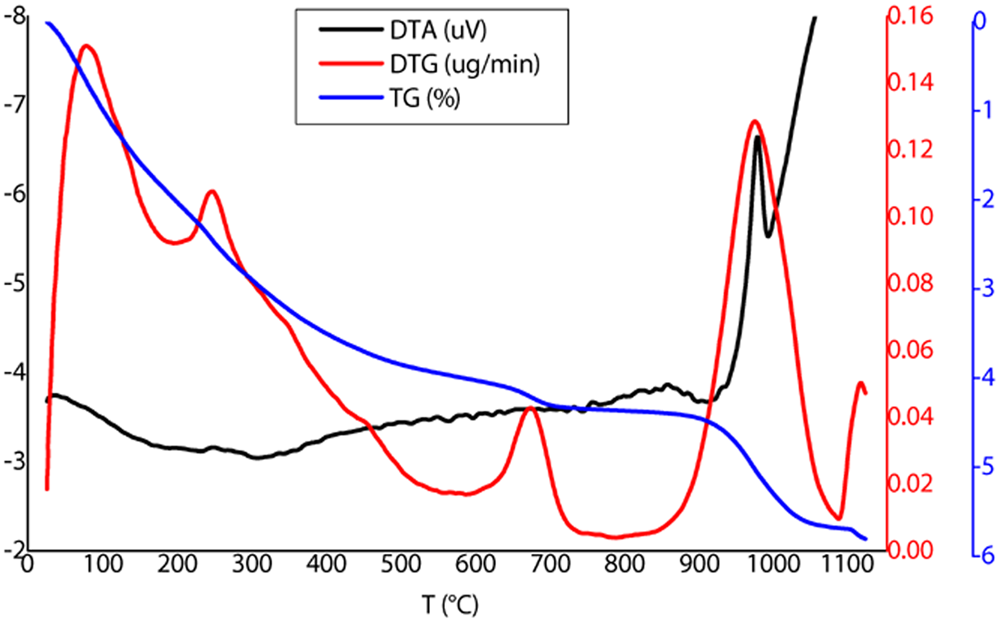
The TG/DTA/DTG experiments in air and He provided similar results (compare Fig. 1 and Fig. S3). The DTA curve shows an exothermic peak at ~950°C which may be associated with the breakdown of fedorite. The thermogravimetric analysis, instead, exhibits a weight mass decrease of ~4% (100–650°C temperature range) and 1.5% (1000–1050°C). The former mass decrease is compatible with a loss of 3.4 H2O. This value is comparable with that derived from single-crystal X-ray data (2.8 H2O gpfu, see below). The weight loss >900°C, instead, may be ascribed to the loss of fluorine as indicated by the measurement in the He atmosphere (Fig. S3).
Differential thermal analysis (DTA, black line), thermogravimetric analysis (TG, blue line), and the TG first derivative (DTG, red line) of sample Gav-33, measured in air.

Crystal structure at room temperature
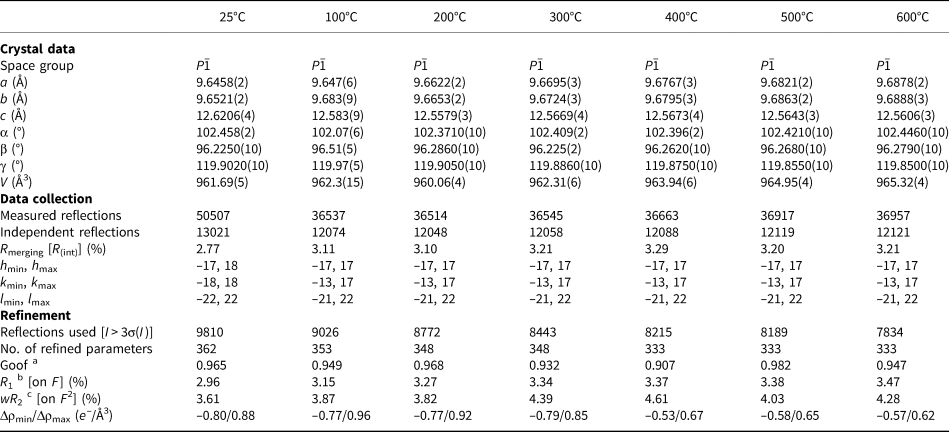
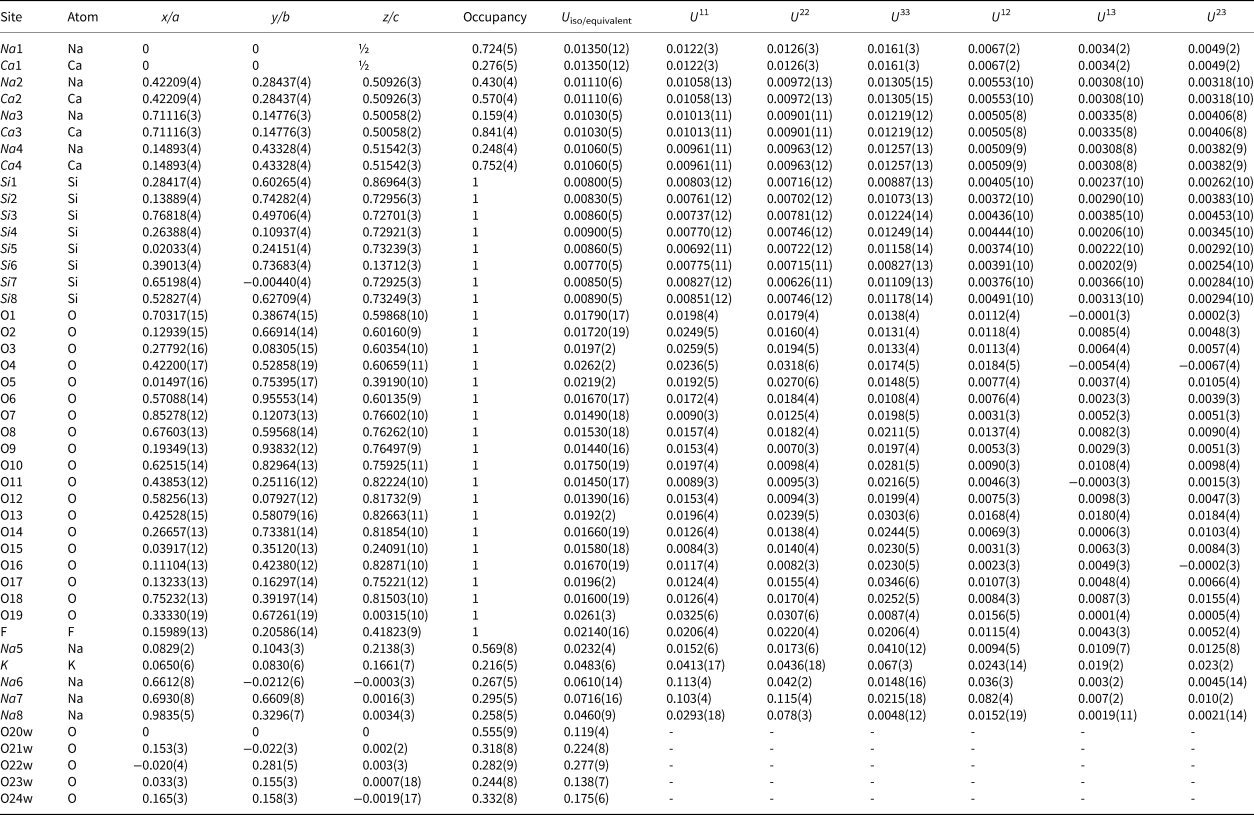
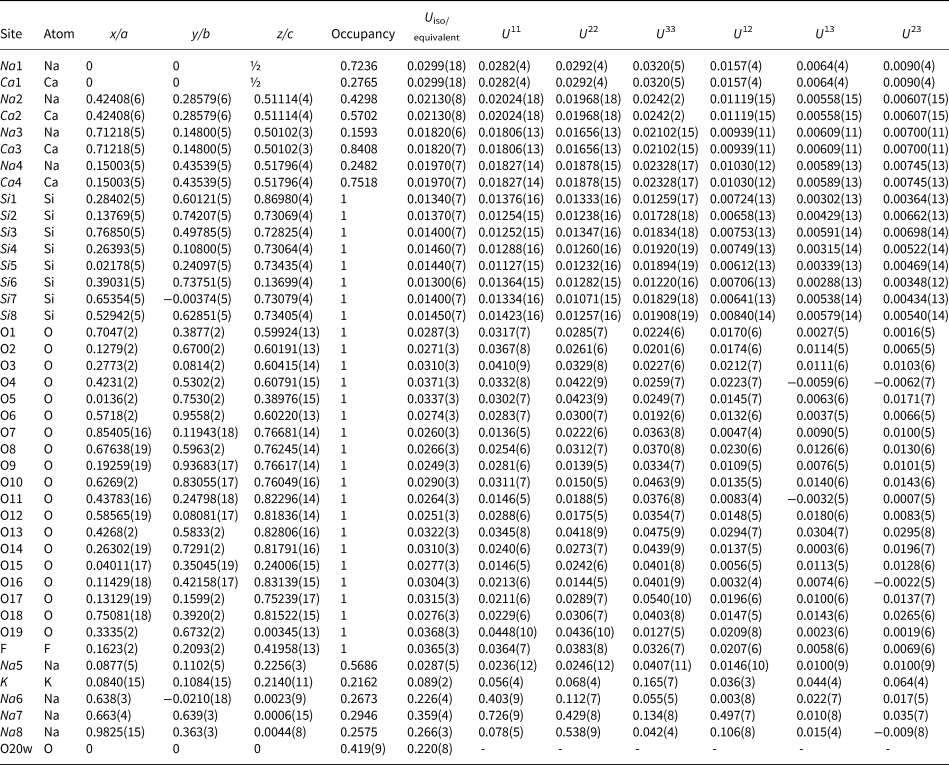
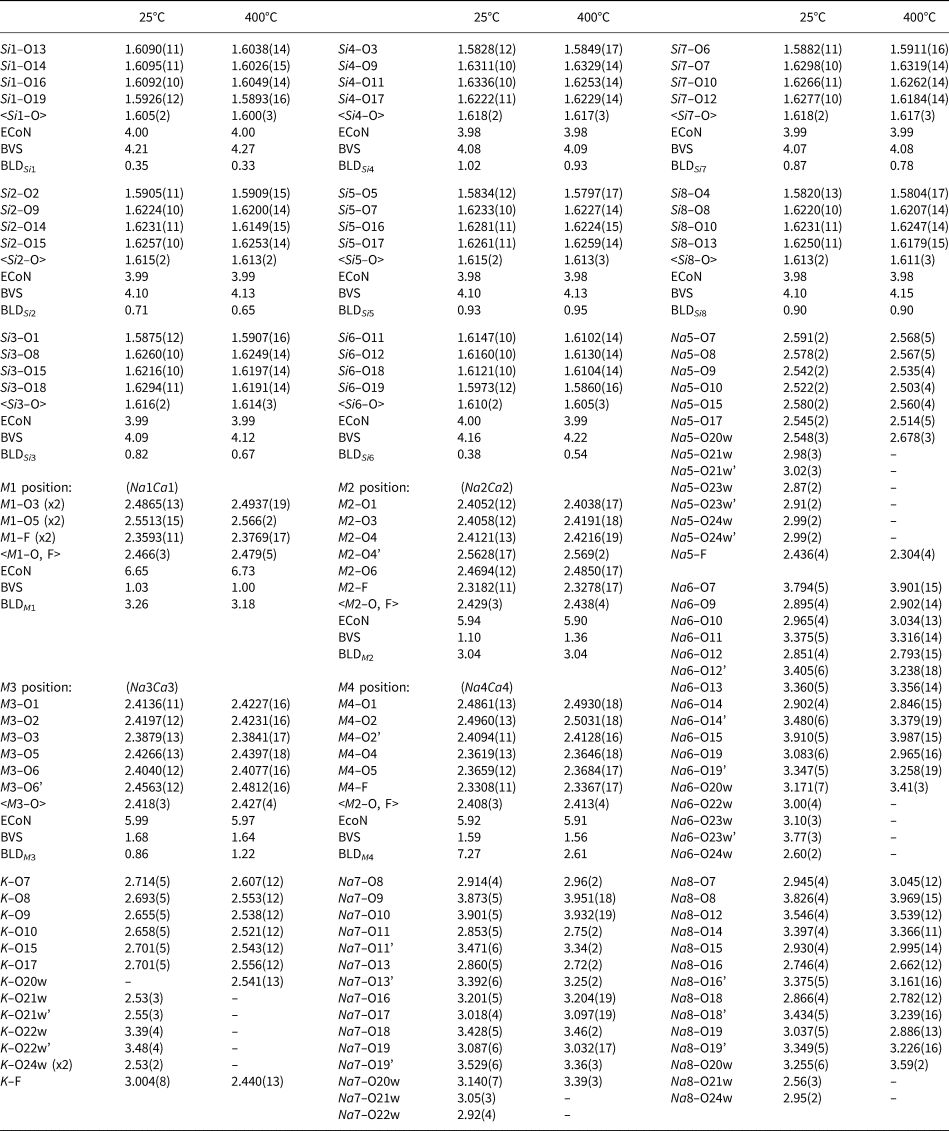
Room temperature refinement of the Gav-33 sample of fedorite was carried out in space group $P\bar{1}$ and converged to R 1 = 2.96%, wR 2 = 3.61% (Table 2). Unit-cell parameters and cell volume (a = 9.6458(2), b = 9.6521(2), c = 12.6206(4) Å, α = 102.458(2), β = 96.2250(10), γ = 119.9020(10)° and V = 961.69(5) Å3; Table 2) are almost identical to those reported in literature (Mitchell and Burns, Reference Mitchell and Burns2001; Kaneva et al. Reference Kaneva, Shendrik, Radomskaya and Suvorova2020a). Atomic coordinates, site occupancy and displacement parameters are reported in Table 3 and 4; bond distances, bond-length distortion, effective coordination numbers (ECoN) and bond-valence sums (BVS) of the central cations, are listed in Tables 5 and S4. Tables 3, 4 and 5 contain data at 25°C which are compared with those collected at 400°C, whereas data obtained at higher temperatures are reported in the supplementary materials. A general view of the crystal structure of fedorite is given in Fig. 2. In particular, Fig. 2b shows the regular hexagonal ring of downward-pointing tetrahedra and the distorted hexagonal ring composed of four downward-pointing tetrahedra and two upward-pointing tetrahedra extending in the ab plane, whereas Fig. 2a shows that the connection between single tetrahedral sheets occurs via Si1 and Si6 tetrahedra sharing the apical O19 oxygen. The Si1 and Si6 tetrahedra show slightly short mean tetrahedral distances due to the low values of the Si1–O19 and Si6–O19 individual distances (Fig. 2a; Table 5). The four symmetrically independent octahedra (M1 to M4) of fedorite exhibit mixed Na,Ca occupancy. In detail, X-ray site-scattering refinement indicates a preferential partitioning of Na for the octahedral M1 site, an almost equal distribution of Na and Ca at M2, and the prevalence of Ca at M3 and M4 sites (Tables 3, 4). Similar octahedral site occupancies were reported for other fedorite from Murun by Kaneva et al. (Reference Kaneva, Shendrik, Radomskaya and Suvorova2020a). The M1O42–F2– octahedron, exhibits the longest average bond distance and the highest bond-length distortion (BLD parameter) whereas the M3O62– octahedron is more regular (Table 5).
(a) Crystal structure of the fedorite sample, Gav-33; (b) a detail, as seen along [001], of tetrahedral (orange) and octahedral (blue) sites. Interlayer site occupied by Na+ (dark yellow) and K+ (light yellow) cations. Oxygen and fluorine atoms are represented in red and green, respectively.

Selected crystallographic data and experimental conditions for the studied fedorite (Gav-33 sample) at room temperature and from 100 to 600°C.

a Goodness of fit = [Σ[w(F o2–F c2)2]/(N–p)]½, where N and p are the number of reflections and parameters, respectively.
b R 1 = Σ[|F o| – |F c|]/Σ|F o|.
c wR 2 = [Σ[w(F o2–F c2)2]/Σ[w(F o2)2]]½, w = 1.0/[A[0]*T[0]'(X)+A[1]*T[1]'(X) … +A[NP–1]*T[NP–1]'(X)] (Chebyshev optimised weights). The optimised parameters for each refinement are reported in the deposited Crystallographic Information Files.
Crystallographic coordinates, occupancies, equivalent isotropic (Å2) and anisotropic displacement parameters of the fedorite studied at 25°C.

Crystallographic coordinates, occupancies, equivalent isotropic (Å2) and anisotropic displacement parameters of the studied fedorite at 400°C.

Selected bond distances (Å), effective coordination number (ECoN), bond-valence sums (BVS, vu) and bond-length distortion (BLD parameter, %) derived from the structure refinement of the studied fedorite at 25 and 400°C.

BVS = Σsij = Σj exp [(R O–Rij)/B], where Rij is the bond length between ions i and j, sij is the bond valence, R O and B are the bond-valence parameters (Brown and Altermatt, Reference Brown and Altermatt1985; Brese and O'Keeffe, Reference Breese and O'Keeffe1991). For sites with mixed site occupancy, weighted bond-valence sums are given. BLD parameter error estimated by varying the refined positional parameters within one standard deviation is in the 0.1–13% range.
The interstitial complex of fedorite consists of Na and K atoms at Na5, K, Na6, Na7 and Na8 sites. In detail, the Na5 and K sites site are separated by 0.568(6) Å and are occupied by 57% Na and 22% K, respectively. The coordination polyhedron of the cation at the Na5 site contains eight ligands (six oxygen atoms of the tetrahedral ring, one H2O at O20w position and one F atom), see Tables 5, S4. The coordination polyhedron around the atom at the K site consists of six oxygens of the tetrahedral ring and one F atom (Table S4). Finally, the Na6 to Na8 sites are characterised by low Na occupancy (26–30%, Tables 3, 4) and an ill-defined coordination environment (Table S4).
Occupancy refinement of the five H2O positions (O20w to O24w) of our Gav-33 sample showed that the O20w site is the most populated, with occupancy of 56% versus 53% refined by Kaneva et al. (Reference Kaneva, Shendrik, Radomskaya and Suvorova2020a) for sample Gav-43. The O21w to O24w sites have occupancy in the range 24–33% in Gav-33 versus 20–32% in Gav 43. The refinement also shows short K–O20w, Na6–O21w, Na7–O24w, Na8–O22w and Na8–O23w distances (1.980(8), 1.63(3), 1.60(2), 0.45(5) and 1.96(3) Å, respectively) indicating atom disorder and the occurrence of a range of configurations, from partially occupied sites to mutually exclusive positions. Short distances between H2O (1.36(2)–1.59(3) Å) point to a statistical distribution of the molecules.
Crystal structure modifications and vibrational features upon heating
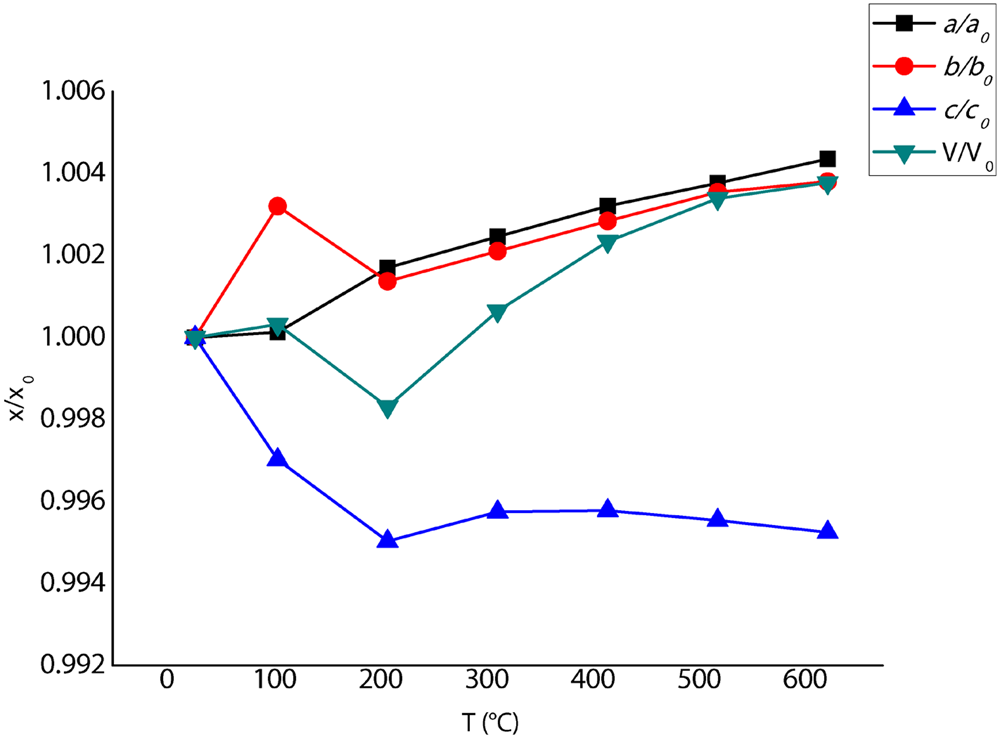
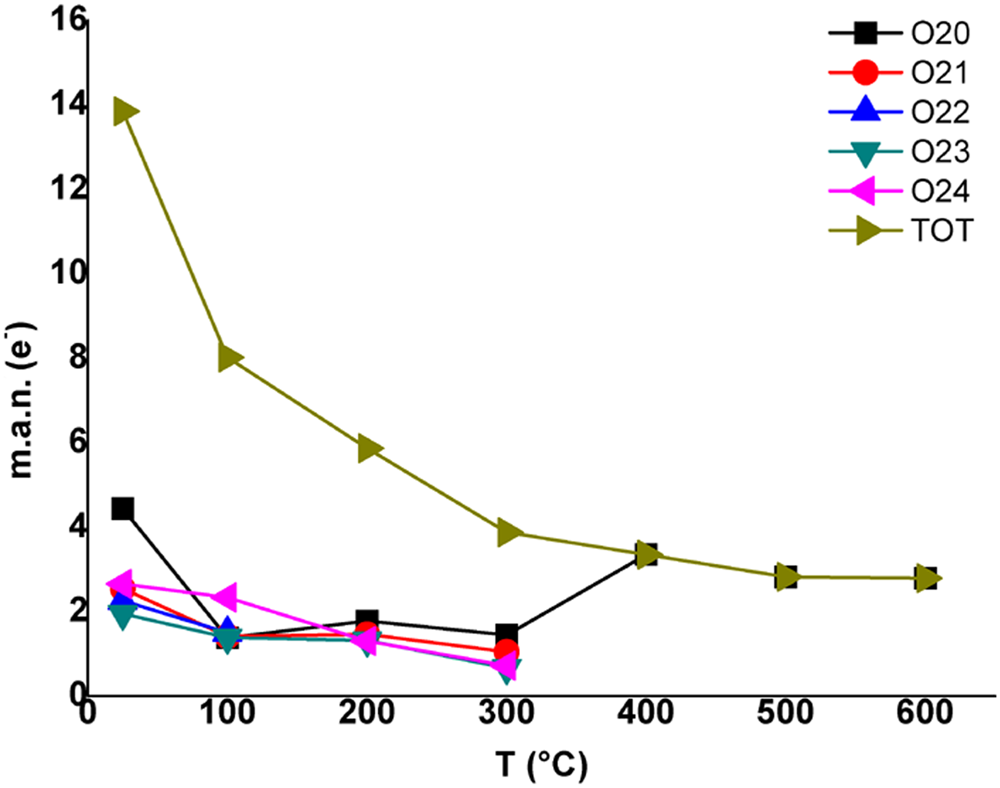
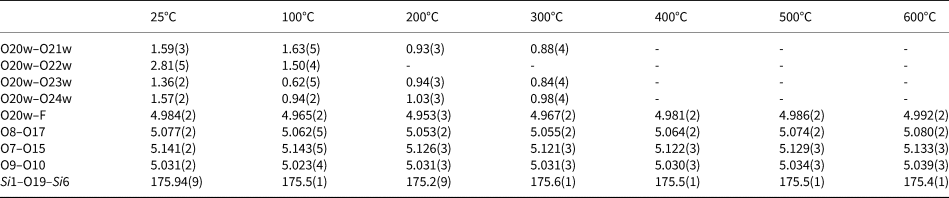
The thermal expansion of the fedorite structure proceeds from room temperature (RT) to 600°C without change in symmetry (P $\bar{1}$ ) and with a variation of the cell volume which encompasses the expansion along the a and b axis but also the decrease of the c cell dimension (Fig. 3; Table 2). With increasing temperature, the mineral progressively dehydrates up to 300°C when fedorite loses most of the H2O as testified by the trend of the occupancies of O20w to O24w sites (Tables 3, 4, S2). In particular, the H2O at O22w, which is very close to the interlayer cation at Na8 at RT, is lost after 100°C (Fig. 4). The H2O at O21w, O23w and O24w positions, located in the ab plane, tend to shift toward the O20w site (Fig. 4a–e; Table 6). O20w is indeed the only occupied site at T ≥ 400°C (Tables 3, 4, S2). Figure 5 shows that the total mean atomic number of the H2O sites progressively decrease with temperature whereas the electron density of the O20w increases at T > 300°C as a consequence of the H2O migration from the O21w, O23w and O24w sites towards O20w.
Normalised unit-cell parameters and volume of the studied fedorite versus temperature. a 0, b 0, c 0 and V 0 are cell parameters and volume at room temperature, respectively. The size of the symbols is larger than the associated esd's.

(a–e) Interlayer cavity of fedorite from refined structure in the RT–400°C temperature range with O–O internal diagonal distances in Å; (f) extended interlayer cavity view. Colours as reported in Fig. 2; grey arrows indicate the shift of Na cations with the temperature.

Mean atomic numbers (m.a.n., e –) of H2O versus temperature.

Selected anion–anion bond distances (Å) and Si1–O19–Si6 bond angles (°) derived from the structure refinement of the studied fedorite from 25 to 600°C.

The dehydration process proceeds from RT up to 400°C causing the distortion of the hexagonal rings of downward-pointing tetrahedra as testified by the shortening of the O8–O17 and O7–O15 internal diagonal distances (Fig. 4a,e; Table 6). The cations in the Na5/K site shift along the c axis direction by moving away from the O20w and towards the F atoms, with a consequent remarkable lengthening of the Na/K–O20w distance that is balanced by the shortening of the Na/K–F distance (Fig. S4; Tables 5, S3). On the contrary, the cations at the Na6, Na7 and Na8 interlayer sites seem to move substantially in the ab plane, with their z coordinates almost unchanged during heating (Tables 3, 4, S2). In particular, they progressively increase their distance from O20w (Fig. S4). In addition, the cation at Na6 slightly moves away from the O10 atom and approaches O14; the cation at Na7 moves away from the O17 and shifts towards O11 and O13; the cation at Na8 moves from the O7 and O15 atoms towards the O16, O18 and O19 oxygens (Fig. S4, 4f). This also results in the shortening of the distances between equivalent Na cations (see the arrows directions in Fig. 4f). A slight variation of the effective coordination number (ECoN parameter, from 9.86 to 7.90) of the cation at the Na5 site from RT to 400°C has been observed.
Finally, structure refinements of the partially dehydrated fedorite (from 400 to 600°C) show that no significant geometric modifications of the tetrahedral and octahedral sheets were induced by the heating process, as quite similar values were obtained for tetrahedral and octahedral mean distances and geometrical parameters (Tables 5, S3).
The infrared spectra of the fedorite sample annealed at different temperatures (from 25 to 700°C) are given in Fig. 6. The group of peaks observed at 1119, 1030, 790, 618 cm–1 may be assigned to the asymmetric and symmetric Si–O stretching modes of the SiO4 tetrahedra.
IR absorption spectra of fedorite annealed at different temperatures. Inset shows the region of O–H stretching vibrations in detail.

The peak at 618 cm–1 in the sample studied is slightly shifted in comparison with the same peak in Gav-43 and Irk-53 samples (615 cm–1; Kaneva et al. Reference Kaneva, Shendrik, Radomskaya and Suvorova2020a). The energy of bending vibrations of SiO4 at 615 cm–1 slightly increased in the sample studied, which contains a greater amount of H2O. The same behaviour of SiO4 bending vibrations has been observed in elpidite samples in Bogdanov et al. (Reference Bogdanov, Kaneva and Shendrik2021).
Intensities of H–O–H asymmetric and symmetric stretching vibrations in the region 3000–3700 cm–1 (inset in Fig. 6) and bending ones at 1627 cm–1 decreased during annealing. This indicates that the fedorite sample lost H2O. In addition, the peak at 790 cm–1 in the pristine sample shifts to 796 cm–1 in the sample annealed at 700°C, when fedorite lost almost all H2O. This could be due to a slight change in Si–O–Si angles during annealing (Shendrik et al., Reference Shendrik, Kaneva, Radomskaya, Sharygin and Marfin2021).
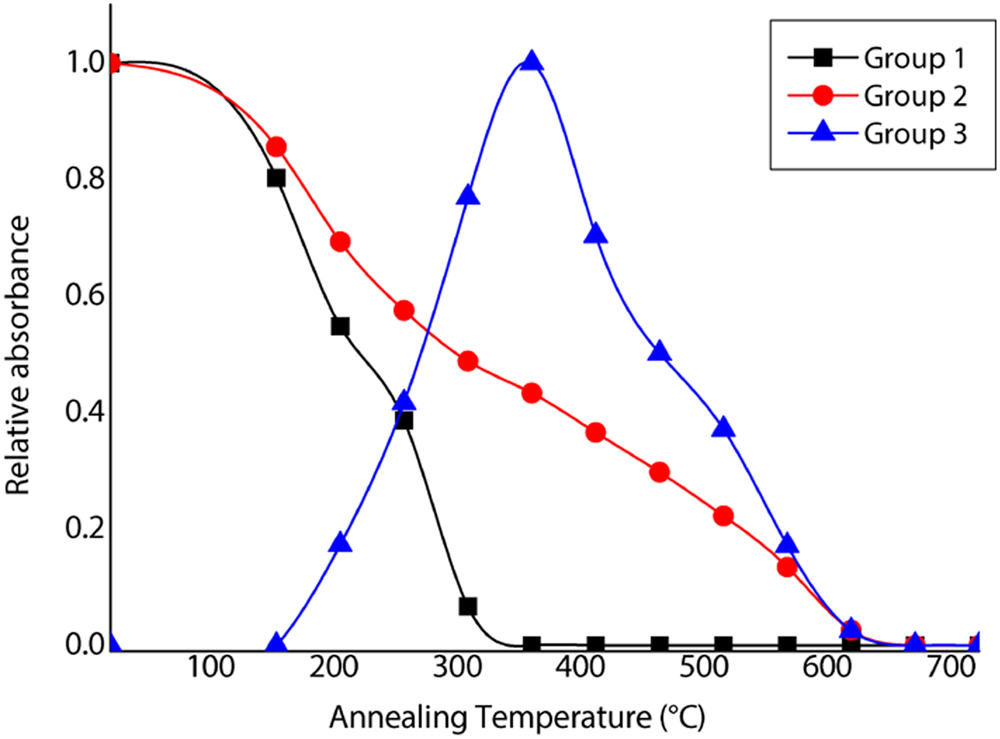
The 3000–3700 cm–1 region of the absorption spectrum related to OH-stretching vibrations has a complicated shape (Fig. 6). Six peaks, at 3177, 3429, 3549, 3588, 3635 and 3656 cm–1, can be seen clearly for the sample at room temperature. Such peaks are similar to those found in the Irk-53 sample (Kaneva et al. Reference Kaneva, Shendrik, Mesto, Bogdanov and Vladykin2020b). Three groups of peaks can be distinguished on the basis of the behaviour during heating (Figs 6, 7). Group 1 includes the 3588 and 3656 cm–1 peaks. The intensity of these peaks decreases as the temperature increases and becomes negligible at temperatures >327°C (Fig. 7). Group 2 includes the 3177, 3429, 3549 and 3635 cm–1 peaks. Their intensity gradually decreases upon annealing and becomes negligible above 627°C (Fig. 7). Group 3 includes 3576 and 3650 cm–1 peaks. The latter start to be observed at >150°C and show the maximum intensity at 350°C (Fig. 7). Further annealing at higher temperatures leads to a decrease in their intensity. Peaks belonging to Group 1 and 3 are sharp and may be attributed to OH-anions in different positions or to O–H stretching vibrations (hydrogen bonds of medium strengths). Group 2 bands may be attributed to H2O with a strong hydrogen bond. The trends of the band intensities (Fig. 7) in the FTIR spectra could be explained by taking into account the results of the HT-SXRD structure refinements. Specifically, the quick decrease of the intensity observed for Group 1 agrees with the reduction of the total H2O mean atomic numbers up to 300°C (Fig. 5). The intensity variation of Group 3 seems to describe the migration of H2O at T ≥ 100°C (Fig. 4). Finally, the gradual decrease of the band intensity of Group 2 represents the evolution of the dehydration process very well, affecting the fedorite up to T ≈ 600°C, as described above.
Temperature dependence as a function of the relative intensity of IR absorption of different OH-stretching vibration groups for the annealed fedorite sample.

Conclusions
For the first time a combination of thermal, in situ HT-SCXRD and ex situ HT-FTIR analyses has allowed the thermal behaviour, and specifically, the dehydration process of a fedorite sample from Murun massif to be examined in detail.
The mineral contains ~3 H2O gpfu, which occupy five different crystallographic sites (O20w to O24w) in the structure refined at room temperature, whereas at 600°C only O20w is occupied. Fedorite underwent thermal expansion in the whole temperature range (25–600°C) explored by XRD with a preferential dilatation along the a and b axes while a decrement in the c cell parameter was a consequence of the dehydration process. It is interesting that the dehydration of fedorite results in an expansion of the unit-cell volume (~0.4%). Other minerals (i.e., layered minerals) are usually subjected to a remarkable volume contraction following dehydration. Volume contraction in fedorite upon dehydration is actually limited by the topology of the [Si16O38]12– unit that is described by Hawthorne et al. (Reference Hawthorne, Uvarova and Sokolova2019). As shown in Fig. 2, the single tetrahedral sheets are interconnected by Si1 and Si6 tetrahedra that intrude the interlayer space thus forming the ‘rigid skeleton’ of the cavity where alkaline cations and H2O are hosted. As the temperature increases from 25 to 600°C, Si1 and Si6 tetrahedra do not vary in terms of individual and average bond distances (see Table 5, S3) whereas the Si1–O19–Si6 angles show a variation (from 175.94(9) to 175.4(1)°, see Table 6) that, although small, has the same trend as the c-cell parameter (Fig. 3). This could explain why the cavity cannot shrink significantly after losing the H2O.
All the analytical techniques used testified for a continuous dehydration reaction up to T ≈ 600°C, whereas the complete loss of H2O at 650–700°C was highlighted by the TG curve. The combination of the XRD and FTIR results allowed us to examine the features of the partially dehydrated structures in detail. In particular, one H2O (at the O22w site) leaves the interlayer site early, whereas a reduction in the amount of the remaining H2O proceeds rapidly up to T ≈ 300°C. This process is accompanied by the migration of the H2O at O21w–O24w sites towards the O20w position and by the shortening of Na–Na distances for the cations at Na6 to Na8 sites. The release of the F atoms occurred above 700°C (TG curve) whereas the breakdown of the structure at ~1000°C was demonstrated by the DTA curve.
Finally, the present work reports the thermal behaviour of a fedorite sample with Na+ > K+. Note that this composition is different from that of fedorite as defined in the IMA–CNMNC List of Mineral Names (Pasero, Reference Pasero2023), however it is similar to that reported in previous studies (specifically Joswig et al., Reference Joswig, Drits and Sokolova1988 and Mitchell and Burns, Reference Mitchell and Burns2001). Although a different K/Na ratio could affect the dehydration process, the overall thermal behaviour of the mineral is not expected to vary significantly because of the bond topology. However, further studies on samples with different compositions have to be carried out to understand how the crystal chemistry of fedorite affects its structural modification at high temperature.
Acknowledgements
Vasiliy Sychev is thanked for providing the samples for the study; Mikhail Mitichkin for sample polishing and thin-section preparation; Prof. Stefano Poli and Dr. A. Risplendente for the facilities at the Electron Microprobe Laboratory of the Dipartimento di Scienze della Terra, Università di Milano; Prof. D. Malferrari for performing thermal analysis. The IR spectroscopic and optical petrographic study were carried out using facilities of the Vinogradov Institute of Geochemistry SB RAS (Irkutsk). The optical petrographic study was performed by the governmental assignment in terms of Project № 0284-2021-0008. This work was supported by a M. Lacalamita grant (SIMP 2020 Research Grant in Crystal-chemistry, in memory of Prof. Fiorenzo Mazzi). Three anonymous referees are gratefully acknowledged for their insightful suggestions.
Supplementary material
The supplementary material for this article can be found at https://doi.org/10.1180/mgm.2023.31.
Competing interests
The authors declare none.